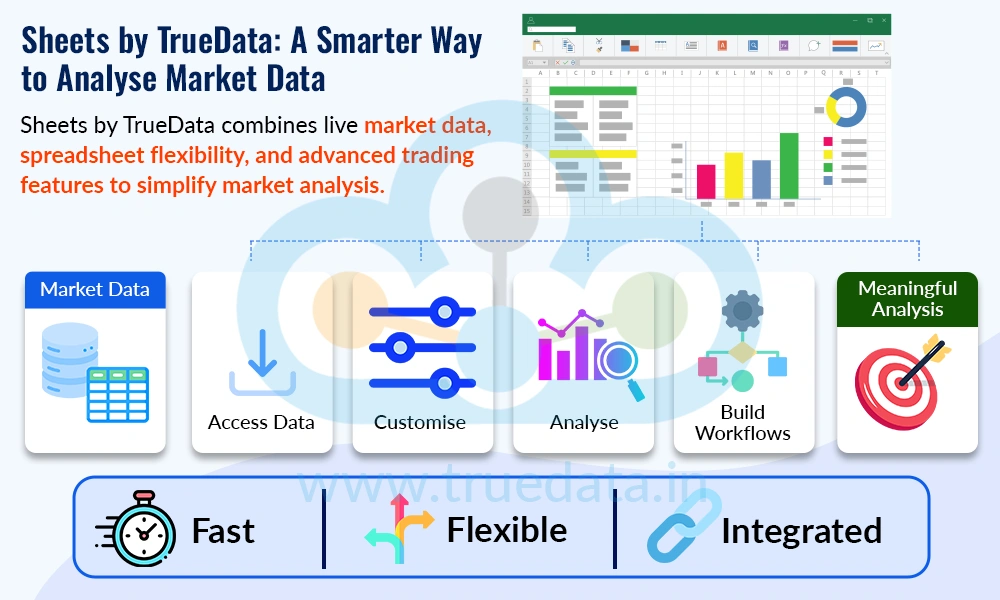
Market data is the foundation of informed trading decisions, and having access to accurate, real-time data can make a significant difference when identifying and acting on market opportunities. But what if the data is not delivered quickly enough and is presented in a format that makes quick analysis difficult? This is where Sheets by TrueData comes in. Our latest innovation gives traders access to timely market data with updates under 50 milliseconds, along with customisable formats and advanced analysis tools designed to suit different trading styles. Let us explore how Sheets by TrueData can help traders access, organise and analyse market data more efficiently.

Sheets by TrueData is a web-based spreadsheet platform designed specifically to bring real-time market data, trading analytics, historical data, fundamentals, charts, alerts, templates and scripting capabilities into a single workspace. With live market data updated in under 50 milliseconds, traders can use spreadsheet-style formulas to pull and organise the data they need.
The platform is designed to go beyond simply displaying market data. It allows traders to fetch, analyse, customise and act on market information within the same environment, thereby combining spreadsheet functionality with live market data capabilities.
This makes it possible to create a customised trading workspace without having to depend entirely on a fixed dashboard or manually copy market data into a spreadsheet. The platform also supports more than 200 standard spreadsheet functions, allowing traders to combine market-data functions with conventional spreadsheet calculations.

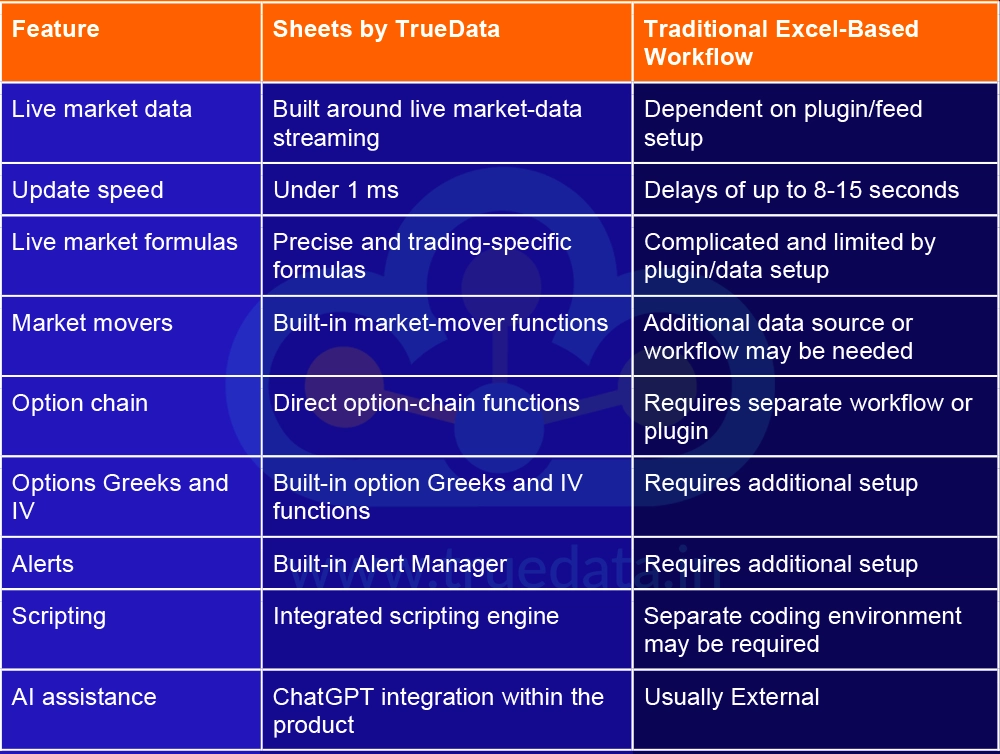
One of the key reasons behind the development of Sheets was the limitations experienced with the earlier Excel-based market-data workflow.
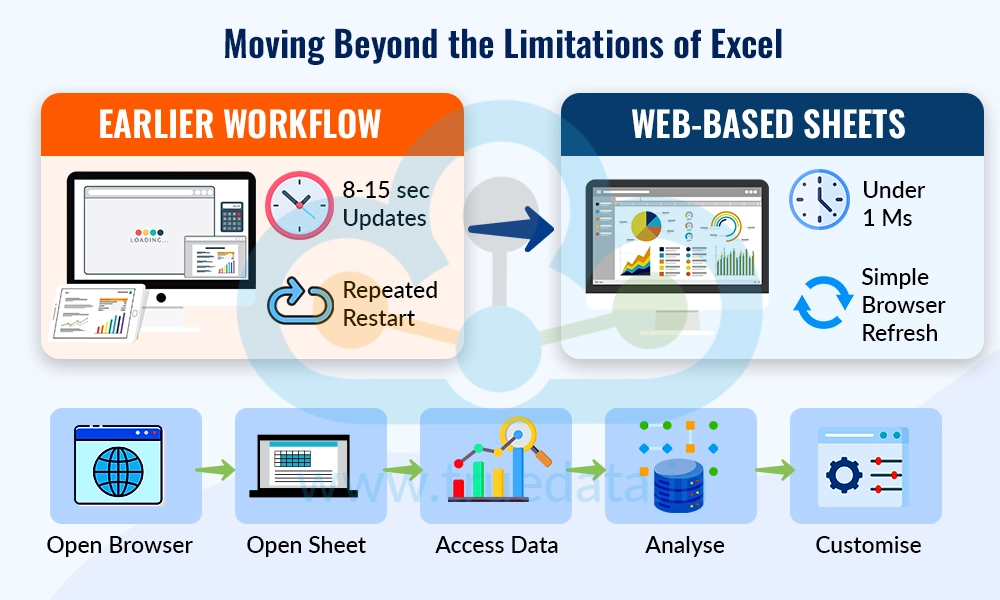
The Excel plugin, Velocity, could experience reliability issues during trading sessions. These included data updates taking around 8-15 seconds, the need for daily restarts and, in some cases, multiple restarts during a single market session.
For active traders, such delays and interruptions can be inconvenient.
A trader monitoring an option chain, for example, may want to see changes in price and open interest almost immediately. Having to restart the application repeatedly or deal with inactive master files and expired symbols can disrupt the workflow.
Sheets approaches the problem differently by being web-based, providing uninterrupted market data and eliminating the need to refresh the application.
This creates a simpler workflow,
Open the browser → Open the sheet → Access market data → Analyse → Customise.
.webp)
A conventional spreadsheet is primarily designed for calculations and data management. Sheets by TrueData adds a market-data layer to that environment.
This means traders can combine many features within the same workspace.
Live Market Data + Sheets Formulas + Trading Analytics + Charts + Alerts + Scripting
The distinction is important because traders often need to move between multiple tools. They may obtain market data from one application, perform calculations in a spreadsheet, study an option chain somewhere else and set alerts through another platform.
Sheets aims to bring many of these activities into one environment.
While Sheets by TrueData can seem like traditional Excel-based trading, the key difference lies in how deeply the spreadsheet is connected to live trading data and trading-specific tools.


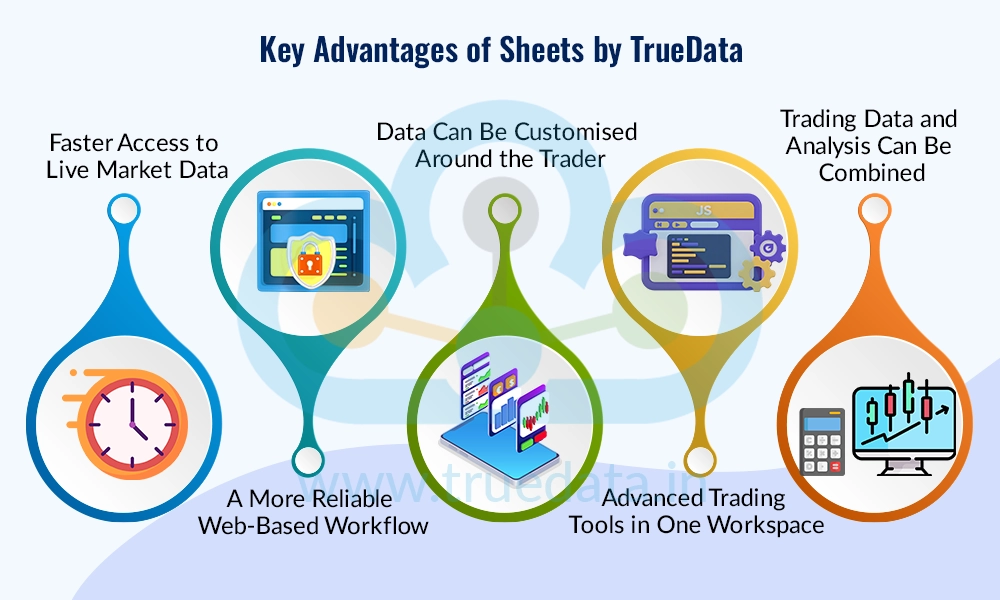
Sheets by TrueData is designed specifically around trading workflows rather than general spreadsheet use. Its advantages can be understood through five key areas.
Speed is particularly important for traders who monitor rapidly changing market conditions. Sheets by TrueData is designed to provide live data updates with updates in under 50 milliseconds.
This is a significant difference from the 10+ second update delays from the earlier Excel workflow.
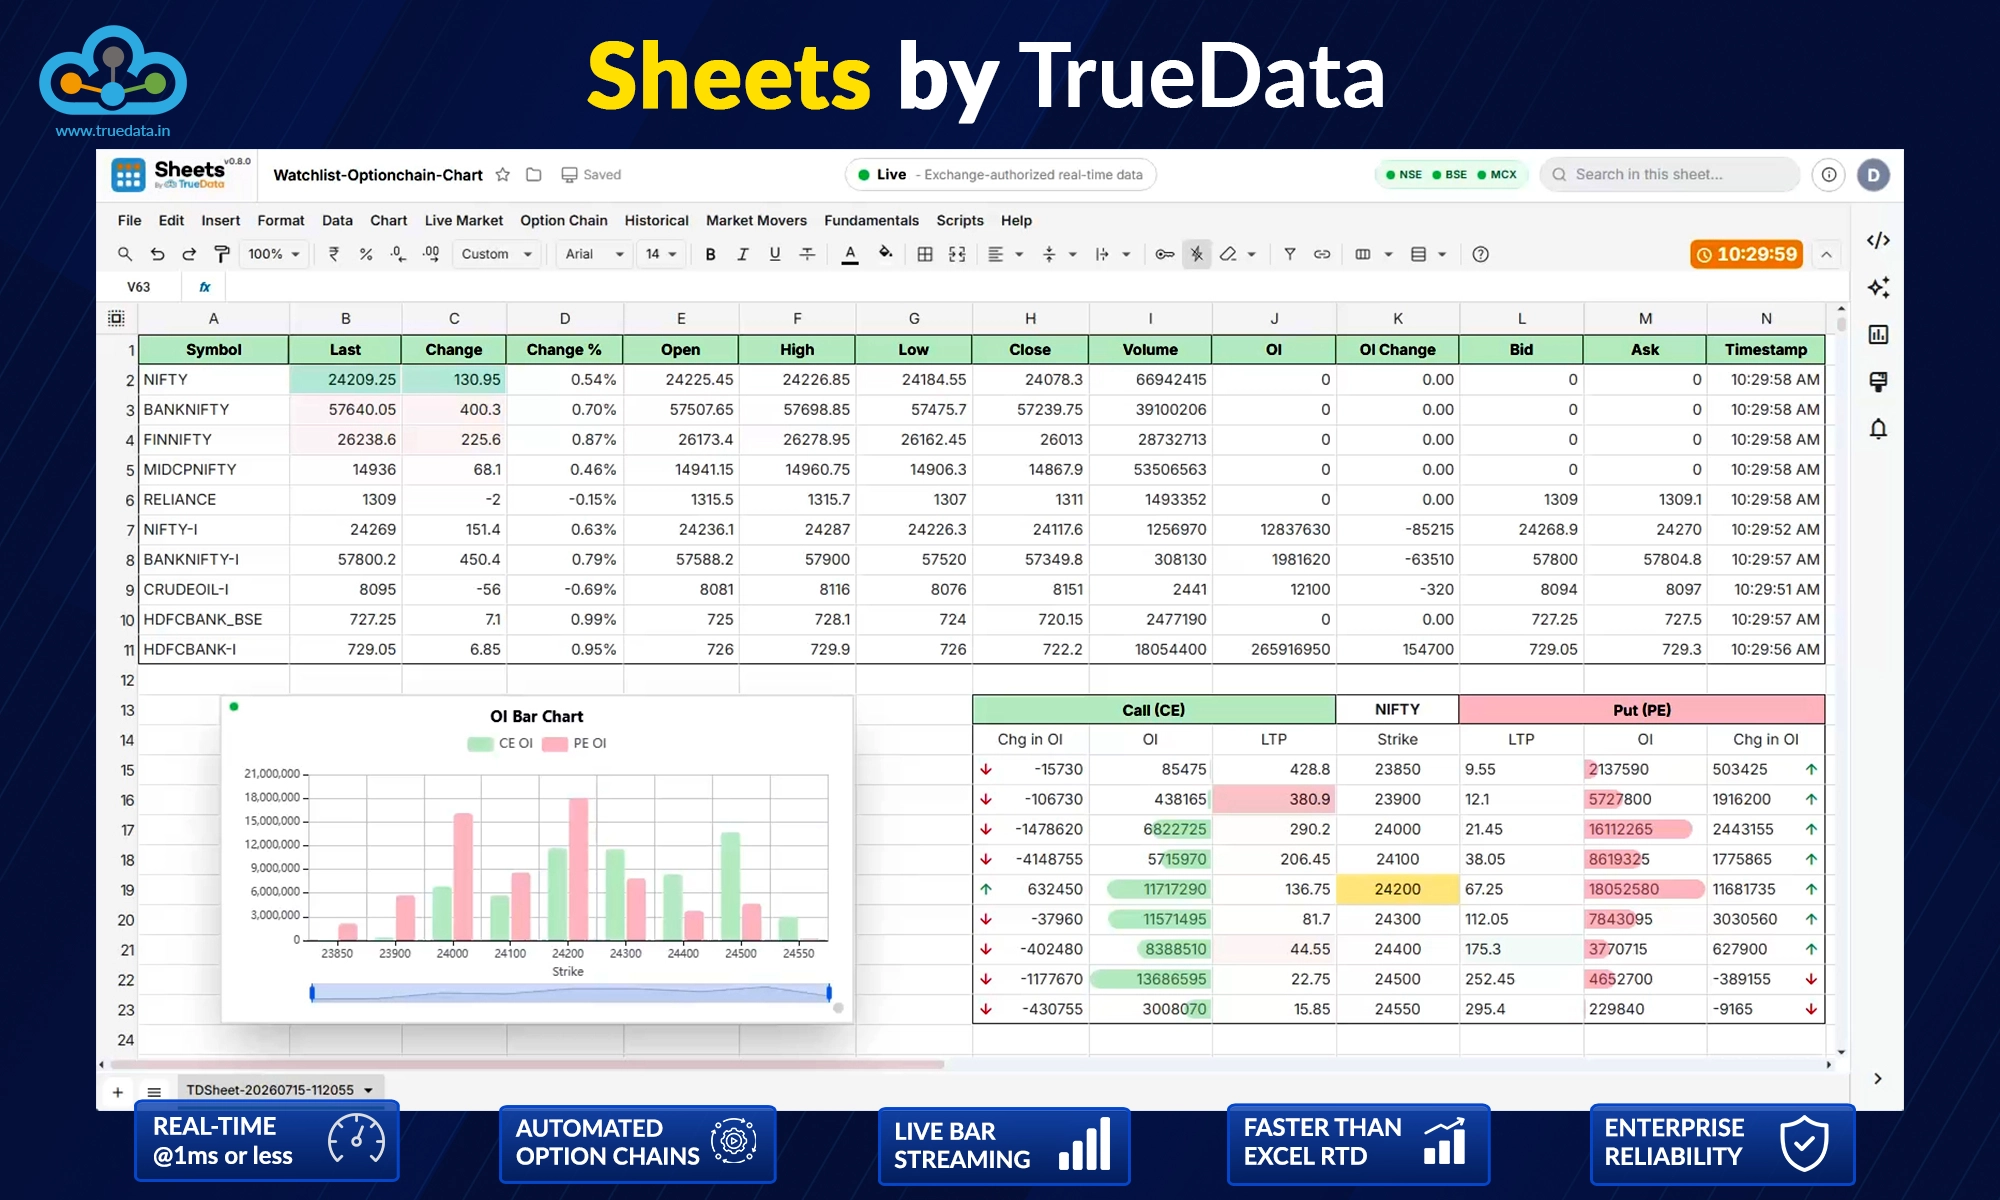
The platform's live market formulas can stream information such as LTP, bid, ask quantity and change directly into spreadsheet cells. For a trader, this means the spreadsheet can become a live market-monitoring workspace rather than a static data table.
The web-based design removes the dependency on repeatedly restarting an Excel plugin. This can be particularly useful during active market sessions, when traders need their attention focused on the market rather than troubleshooting their data feed.
Not every trader needs the same information.
For example,
An options trader may prioritise,
Strike price
Call and put prices
Open interest
OI change
Max pain
A momentum trader may instead focus on,
LTP
Percentage change
High and low
Turnover
Top gainers and losers
Sheets allows traders to build their spreadsheet around the information they actually use. This customisation is one of its key strengths as traders do not have to work with one fixed layout.
Sheets not only help fetch market data, but traders can also use Sheets Formulas and calculations to analyse that data.
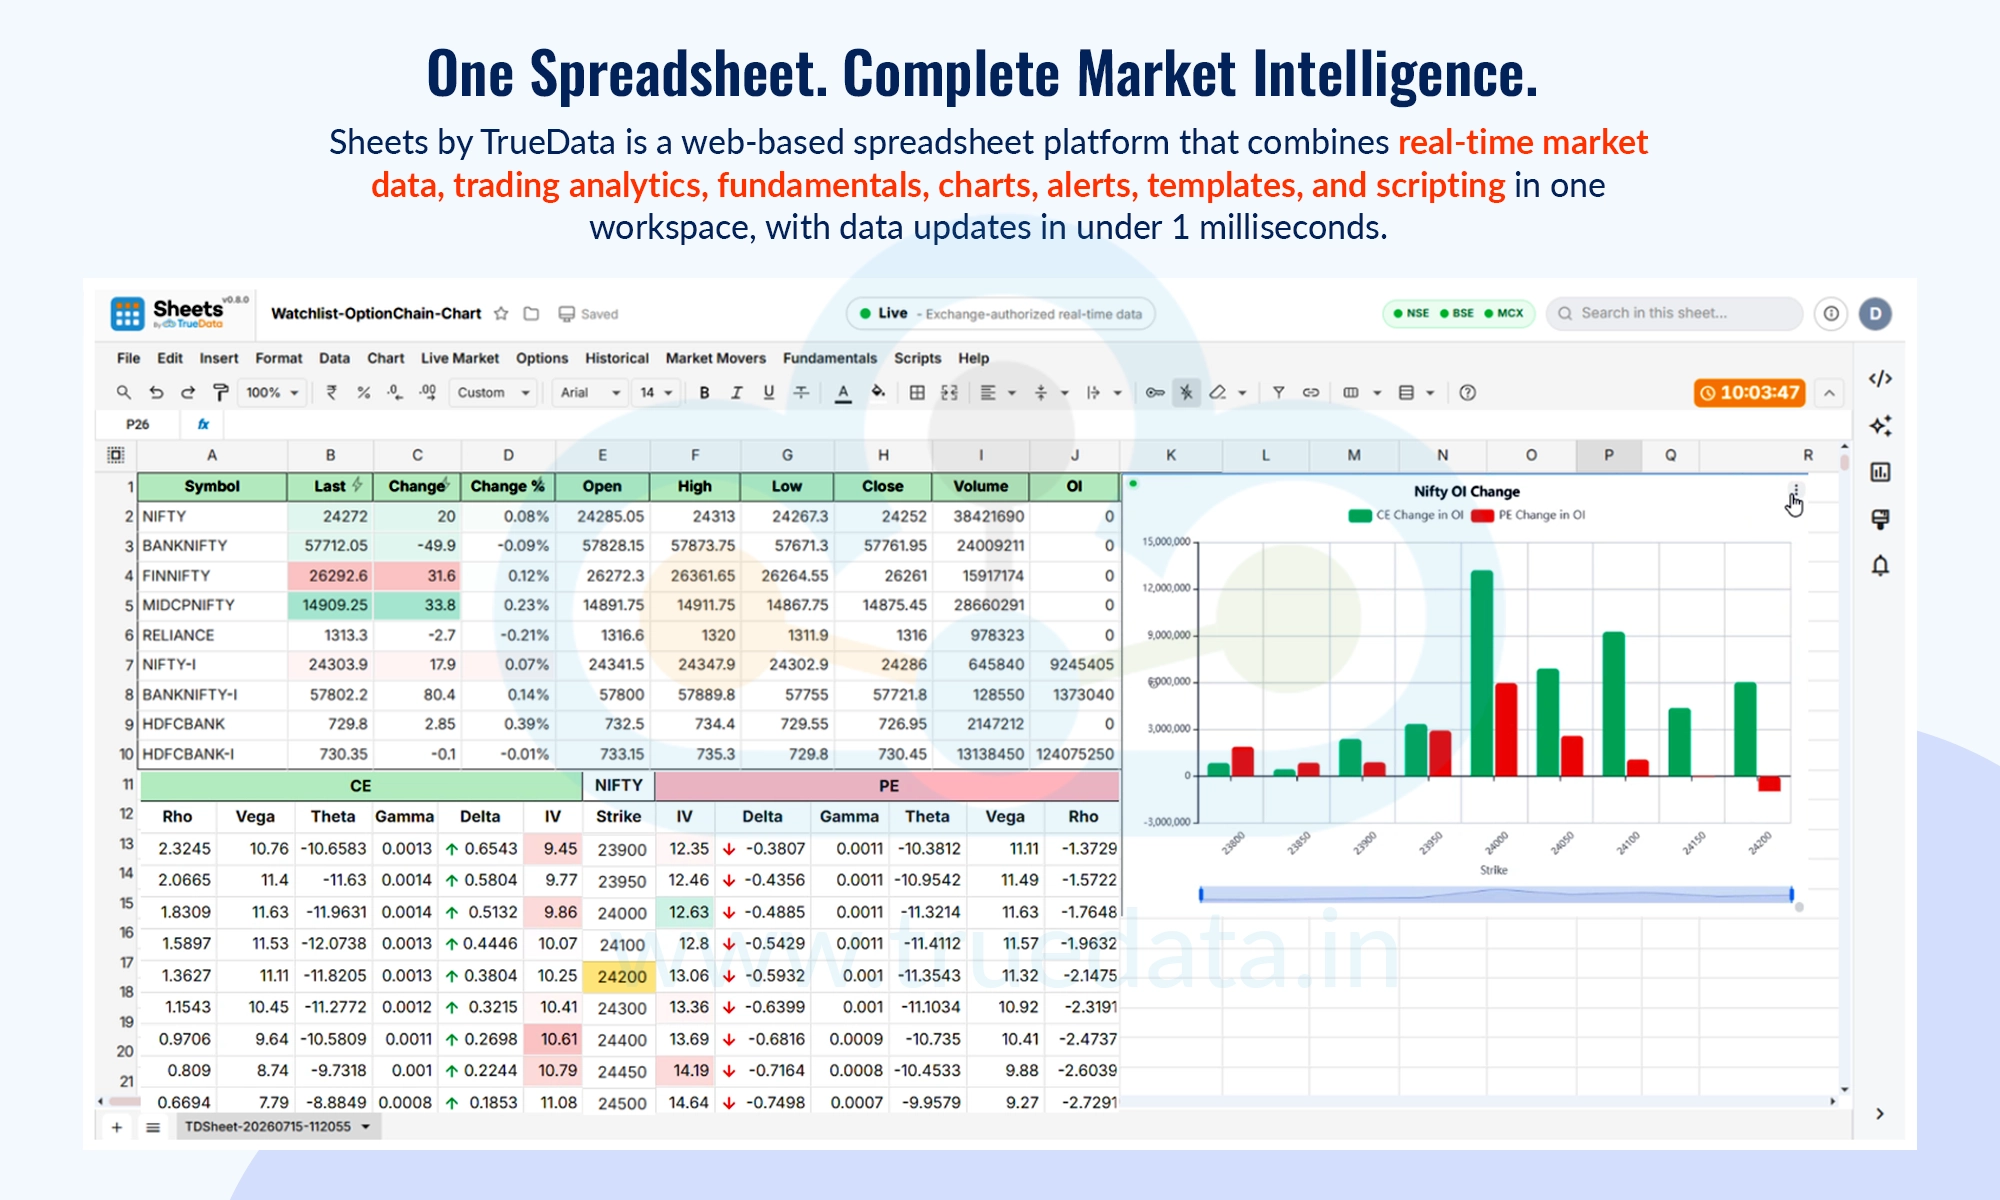
For example, live market formulas can provide ATP, Turnover, Tick Volume (LTQ), Total Volume, Day Open, Day High, Day Low and Previous Close. It also supports live OI tracking and option Greeks such as Delta, Gamma, Theta, Vega and Rho.
This allows traders to build their own calculations and dashboards around the incoming data.
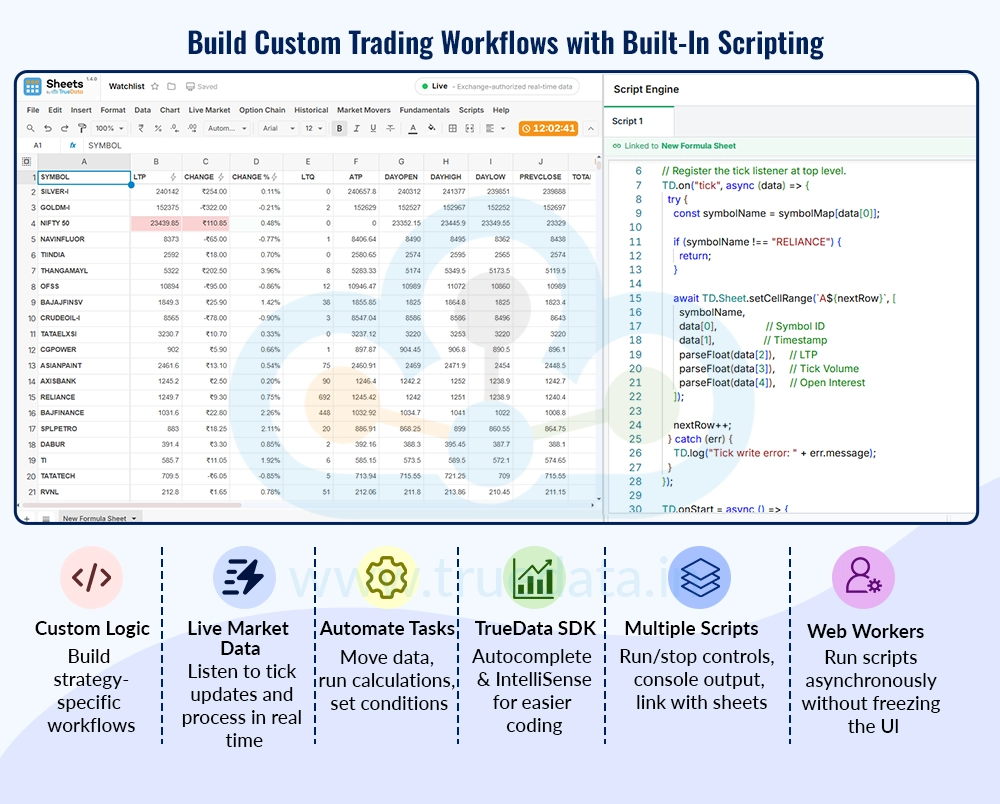
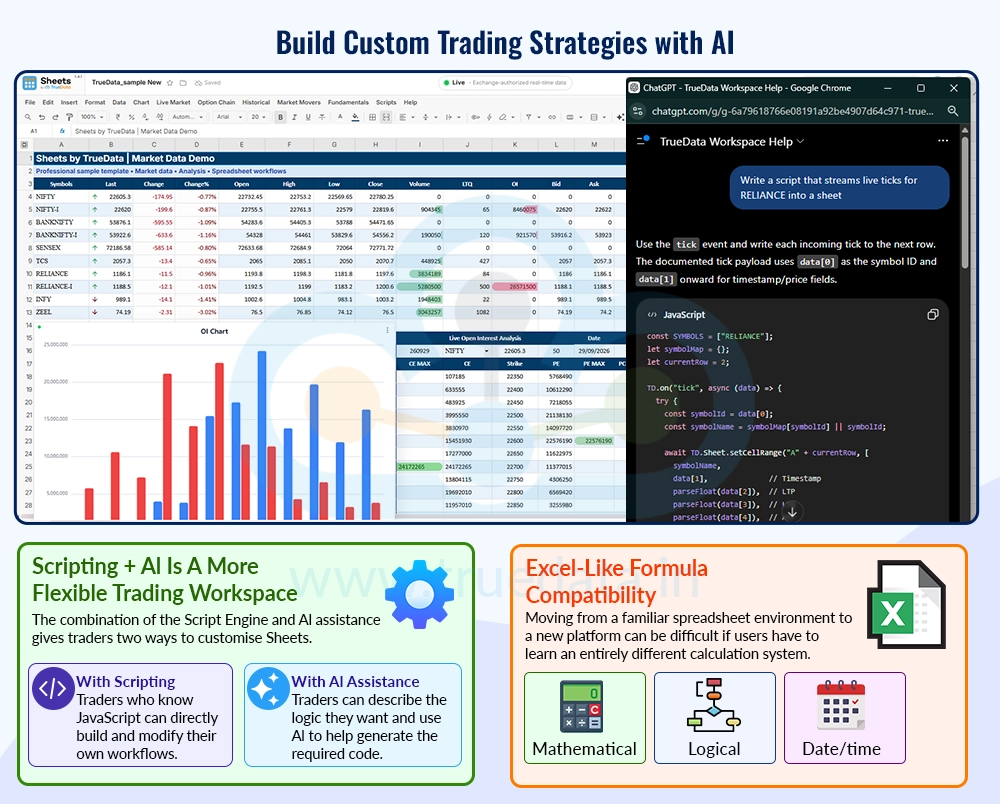
Sheets goes beyond basic spreadsheet functionality with features such as interactive charts, alerts, scripting and market-specific templates. Its built-in scripting engine includes JavaScript support, TrueData SDK autocomplete and IntelliSense, multiple script tabs, script execution controls and console output. This gives technically inclined traders greater flexibility to build customised workflows.

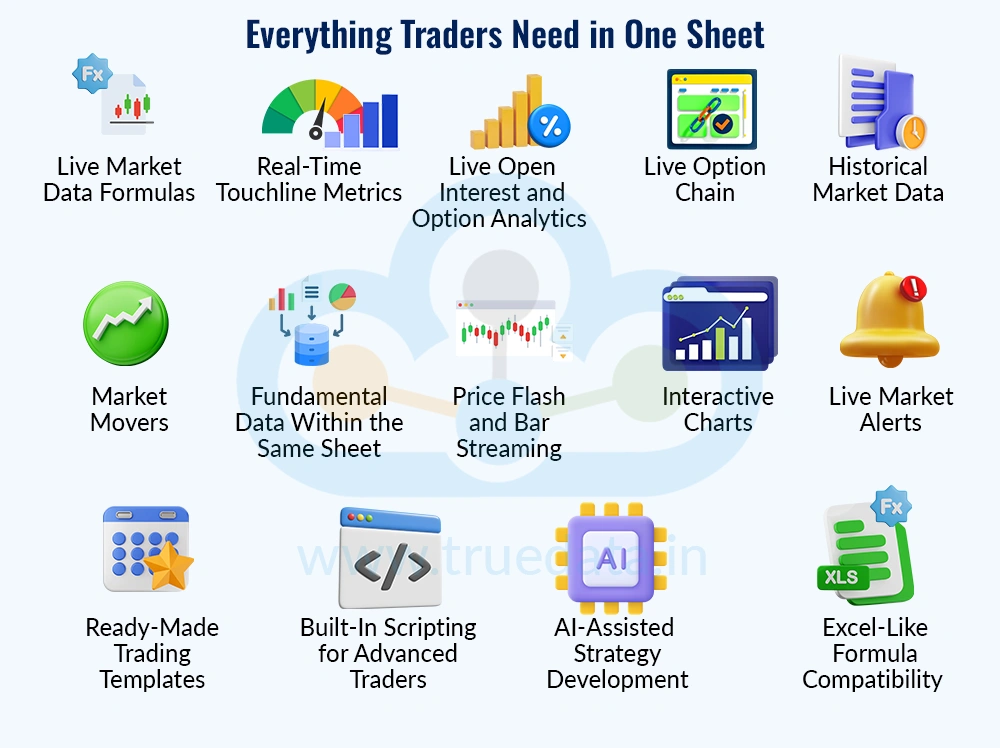
Sheets by TrueData combines several categories of trading and spreadsheet functionality.
Live Market Data Formulas - The platform provides Excel-like formulas for streaming live market data.
Examples include:
=LTP()
=BID()
=ASK()
=BIDQTY()
=ASKQTY()
=CHANGE()
These formulas allow traders to pull live market information directly into spreadsheet cells and can be useful when creating a customised watchlist or monitoring specific trading conditions.
Real-Time Touchline Metrics - Traders can also access live calculations such as,
Average Traded Price (ATP)
Turnover
Total volume
Tick volume (LTQ)
Day open
Day high
Day low
Previous close
These can be incorporated into the trader's own calculations and dashboards.
Live Open Interest and Option Analytics - Options traders can use Sheets to monitor open interest and changes in OI in real time. The platform provides functions for,
Today's OI
Previous OI
OI change
OI change percentage
It also supports Implied Volatility and live Option Greeks. These capabilities can be particularly useful for traders who build option strategies around changes in price, OI and volatility.
Live Option Chain - One of the most useful features for derivatives traders is the ability to generate a live option chain directly inside the spreadsheet. Sheets provides an option-chain function that can automatically generate and populate an option-chain table. It also supports an option-chain-with-Greeks function. This can save traders from manually transferring option-chain information into their own analysis sheets. Traders regularly relying on option-chain analysis can use this opportunity to build a customised workspace around the data they actually monitor.
Historical Market Data - Real-time data is important for live trading, but historical data is equally important for analysis and strategy development. Sheets provides access to historical tick and bar data. Historical ticks can include,
LTP
Tick volume (LTQ)
Open interest
Bid
Ask
Historical bars can provide,
Open
High
Low
Close
Volume
The data can be retrieved based on the selected symbol, timeframe and date range. This allows traders to combine current market conditions with historical price behaviour within their spreadsheet environment.
Market Movers - Traders often want to know not just what is happening to one stock, but where the broader market activity is concentrated. Sheets provides real-time market-mover functions for,
Top gainers
Top losers
OI gainers
OI losers
Index gainers
Index losers
Industry gainers
Industry losers
This can help traders quickly identify areas of unusual price or OI activity without manually screening the market.
Fundamental Data Within the Same Sheet - Although Sheets is designed with traders in mind, it can also support fundamental analysis. The platform provides functions to retrieve the following quarterly and annual data for standalone and consolidated financial statements,
This can be useful for traders who combine fundamental and technical analysis. For example, a trader could maintain a watchlist of companies and bring selected fundamental information into the same spreadsheet used for market monitoring.
Price Flash and Bar Streaming - Sheets also makes live price movements easier to visualise. The Price Flash feature can visually indicate live price movements, with cells flashing when prices move. The Bar Streaming feature allows live OHLC candlestick data to be pulled directly into the spreadsheet, with new candles appearing as each interval closes. This makes the spreadsheet more dynamic and easier to monitor during live market hours.
Interactive Charts - Sheets includes an interactive charting environment that can display charts in floating, resizable windows. It supports multiple chart layouts and chart types, including,
Line charts
Bar charts
Area charts
Scatter plots
Pie charts
Donut charts
The chart editor also allows users to customise chart settings, while live auto-refresh can update chart series as spreadsheet data changes. Thus, traders can move beyond rows and columns and visually analyse the market data they have pulled into the sheet.
Live Market Alerts - Another important feature is the built-in Alert Manager. Traders can create conditional alerts based on,
Price
Volume
Open interest
The system can also maintain alert history and trigger logs, allowing traders to review triggered alerts with timestamps, symbols and values. Notification options include on-site notifications, browser notifications, email, SMS and sound. This can reduce the need for continuous market monitoring.
Ready-Made Trading Templates - Not every trader wants to build a spreadsheet from scratch. Sheets therefore includes ready-made templates for common trading workflows.
One example is the OI Trader Template, which can combine option-chain information with max pain calculations. A trader can select the relevant symbol and expiry and allow the sheet to populate the required information. Weekly and monthly expiry variants can also be used, which also indicate the max pain level for prompt analysis.
At the same time, traders can create and save their own custom templates. This gives users two choices, i.e., start quickly with a ready-made template or build a completely customised trading workspace.
Built-In Scripting for Advanced Traders - For traders who want to go beyond Sheets Formulas, Sheets includes an integrated JavaScript scripting environment. The scripting engine includes:
JavaScript editor
Syntax highlighting
Line numbers
Code completion
TrueData SDK autocomplete
Multiple script tabs
Run/stop controls
Console output
Sheet-script linking
Background Web Worker execution
This can be particularly useful for traders who want to create more advanced calculations, automate parts of their workflow or experiment with customised strategies.
AI-Assisted Strategy Development - One of the more advanced capabilities highlighted in the product information is the integration of ChatGPT within the Sheets environment. This can help users generate scripts and customise workflows using natural-language prompts rather than writing every line of JavaScript manually. For traders who understand the strategy they want to build but may not be comfortable with programming, this can reduce the technical barrier to experimentation. In other words, the trader can focus more on what they want the strategy or analysis to do, while AI can assist with the coding required to implement it.
Excel-Like Formula Compatibility - Moving from a familiar spreadsheet environment to a new platform can be difficult if users have to learn an entirely different calculation system. Sheets addresses this by supporting more than 200 standard spreadsheet functions covering areas such as mathematical, logical, text, date/time, lookup and financial calculations. This makes the platform more familiar for traders who already use spreadsheets extensively. It also includes an in-app formula reference guide containing arguments, examples and notes.

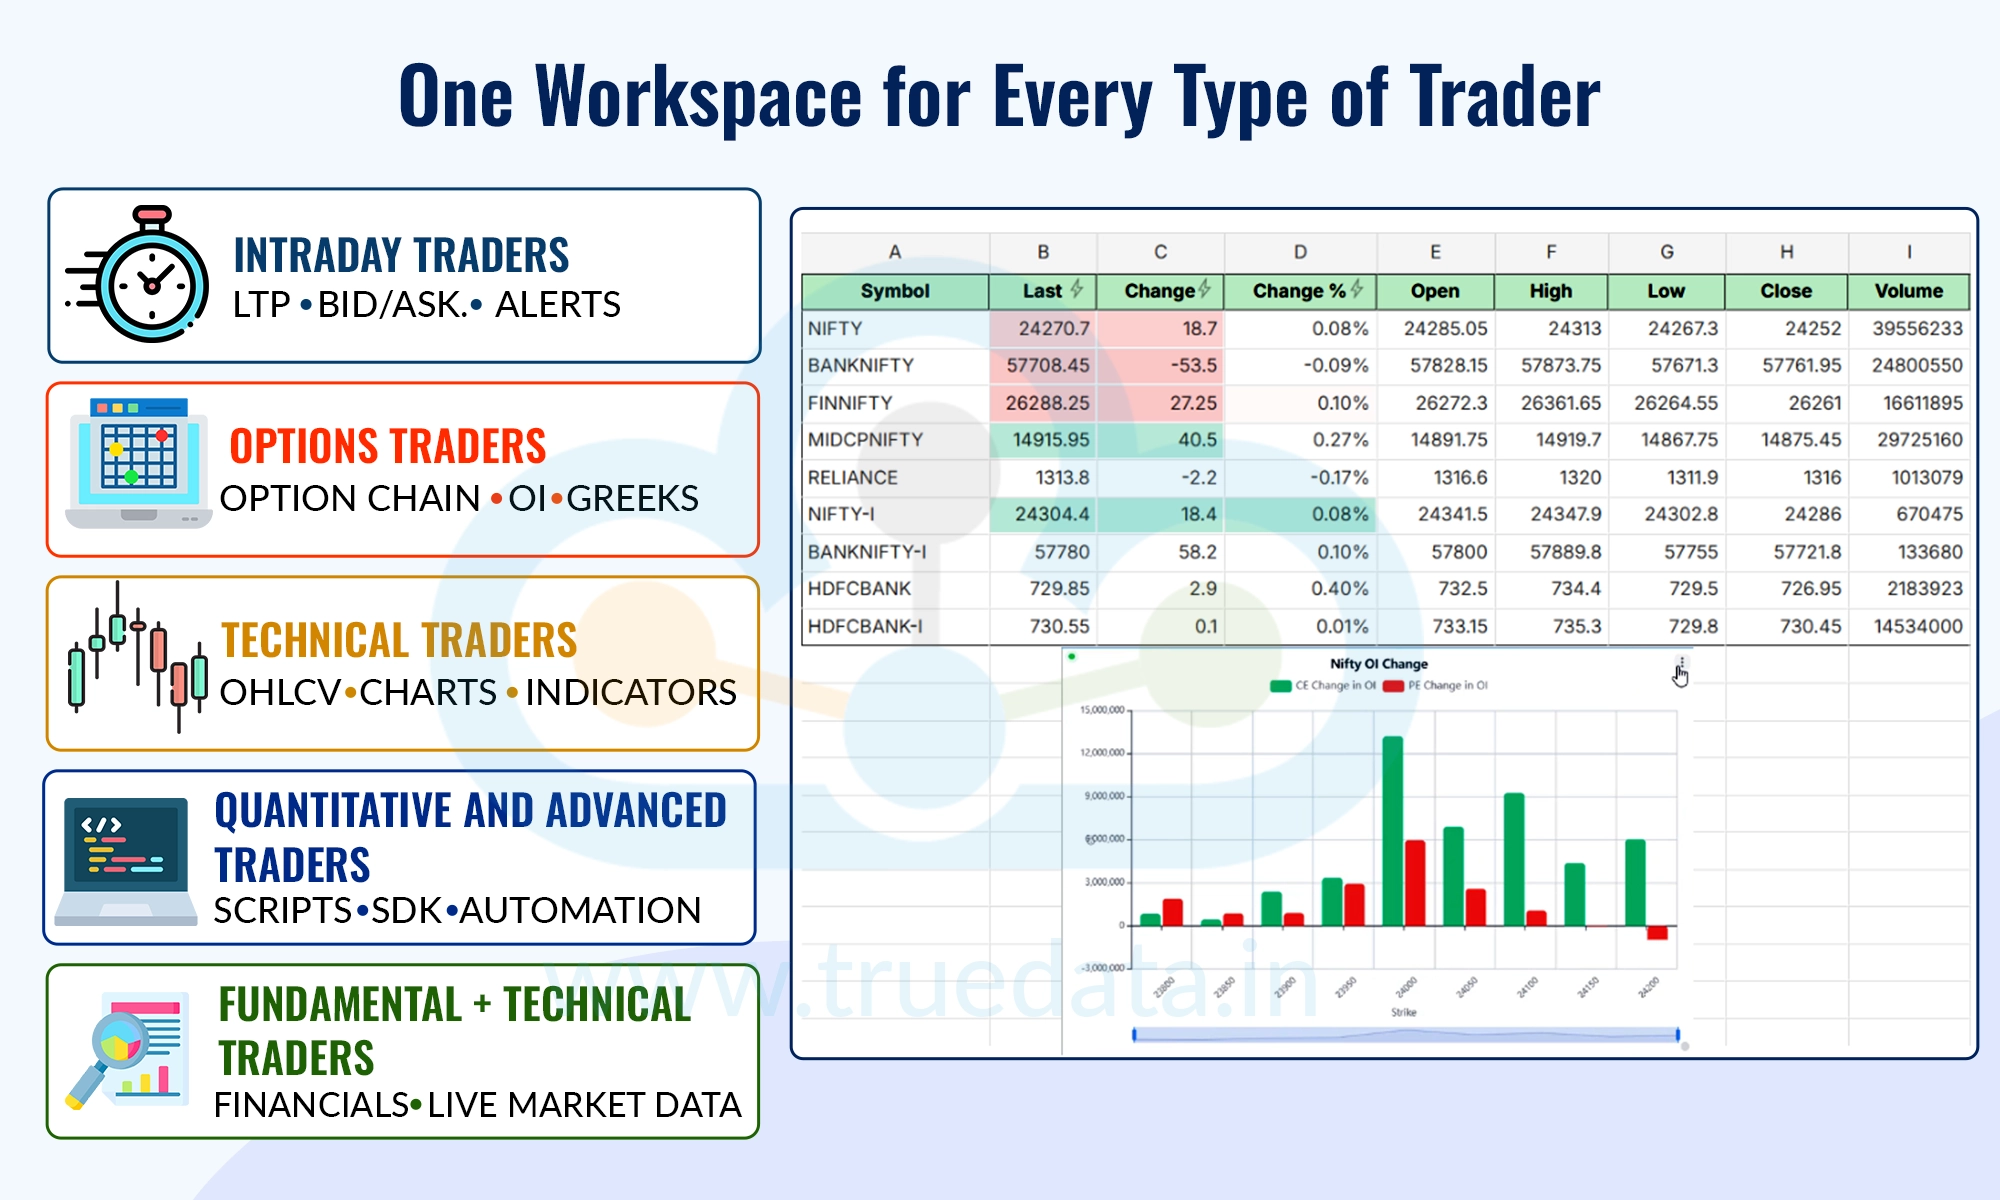
Sheets by TrueData is a versatile product and can be useful for all types of traders, as the biggest advantage of a platform like Sheets is flexibility.
Different traders follow different strategies. Some monitor only a handful of stocks, while others track hundreds of instruments. Some rely heavily on options data, while others focus on price and volume. Some traders want ready-made templates, while advanced users may want to build their own scripts. A single fixed dashboard cannot accommodate all these workflows equally well. Sheets allows traders to build their workspace according to their requirements.
The platform combines multiple features in a single environment.
Speed → Data → Analysis → Customisation → Automation
For Intraday Traders - Intraday traders can use live LTP, bid-ask data, volume, turnover, price changes and alerts to monitor the market in real time. A customised sheet can be built around the specific stocks or indices being traded.
For Options Traders - Options traders can combine live option chains, OI, OI changes, Greeks and historical data. An OI-based template can further simplify workflows involving option-chain analysis and max pain.
For Technical Traders - Technical traders can combine live market data with historical OHLCV data, charts and spreadsheet calculations. This can help them create customised monitoring systems based on their preferred indicators or conditions.
For Quantitative and Advanced Traders - Traders with programming knowledge can use the scripting engine and TrueData SDK capabilities to build more sophisticated workflows. The ability to run scripts in Web Workers is also designed to prevent heavy quantitative computations from freezing the user interface.
For Fundamental + Technical Traders - Traders who combine company fundamentals with market data can access P&L, balance sheet and cash-flow information alongside live market information.

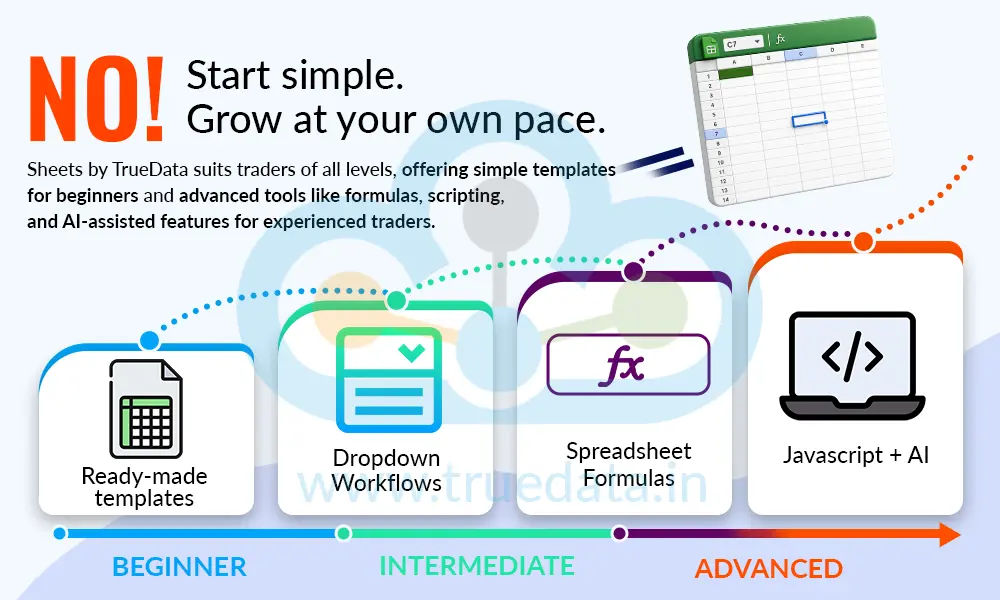
The answer is No! While advanced features such as JavaScript scripting and AI-assisted coding can appeal to experienced or quantitative traders, the basic spreadsheet and market-data functionality can also be useful for traders who simply want a more organised way to monitor the market. Users can start with ready-made templates and dropdown-based workflows before moving into formulas and scripting as they become more comfortable.

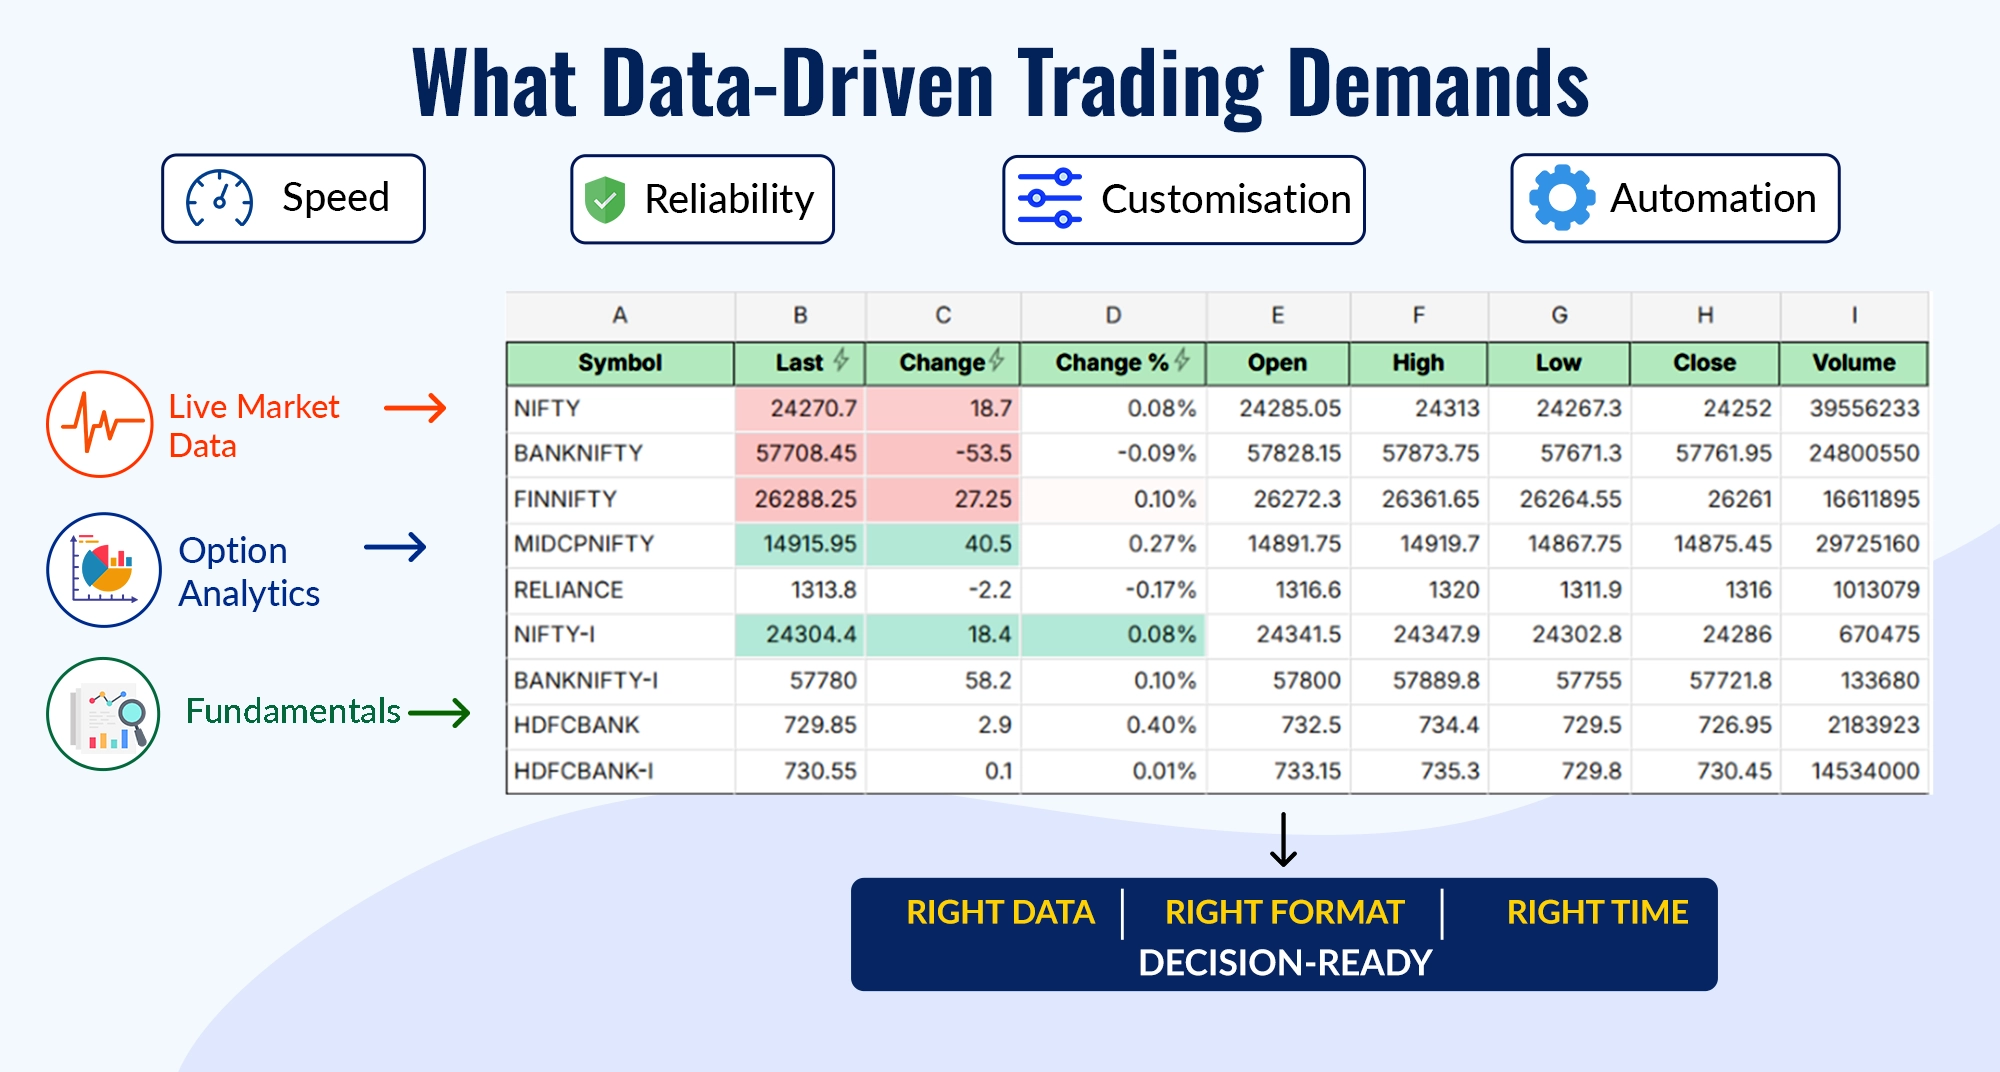
Markets generate enormous amounts of information every trading day. The challenge for traders is not simply finding data; it is processing the right information quickly enough and presenting it in a form that supports their decision-making process. This makes speed, reliability, customisation and automation increasingly important.
Sheets by TrueData brings these requirements together by combining a spreadsheet environment with live market data, historical data, options analytics, fundamentals, charts, alerts, templates and scripting.
Its under-50-millisecond live-data capability, combined with customisable spreadsheet workflows, is designed to address one of the biggest challenges faced by active traders, i.e., getting the right market information into the right format at the right time.

Sheets by TrueData is designed to change the way traders work with market data. Rather than simply providing another place to view prices, it brings together live market data and the flexibility of a spreadsheet with advanced trading-specific features. The result is a platform where traders can access data, customise it, analyse it and build workflows around it.
For traders who have struggled with delayed updates, repeated plugin restarts, rigid data formats or the need to move between multiple tools, Sheets offers a more integrated approach.
Most importantly, it gives traders the flexibility to decide how they want their market data to look and how they want to use it. Because in trading, having market data is only the beginning. The real advantage comes from how quickly and effectively you can turn that data into meaningful analysis.
Start your market journey with our dynamic product Sheets by TrueData, and check out our Help page if you need any assistance navigating through it.
Happy Investing and Trading!
In the world of high-speed trading, success often hinges on capitalising on even...
The world of trading is constantly evolving with the use of advanced technology ...
Introduction Real-time market data from NSE, BSE, and MCX is distributed as 4 d...