SignalX gives you real-time market intelligence — from price action to volume surges and
hidden momentum — so you can act faster, smarter, and with confidence.
Symbols Tracked
Uptime
Latency
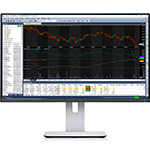
Signalx, DOM, Volume Profile. All in one lightning-fast workspace.
Best-in-class charting equipped with Volume Profiles, Market Profile, and an extensive suite of technical indicators.
Relive any market symbol with precision and reliability even after the markets are closed.
Create and visualize straddle charts or your own custom formulas with a combination of symbols.
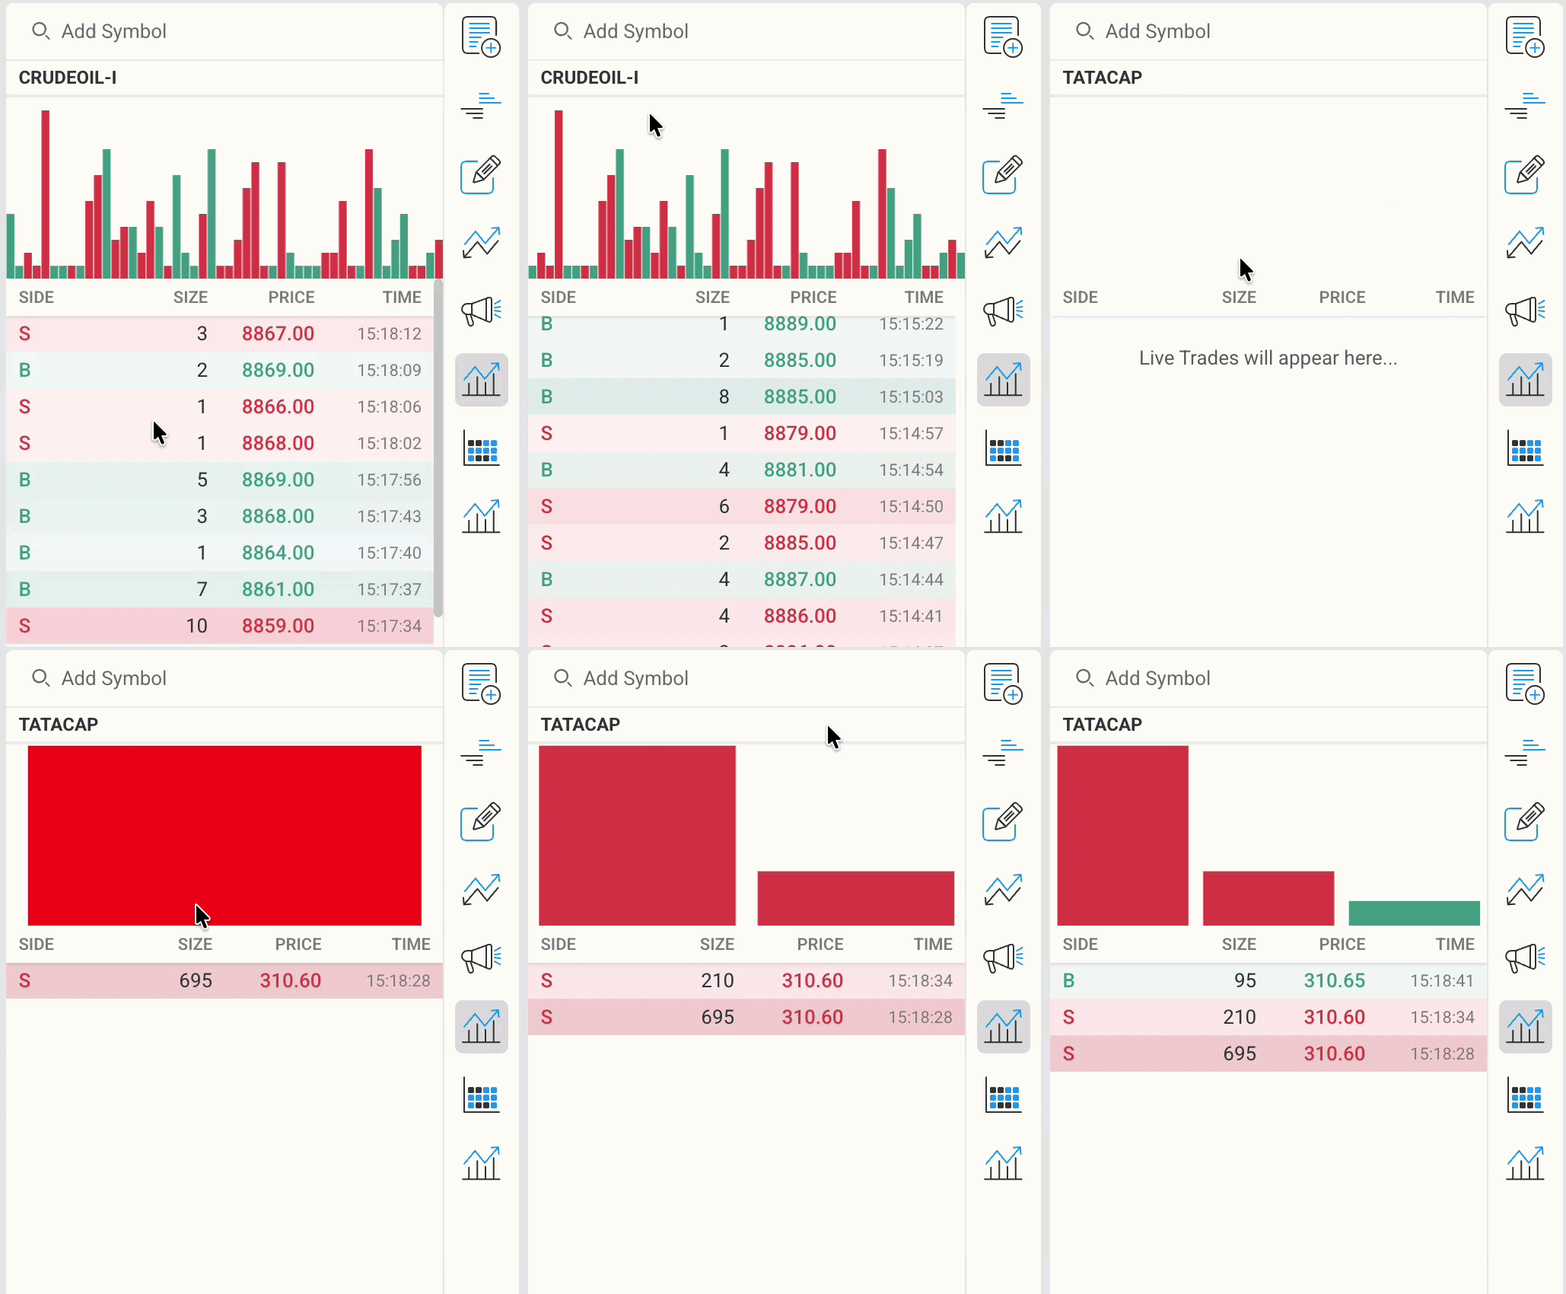
Get the most accurate time and sales data with tick precision and real-time updates.
Access live streaming quotes with less than 50ms latency for split-second decisions.
Deep market analysis powered by advanced price action tools, momentum tracking, and historical trend data.
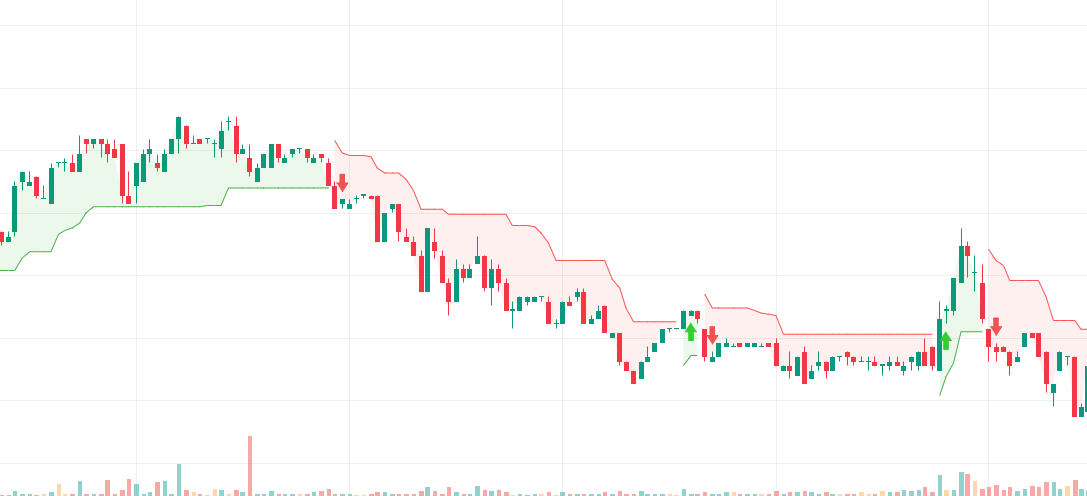
Unlock deeper market insights with Signalx Charts. Visualize critical price structures, support/resistance zones, and trend shifts to anticipate market moves and trade with absolute confidence.
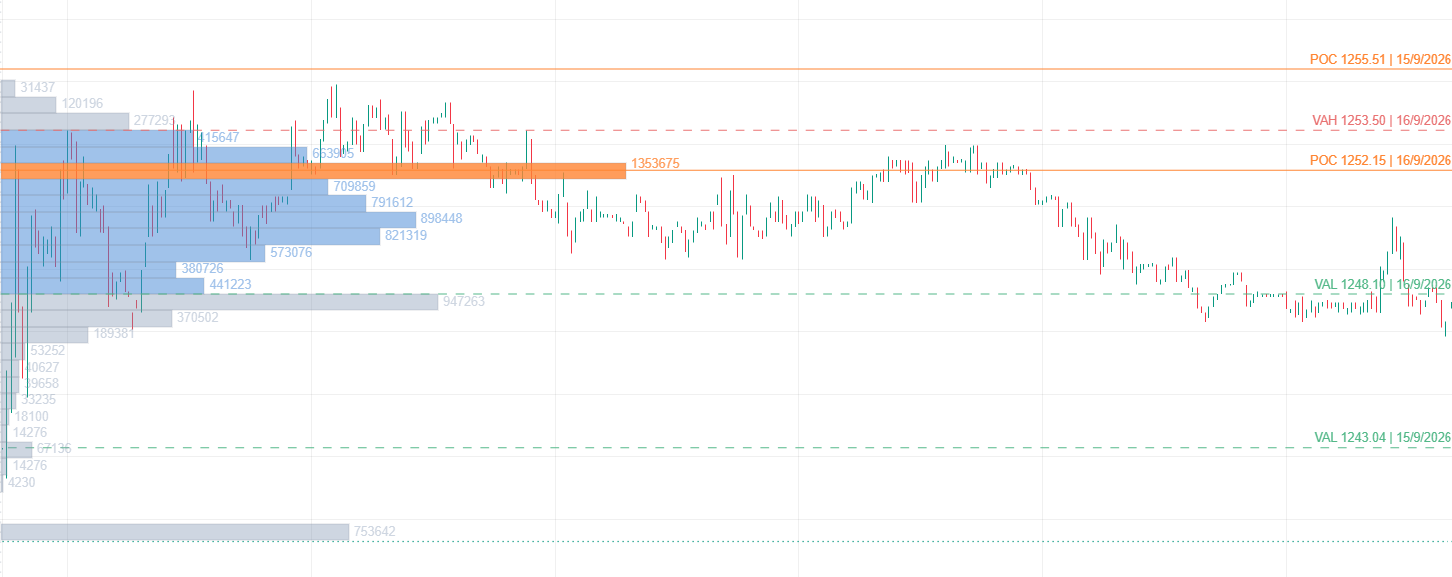
Analyze traded volume at each price level to identify high-activity zones, support/resistance levels and value areas for precise market entries.
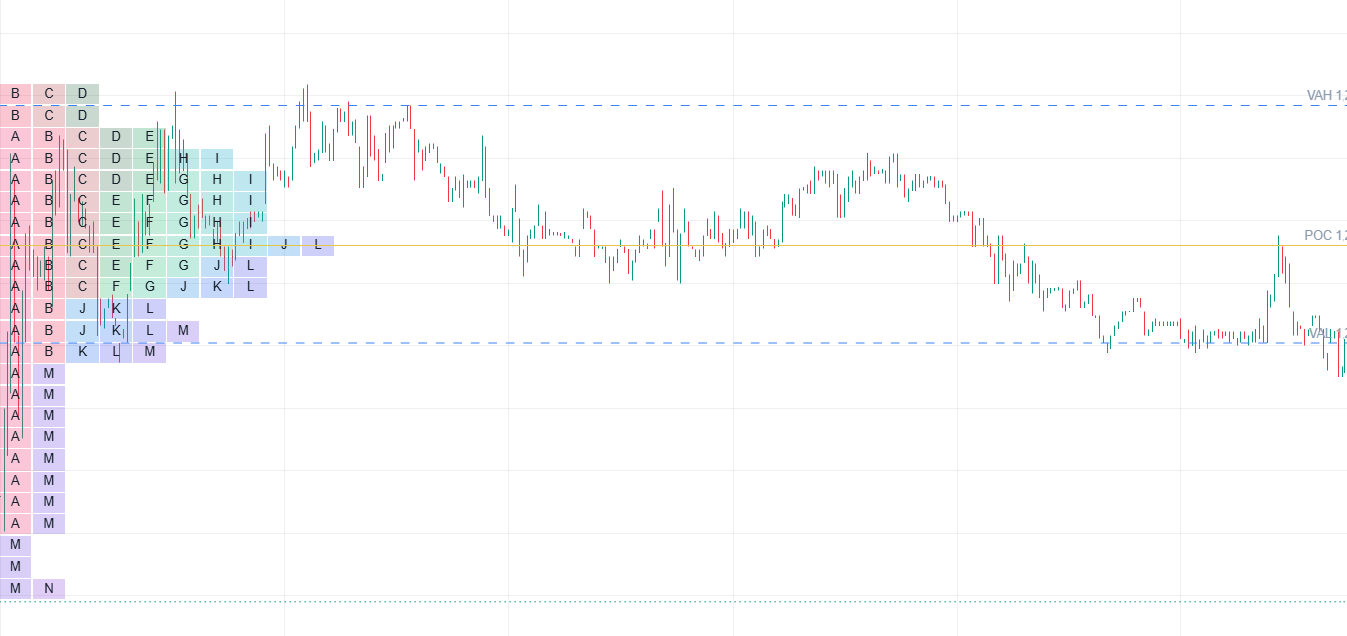
Visualize market structure with TPO Market Profile, revealing value areas, price acceptance, and key support/resistance zones for smarter intraday trading decisions.
From lightning-fast index options to volatile commodity futures—trade with institutional tick-by-tick depth across India's leading exchanges.
Comprehensive market depth and precision tracking for benchmark indices and high-beta equities. Monitor real-time price action and market momentum with unmatched clarity.
Uncover institutional order blocks and liquidity pools across Sensex derivatives and broad cash equities. Never trade against big market rotations.
Trade fast-paced global commodity shifts with real-time volume profiles and delta tracking on Crude Oil, Natural Gas, Precious Metals & Currency pairs.
Audited P&L, Balance Sheet & Cash Flow ratios.
Live OI buildup, Max Pain & PCR shift analytics.
Instant audio & popup breakout triggers.
Automated indicator condition alerts.
Custom multi-screen detachable layouts.
Download tick histories to CSV & Excel.
Everything you need to spot institutional geometry, replay market sessions, and execute systematic edge—all built natively into your charts.
Map complex market structure in seconds with automated pattern scanners and high-precision geometric projection tools.
Relive any historical market session bar-by-bar or tick-by-tick. Test setups outside market hours without risking real capital.
Eliminate chop and sideways consolidation with specialized price-driven bar types designed for crystal-clear trend definitions.
Combine momentum, volatility, volume delta, and custom scripts on a single canvas with multi-timeframe overlays and zero lag.

Track and organize your favorite market instruments with a powerful and customizable watchlist.

Track real-time option data with a powerful and easy-to-read option chain interface.

Create, analyze, and optimize option strategies in real-time with powerful visual tools and insights.

Real-time tracking of top gainers and losers across different segments, timeframes, and market capitalization.

Never miss important Reg.30 disclosures, results, press releases & price impact.

Monitor live market trades with detailed Time & Sales data to understand real-time buying and selling activity.

Interactive heatmaps showing sector and stock performance, volume activity, and market sentiment in real-time.

Powerful analytics tools to track OI movements, price action, and market positioning in real-time.

Personalize your trading experience with flexible layouts, theme modes, and powerful workspace controls.
Connect your broker account in seconds and start trading with real-time data
"Signalx transformed my trading. The orderflow Signalx charts give me insights I never had before. Best platform for serious traders."
"Finally, a platform that understands professional traders. Real-time data, zero lag, and perfect execution."
"Best charting platform I've used. The drawing tools and XABCD patterns are incredibly accurate."
"The heatmap and option chain are powerful. I can see the whole market at a glance. Highly recommended!"
-->
Start analyzing the markets today.