
Do you know, only about 3% of India’s population is actively invested in stock markets? Furthermore, it is estimated that only about half a million people in India are involved in day trading. Day trading is the art of fine-tuning the trading possibilities from the infinite buzz in the stock markets. While traders use many strategies and indicators to wade their way through the ocean of opportunities, here in this article, we will focus on the use of order flow and imbalance charts in day trading. Read on to learn more about order flow and imbalance charts and how to use them in day trading.
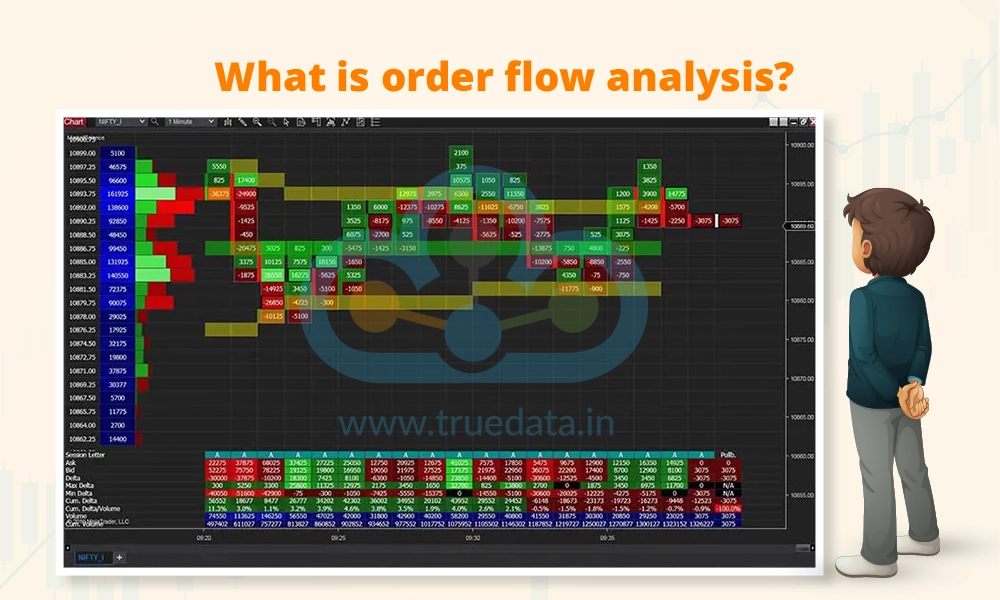
Order flow analysis is a trading strategy that involves studying the volume and direction of buy and sell orders in the market to make informed trading decisions. Traders use this approach to gauge market sentiment by tracking metrics such as order size, frequency, and timing. The study of these patterns can help traders anticipate the potential price movements and take positions accordingly. The advancement in trading platforms has enabled traders to use specialised tools and software to access real-time order flow data, which complements technical analysis and market insights. However, it is important for traders to note that order flow analysis is best used alongside other trading techniques and accounting for additional factors like market news, economic indicators, and risk management practices.
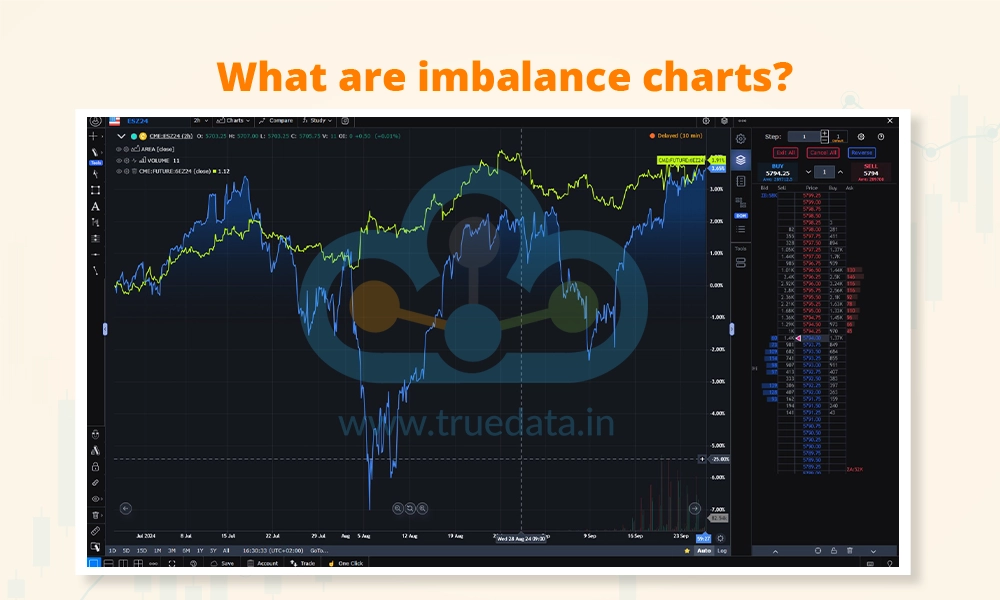
Imbalance charts are visual representations used by traders to assess the difference between buy and sell orders at various price levels. This allows traders to understand the market sentiment and potential price shifts of the target stocks or securities. These charts highlight imbalances where buy or sell orders significantly outnumber the other, indicating bullish or bearish trends. Traders utilise imbalance charts to pinpoint support and resistance levels and potential market reversals. Traders use the imbalance charts by integrating them with other technical tools like volume profiles and order flow analysis for a more comprehensive trading strategy in a dynamic market landscape like the Indian stock markets.
The use of order flow charts and imbalance charts in day trading can be explained hereunder.
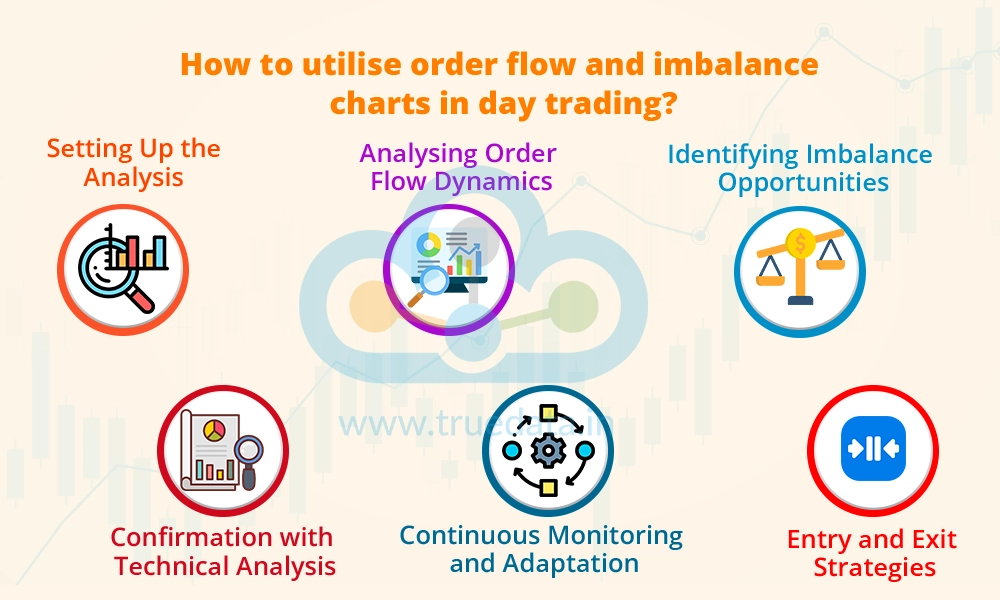
Day trading with order flow charts and imbalance charts requires a structured approach, starting with setting up the necessary tools. Traders can use specialised trading platforms or software that offer order flow data and imbalance chart features. These tools typically provide real-time updates on buy and sell orders, order sizes, and order flow imbalances at different price levels.
Once the tools are set up, traders can begin analysing order flow dynamics. This involves monitoring the volume and direction of buy and sell orders as well as the timing of these orders. Traders can focus on specific metrics such as order size, order frequency, and order book depth to gauge market sentiment and potential price movements.
Imbalance charts play a crucial role in identifying trading opportunities. Traders can use these charts to pinpoint areas of significant imbalance, where buy or sell orders dominate at particular price levels. For example, a notable imbalance favouring buy orders at a key support level could signal a potential bullish reversal, providing an opportunity for traders to enter long positions.
To enhance trading decisions, traders can confirm order flow and imbalance chart signals with technical analysis. This may include using indicators like moving averages, support and resistance levels, and trend lines to validate potential trade setups. For instance, if an imbalance chart shows a strong buy imbalance near a confluence of support levels and a bullish candlestick pattern forms, it adds further confirmation to a long trade opportunity.
Trading based on order flow and imbalance charts requires having clear entry and exit strategies. Traders can enter positions based on confirmed signals from order flow analysis and imbalance charts, considering factors such as risk-reward ratios and stop-loss levels. Additionally, setting profit targets based on technical analysis levels or trailing stops can help maximise profitability while managing risk.
Day trading with order flow and imbalance charts requires continuous monitoring and adaptation to changing market conditions. Traders should stay updated with real-time order flow data, news events, and market trends to make informed trading decisions. Regularly reviewing trading strategies, analysing trade outcomes, and adjusting approaches based on feedback and market feedback is essential for long-term success in day trading using order flow and imbalance charts.
Order flow analysis and imbalance charts are tools used by traders across the world for day trading. However, they are not free from their set of limitations. Some of the limitations that traders need to be aware of while using the order flow analysis and imbalance charts in day trading are mentioned below.
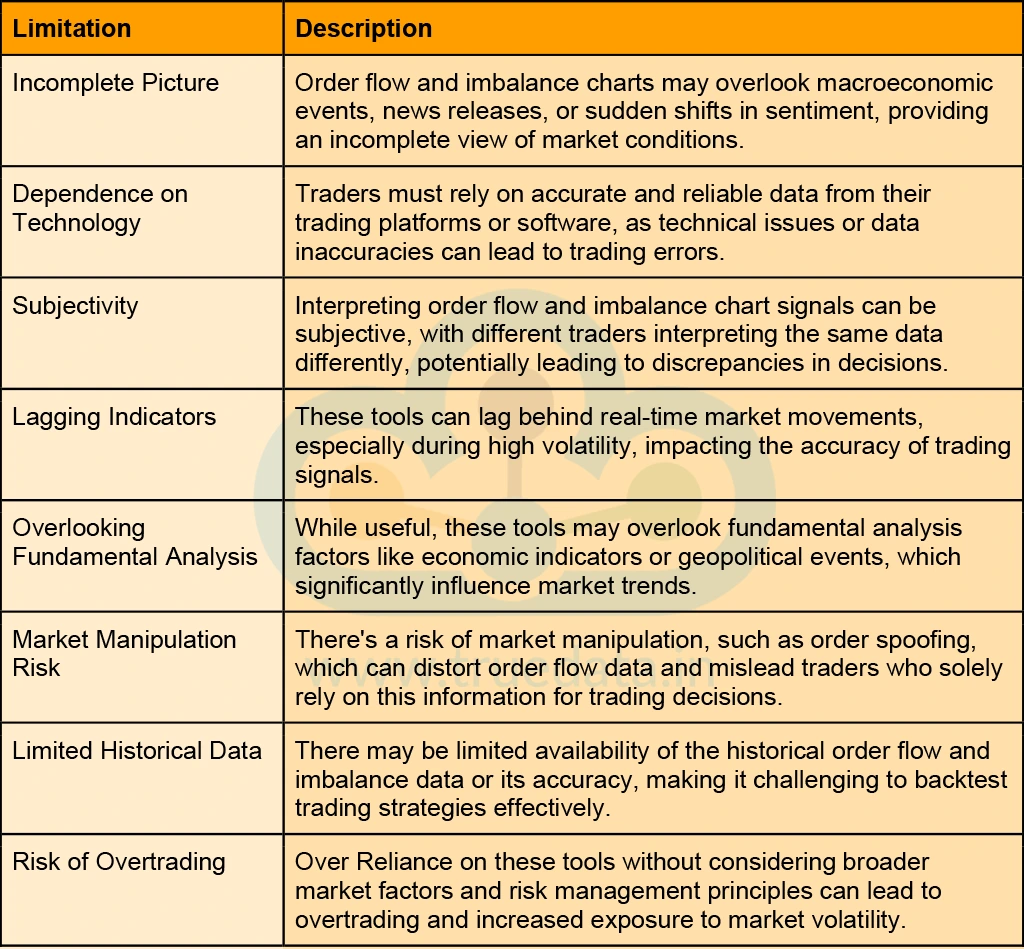
Order flow and imbalance charts are important tools for understanding overall market sentiment and gauging potential trading signals. However, using them in isolation can lead to misinterpretation of the available data, leading to inaccurate trading positions. Therefore, it is important for traders to have a better understanding of these concepts and use them in correlation with other trading indicators.
This blog talks about order flow analysis and imbalance charts, and their use in day trading. We have earlier discussed the use and importance of Cumulative Volume-Delta (CVD) and Volume Delta (VD) in our earlier blog. We request that you please refer to that blog and read it in conjunction with this piece for better understanding. Let us know if you need further information about this topic or any other trading indicators or chart patterns, and we will take them up in our upcoming blogs.
Till then, Happy Reading!
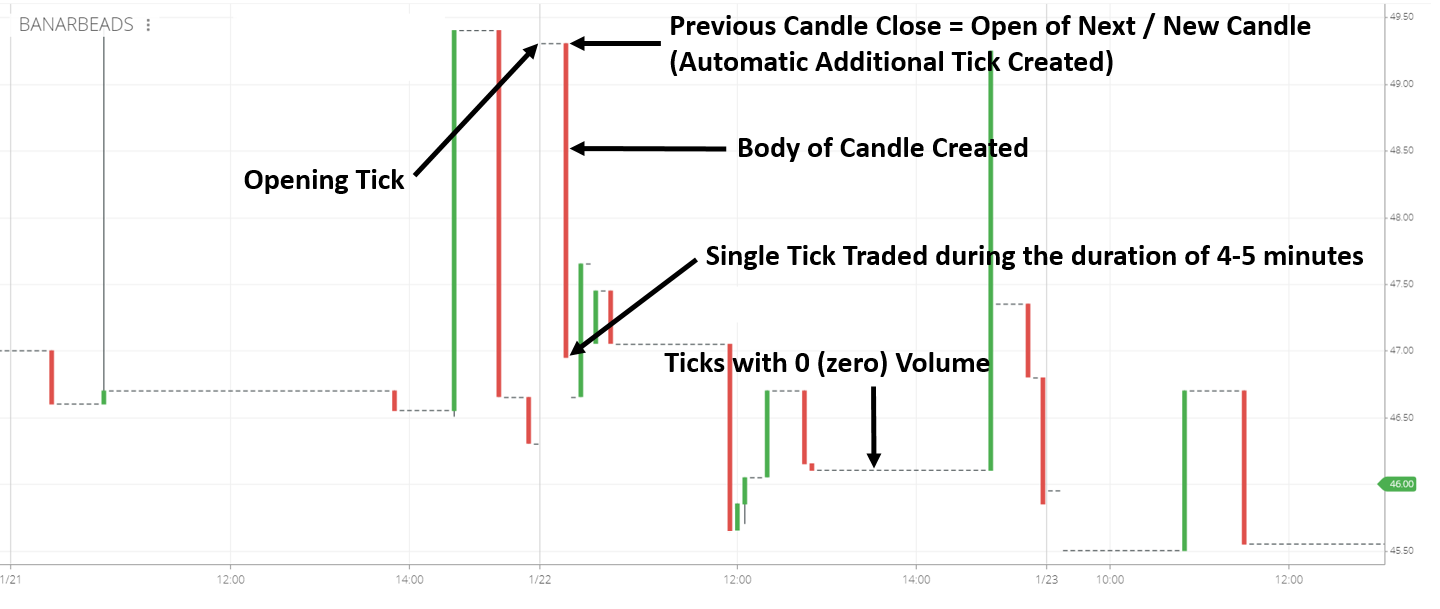
Stock Charts: Beautiful Charts vs Accurate Charts (Stock charts: Based on the n...
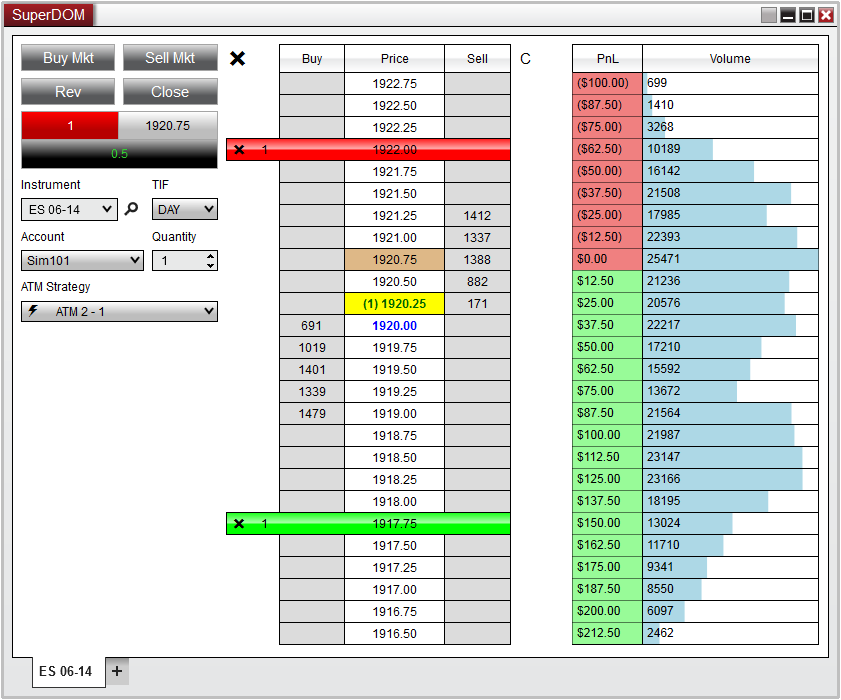
Introduction Real Time Data from NSE, BSE & MCX is distributed to various d...
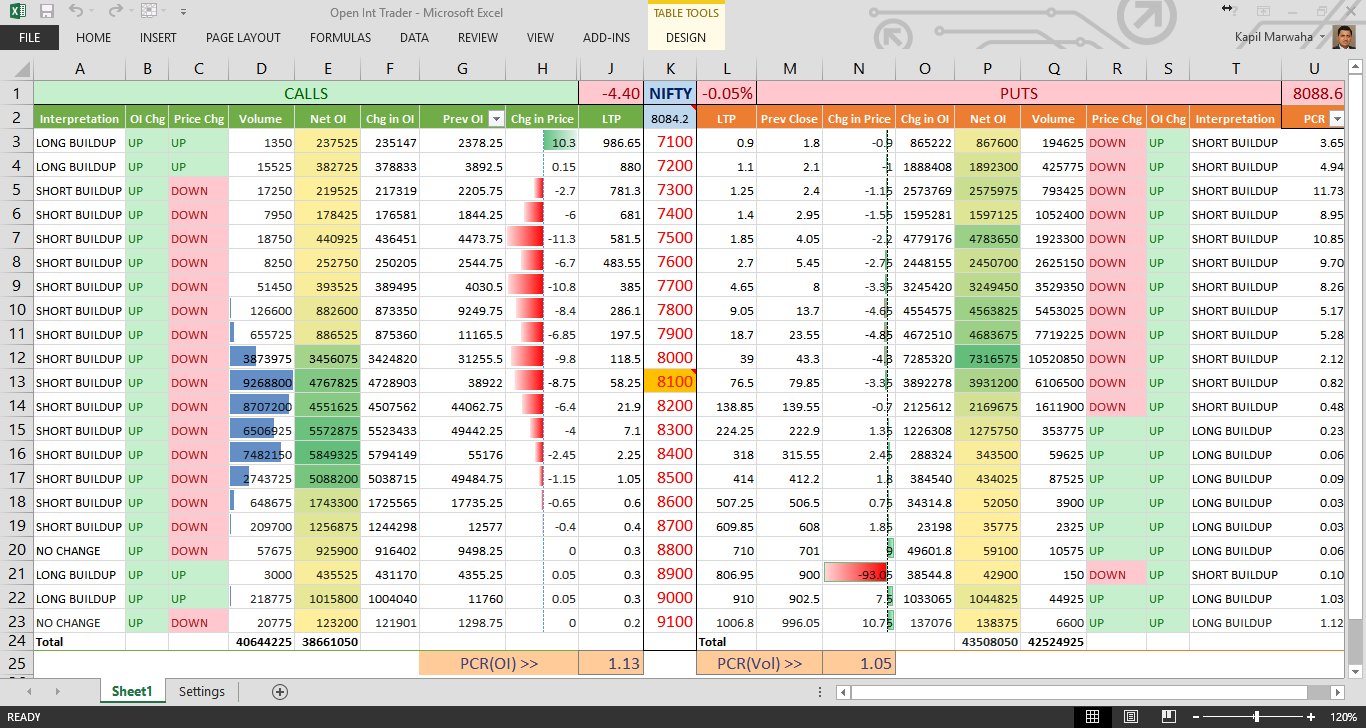
NSE Stock Prices in Excel in Real Time - Microsoft Excel is a super software cap...