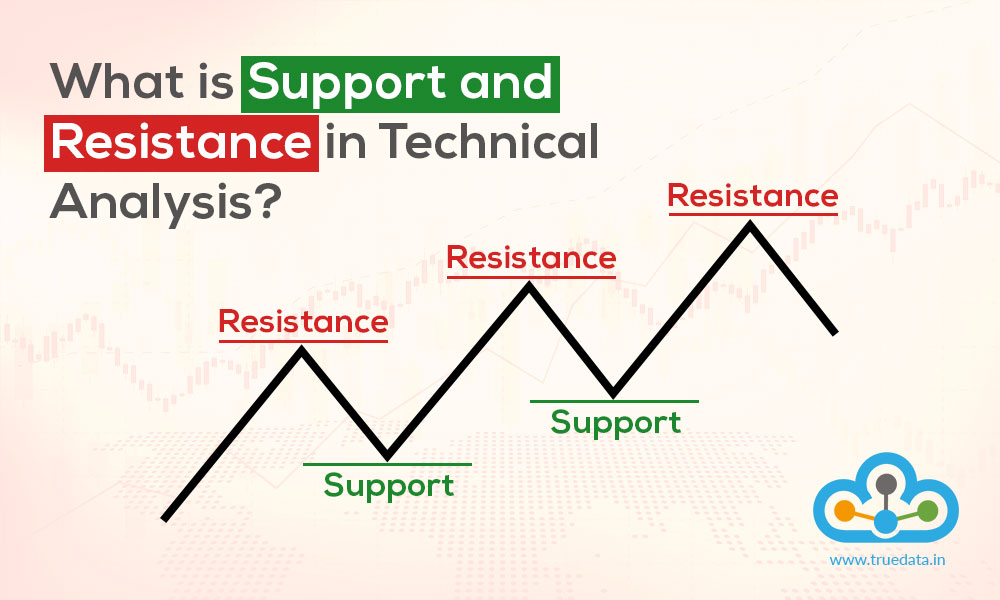
Technical analysis can seem quite complex to understand, especially for novice traders. However, through a correct understanding of its concepts, it can prove to be quite an easy interpretation and analysis of the price and volume movements of the asset. As a trader, you would have heard the terms support and resistance quite often. But do you still need a simplified understanding of these concepts? Then you have come to the right place. Check out this blog to know the basics of the terms support and resistance and its related concepts.
Read More: What is an Iron Condor Strategy?
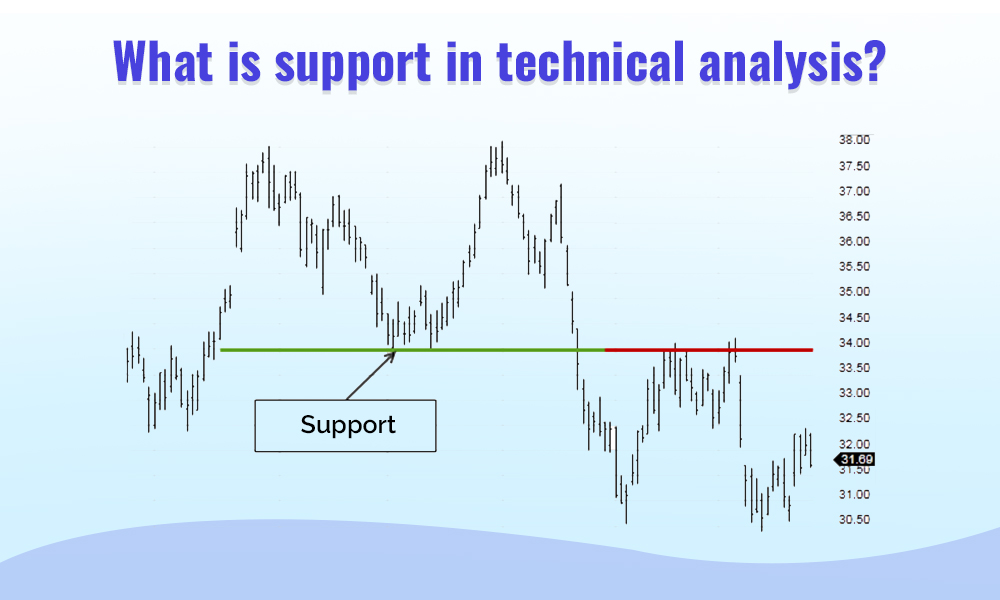
Support in technical analysis refers to a key concept that is crucial for traders playing a vital role in their decision-making process. Support represents a specific price level at which a particular security or market has historically demonstrated a tendency to stop falling and, instead, bounce back upwards. This level is seen as a psychological or historical point where buyers are anticipated to be more active, preventing the price from declining further.
Traders closely monitor support levels to identify potential entry points for buying, as they believe that securities are more likely to experience a positive price movement after reaching a support level. Understanding and correctly identifying support levels can help traders set strategic entry and exit points, manage risk, and make informed decisions in the dynamic and ever-changing financial markets.
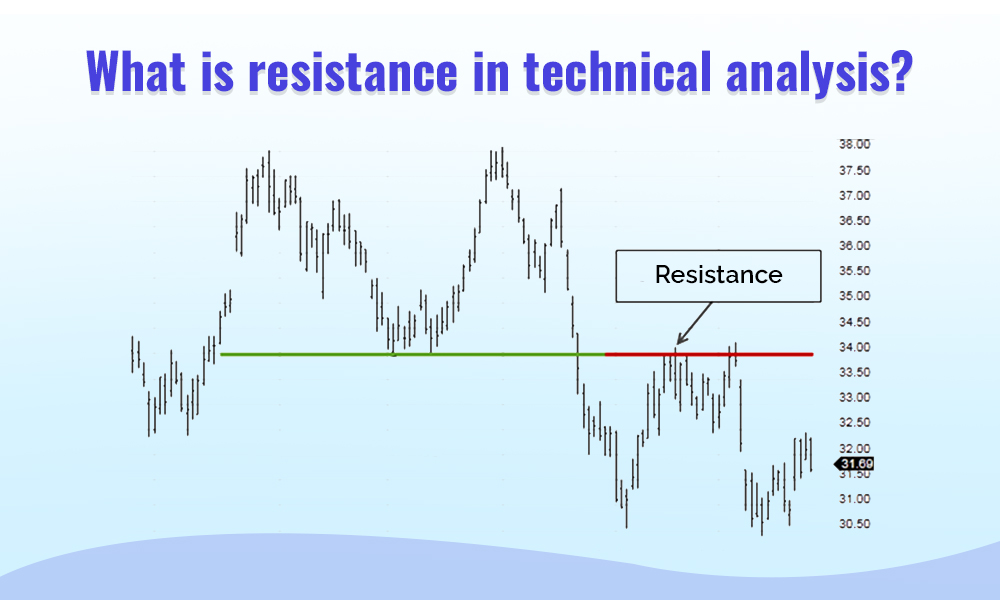
Similar to the concept of support, resistance also is a critical concept in technical analysis for traders and plays a pivotal role in shaping their trading strategies. Resistance signifies a specific price level at which a particular security or market has historically encountered selling pressure thereby preventing the price from rising further. This level is considered a psychological or historical point where sellers tend to be more active, creating a barrier that the price struggles to surpass.
Recognizing and analysing resistance levels is essential for traders to make informed decisions as breaking through these levels could indicate a potential upward trend. Traders closely monitor resistance levels to identify potential selling points and assess the likelihood of a price reversal. Effectively understanding and navigating resistance levels can empower traders to make strategic decisions, manage risk, and navigate the complexities of the financial markets with greater confidence.
Read More: Trade with Real-Time & Historical Stock Data Plugin
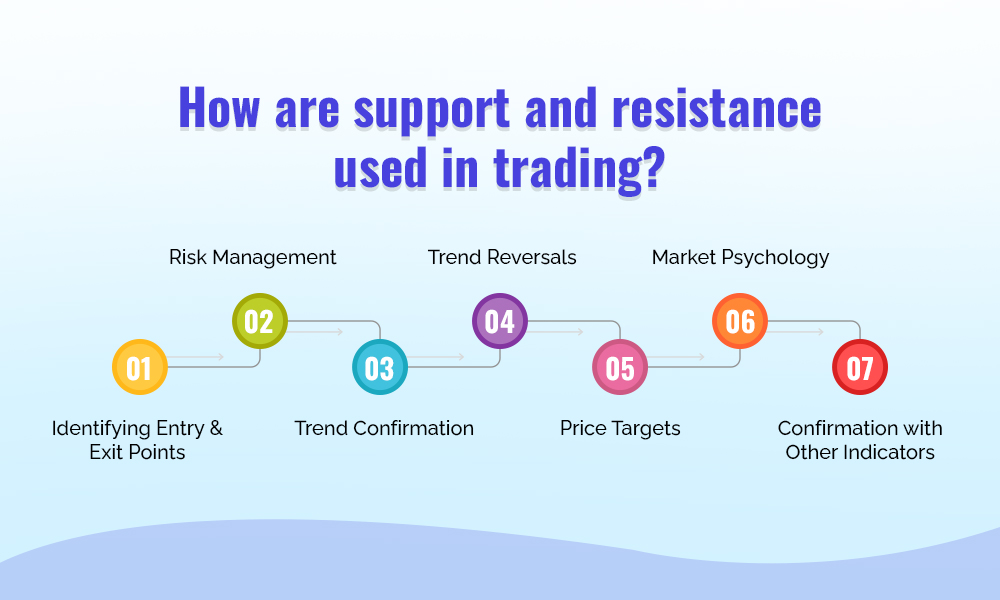
The use of support and resistance can be used in trading in the following manner.
Traders use support and resistance levels to pinpoint strategic entry and exit points in the market. They look for buying opportunities near support levels, anticipating a potential price bounce, and consider selling near resistance levels where downward pressure may emerge.
Understanding support and resistance aids in effective risk management. Traders set stop-loss orders just below support levels when buying and just above resistance levels when selling to minimise potential losses in case the market doesn't behave as expected.
Breakouts and breakdowns through support and resistance levels can confirm the strength or weakness of a trend. Traders closely watch for these breakthroughs as they may indicate a change in market sentiment and potentially offer profitable trading opportunities.
Significant breaks through support or resistance can signal trend reversals. Traders use these indications to adapt their trading strategies, potentially capitalising on emerging trends in the market.
Support and resistance levels can serve as reference points for setting price targets. Traders often look to take profits when a security reaches a known resistance level or adjust their strategies based on the proximity to support or resistance.
Support and resistance are influenced by market psychology, therefore, traders analyse these levels to gauge the collective sentiment of market participants. Strong reactions at these levels can thereby provide insights into potential market movements.
Traders often combine support and resistance analysis with other technical indicators for a more comprehensive view. This holistic approach helps traders make well-informed decisions by considering multiple factors influencing the market.
Support and resistance are commonly used concepts in many technical indicators for making sound trading strategies. Some of the popular technical indicators that use the concept of support and resistance for analysing a stock or security are explained hereunder.
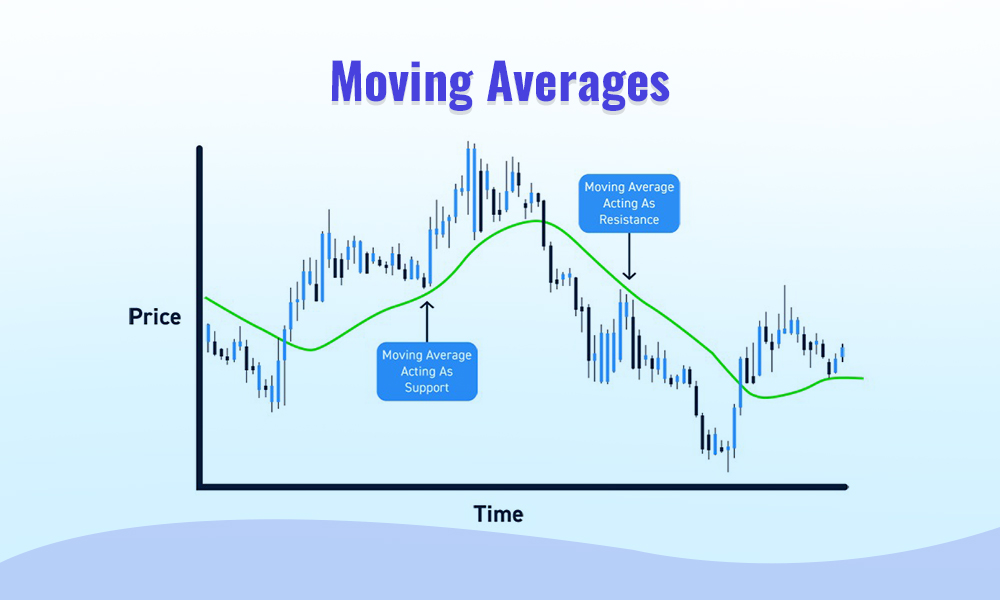
Moving averages are commonly used technical indicators that incorporate support and resistance in trading signals. Traders often employ Simple Moving Averages (SMA) or Exponential Moving Averages (EMA) to identify trends and potential reversals. When prices approach or bounce off a moving average, it can act as dynamic support or resistance, providing signals for entry or exit points. The crossover of short-term and long-term moving averages is also used to identify trend changes and generate trading signals.
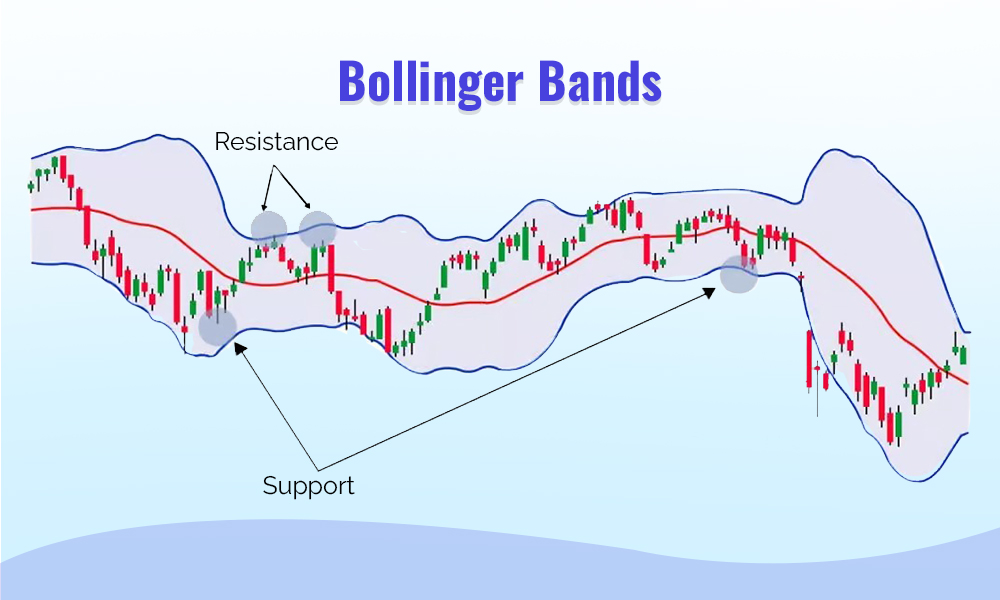
Bollinger Bands consist of a middle band (usually a 20-day moving average) and two outer bands that are standard deviations away from the middle band. Traders use Bollinger Bands to identify overbought or oversold conditions. When prices touch or move outside the bands, it may indicate a potential reversal. The middle band can act as a dynamic support or resistance level, providing traders with signals for potential trend changes.
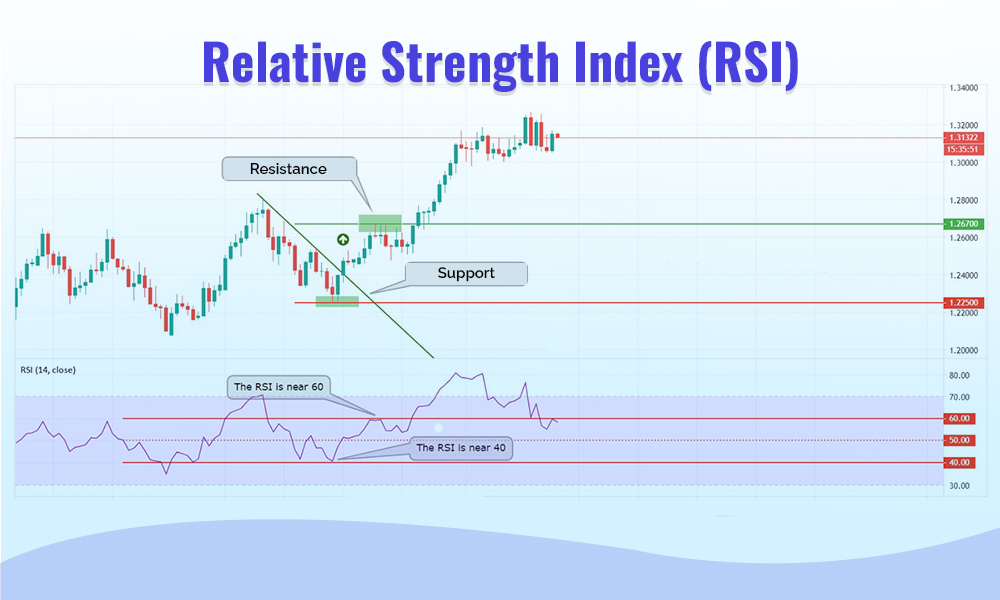
The Relative Strength Index is a momentum oscillator that measures the speed and change of price movements. Traders use RSI to identify overbought or oversold conditions, which can be indicative of potential reversals. Support and resistance levels on the RSI chart are thoroughly monitored and any divergence between price and RSI can provide signals for trend reversals.
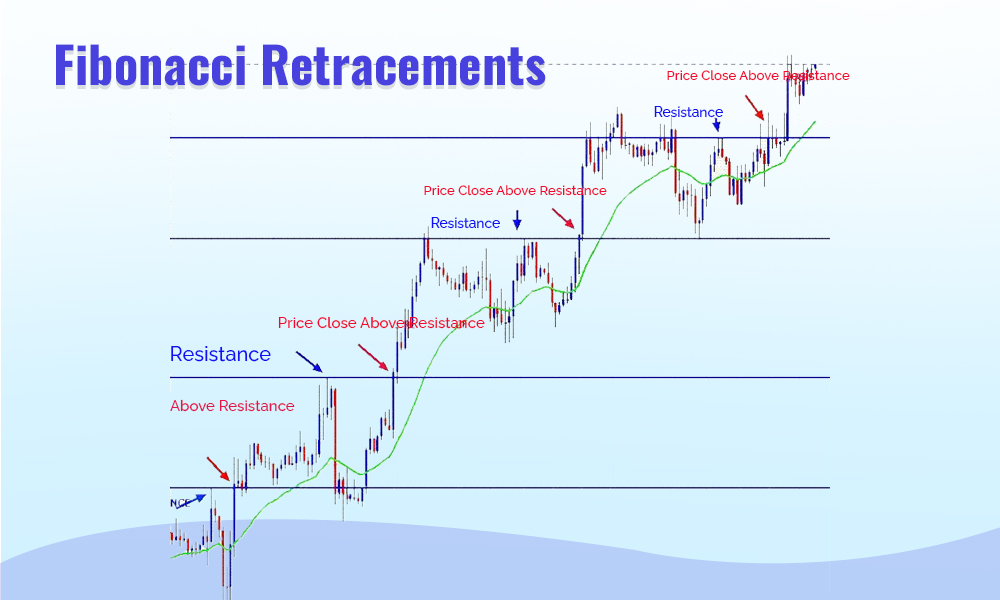
Fibonacci retracement levels are based on mathematical ratios and are often used by traders to identify potential support or resistance levels. The key Fibonacci levels, such as 38.2%, 50%, and 61.8%, can act as support or resistance, helping traders determine potential reversal points. These levels are particularly useful for identifying retracement levels during a trend.
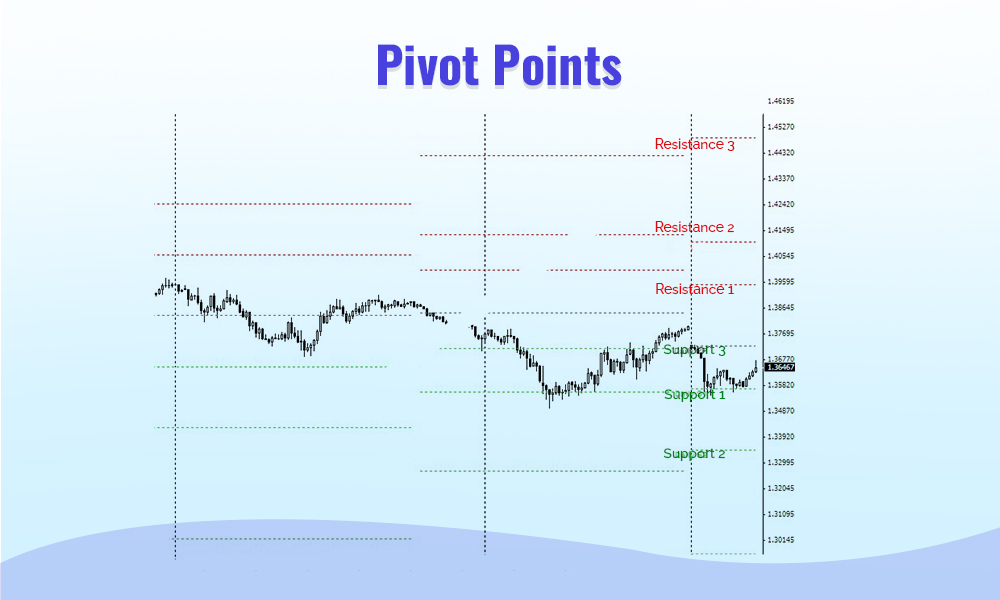
Pivot points are calculated based on the previous day's high, low, and close prices and are used to identify potential support and resistance levels for the current day. Traders use pivot points to determine key price levels. The interaction between the price and these levels can generate signals for entry, exit, or trend continuation.
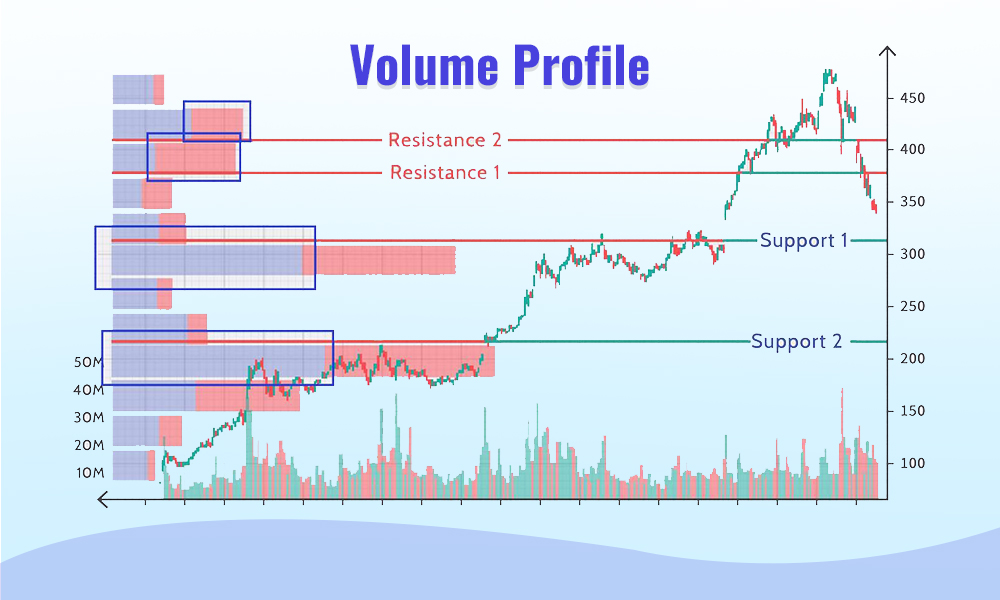
The Volume Profile is an indicator that shows the volume traded at different price levels over a specified period. Traders use volume profile to identify significant support and resistance zones based on high-volume areas. The presence of heavy trading activity at specific levels can provide confirmation for potential reversals or trend continuations.
Support and resistance are fundamental concepts in technical analysis widely utilised by traders. These levels for any stock or asset provide a key understanding of the overall market sentiment and are crucial in implementing effective trading strategies. The nuanced understanding of these concepts empowers Indian traders to make informed decisions in the dynamic and ever-changing landscape of financial markets.
We hope this article was able to provide you with a basic understanding of the support and resistance which are the central concepts in technical analysis. Let us know if you have any queries or need further information on this topic and we will address it.

When we take our first step into the trading game, we choose the best resource...
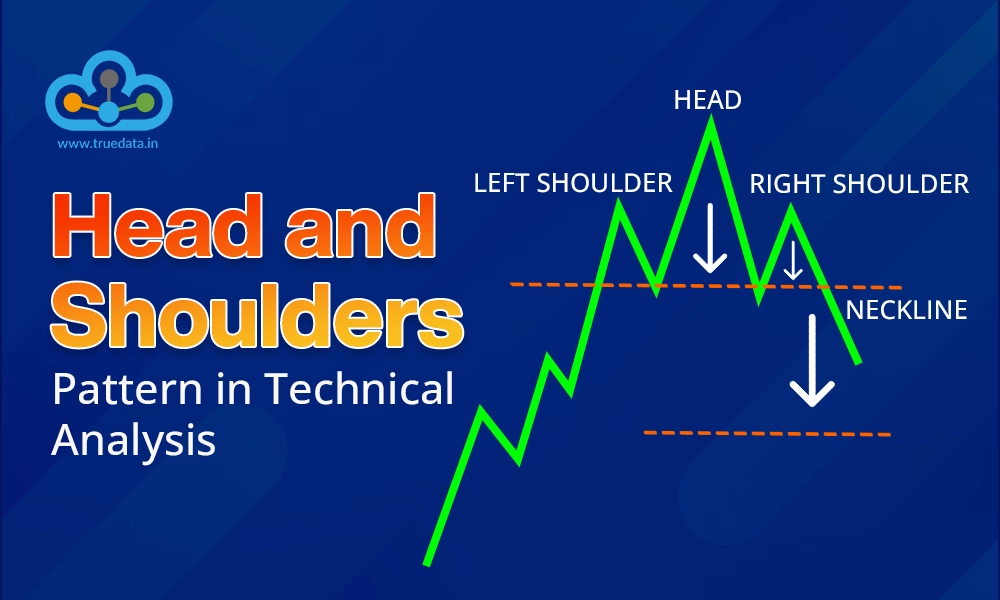
Technical analysis is the basis of stock trading and finding suitable entry and ...

What is Simple Moving Average (SMA)? SMA is essentially the mean, or normal, of...