
We have all heard of stock market giants like Mr Rakesh Jhunjhunwala, Mr Radhakrishna Damani, Mr Ashish Dhawan, and more. These stock market moguls have left a lasting mark on the Indian stock markets and every investor aims to be successful like them. However, like any race, to win, we have to master the basics first. Therefore, a basic understanding of stock markets and analysing various stocks is crucial to make sound investment decisions. While fundamental analysis of stocks helps in understanding the quality of stocks and their future projections, it is the technical analysis part that helps in understanding the market trends and the right time to enter or exits the markets.
Technical analysis is the study of price and volume movements using various tools like stock charts, indicators, and candlestick patterns (Traders can use the NCS scanner of Truedata to know more about candlestick patterns). RSI Indicator is one such indicator that can be used by traders to understand the price movement and thereby analyse stocks. Given below is a brief discussion on RSI indicators that can help traders create a profitable portfolio.
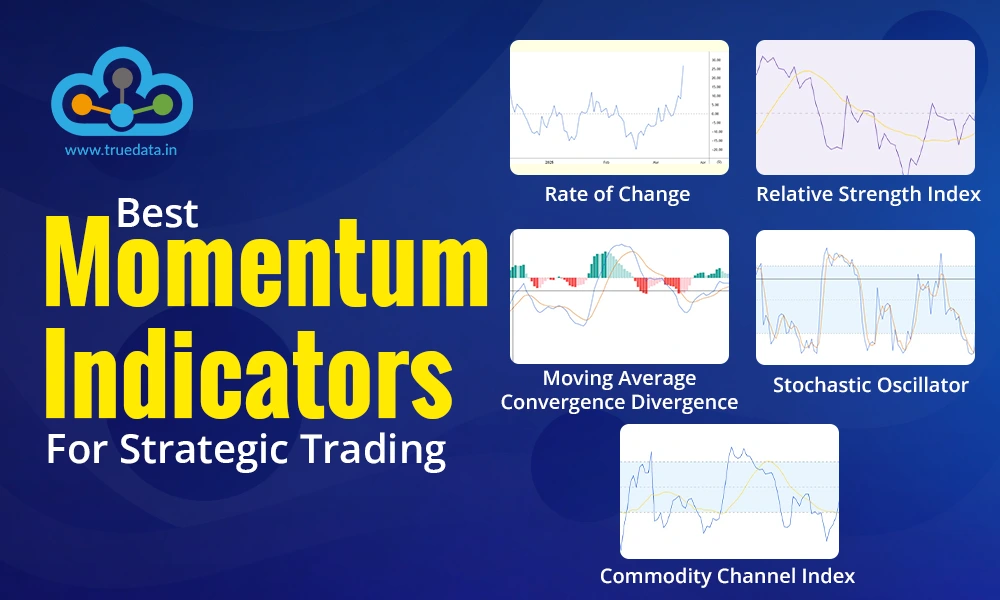
Among various tools of technical analysis, momentum oscillators study the velocity of change in the price of stocks. RSI (Relative Strength Index) Indicator is one such momentum oscillator and was first introduced in 1978 by J. Welles Wilder. This indicator can be used to analyse various securities like stocks, commodities, bonds, futures in the stock market in the stock market, etc. It helps in understanding the magnitude and the speed of the price changes over a specific period which is usually 14 days. The value derived from calculating the RSI indicator is then used to understand if the stocks or other security is overbought or underbought and if it is a good bet.

The mode of calculating and understanding most technical indicators is quite complex. This often deters small investors or beginners from dabbling into technical analysis or they fail to understand the importance of the same. With the RSI indicator, this is not the case. It is among the most basic indicators that can be easily calculated and understood by even young traders without any significant experience. The RSI indicator is usually used by swing trading and the swing is between 0 to 100. Traders tap the opportunities arising from changes in momentum in the short-term or medium-term price fluctuations.
The formula to calculate the RSI indicator is given below.
RSI = 100 – [100/ (1+ Average gains / Average losses)]
Or
RSI = 100 – [100/ (1+RS)]
Where RS (Relative Strength) = Average gains / Average losses
As mentioned above, the usual calculation period of the RSI indicator is 14 days, however, traders can alter the trading period based on their individual requirements and sensitivity to the change.

When the RSI indicator is calculated using the above formula, the result of the same ranges between 0 to 100 and based on it, traders estimate if the stock (or any other security) is overbought or oversold.
To understand the concept of the RSI indicator in a better manner, let us consider the following example.
Consider a trading period of 14 days where the stock had generated positive returns for 10 days and negative returns for 4 days. Traders will first have to calculate the absolute gains for the 10 positive days and then divide the same by 14. This will provide the ‘Average gains or the Average up closes for the trading period. The next step is to calculate the absolute losses in the trading period of 4 days and divide the sum by 14 to derive the average losses for the period or the average down closes. These values are then applied to the above formula to derive a number that ranges from 0 to 100. The interpretation of the resultant number using the RSI indicator is given below.
If the RSI indicator is above 70, the security is considered to be overbought
If the RSI indicator is below 30, the security is considered to be oversold.
Traders have to further consider the RSI indicator with respect to the prevailing market trend. If the market is bullish, the RSI indicator usually fluctuates between 40 to 80 or 90. In such a scenario, the RSI indicator of 40 to 50 will act as the support line. On the other hand, in a bearish market, the RSI indicator usually fluctuates between 10 or 20 to 60. In such a market trend, the RSI indicator in the range of 50 to 60 will act as the resistance level.
The above parameters are the general interpretations for securities at large. Traders have to consider the individual strength of the underlying security for correct analysis as well. A stock or a security is generally considered to have an uptrend if the price is above 50 and a downtrend if the price is below 50.
Traders also have to consider the price divergence while using the RSI indicator for analysis. Price divergence refers to the point of bend in the price trend to indicate a reversal of the prevailing trend. Another indicator of trend change through the RSI indicator is when the price line and the RSI move in opposite directions which indicates a potential trend reversal.
Technical analysis is the study of price movements that are based on interpretations. These interpretations, therefore, may not always be 100% accurate. RSI indicator is also not free from such limitations as any other indicator or strategy of technical analysis. Some of the prime shortcomings of using the RSI indicator are,
RSI indicators may not prove to be as useful in the face of strong market trends.
It is possible for the RSI indicators to give false or misleading directions that result in wrong trading or investment decisions on the part of the trader.
RSI indicator may stay in the overbought or oversold zone for a significant time and may not reflect a clear trend or reversal of the same. This time-lapse will not provide a clear direction for the trader to understand the price trend or the potential reversal of the same leading to wrong interpretations.
RSI indicators are one of the easier technical analysis tools that can be used by traders for their daily trades and for taking suitable positions for the long term or short term. However, as the saying goes, the more the merrier, any wise and experienced trader will definitely agree that it is prudent to use one or more indicators to support the analysis and interpretation of the price trend. Relying solely on the RSI indicators for trading decisions may lead to erroneous interpretations that can wipe out the net gains of the portfolio.
So what do you think about the RSI indicator, easy to understand? Do let us know your opinion on the RSI indicator and how it has helped you in making trading decisions as well as shaping your portfolio.
Welcome to our blog!
This blog is a collaborative effort and was compiled by multiple members of the TrueData Team

What is one of the deciding factors while investing in a stock? It is its valuat...
The key tosuccessful trading is understanding price variations and the degree of...

When we take our first step into the trading game, we choose the best resource...