
The key to successful trading is understanding price variations and the degree of fluctuations. One trading approach traders use to achieve this is momentum trading. Traders use various momentum indicators, among other tools, to pinpoint suitable entry and exit points for maximum profits or minimising their losses. Check out this blog to learn about a few popular momentum trading indicators used by traders worldwide to refine their trading strategies and build a potentially profitable trading portfolio.

Momentum indicators are technical analysis tools used by traders to measure the strength and speed of a price movement in an asset over a specific time period. The main purpose of these indicators is to help traders identify whether the asset's price trend will continue or reverse. In simple terms, momentum refers to how quickly and strongly the price of an asset is moving in one direction. Traders use momentum indicators to spot trends, overbought or oversold conditions, and possible entry or exit points. Some of the popular momentum indicators include the Relative Strength Index (RSI), Moving Average Convergence Divergence (MACD), and Stochastic Oscillators.
Momentum indicators do not indicate the direction of the trend but the strength of the trend or potential reversals. Some of the popular momentum indicators are discussed in detail hereunder.
")
Relative Strength Index (RSI) indicator is a widely used momentum indicator that measures the speed and change of price movements. It helps traders determine if a stock is overbought (too expensive) or oversold (too cheap). RSI measures the speed and size of recent price movements and gives a value ranging between 0 and 100. When the RSI is above 70, it means the stock has gone up too much too quickly, and it might fall soon. When the RSI is below 30, it means the stock has fallen too much and could bounce back up. Traders use the RSI to decide when to buy or sell a stock.
The formula to calculate the Relative Strength Index is,
RSI = 100 [100 / (1+RS)]
Where,
RS (Relative Strength) = (Average Gains over ‘n’ Period / Average Losses over ‘n’ Periods)
The default ‘n’ period is 14 days.
")
The MACD (Moving Average Convergence Divergence) is a momentum indicator that helps traders understand whether the trend of a stock is strong or weak. It consists of two moving averages (12-day EMA and 26-day EMA) and a signal line (9-day EMA). When the MACD line crosses above the signal line, it is a sign that prices might rise, so traders take it as a buy signal. When the MACD line crosses below the signal line, it suggests that prices might fall, which is a sell signal. The MACD also has a histogram, which visually shows the difference between the MACD line and the signal line. If the histogram is growing, it means momentum is increasing in the direction of the trend. Traders use MACD to confirm trends and spot possible trend reversals.
The formula to calculate MACD is,
MACD = 12-day EMA - 26-day EMA
Signal Line = 9-day EMA of MACD
Histogram = MACD Line – Signal Line

The Stochastic Oscillator is another momentum indicator that helps traders identify if a stock is overbought or oversold. It compares the closing price of a stock to its price range over a set period (usually 14 days). Traders use the stochastic indicator to predict possible price reversals and confirm trends. The indicator assigns values ranging between 0 to 1000 to indicate the overbought and oversold conditions and thereby trigger the buy and sell signals for traders. When the Stochastic Oscillator is above 80, it means the stock is overbought and might soon fall. When it is below 20, it means the stock is oversold and could rise.
The formula for calculating the Stochastic Oscillator is,
%K = (Current Close - Lowest Low) / (Highest High - Lowest Low) * 100
%D = 3 Day Simple Moving Average of %K
Where,
Lowest Low = Lowest price in the past 14 days.
Highest High = Highest price in the past 14 days.
")
The Rate of Change (ROC) is a simple but effective momentum indicator that shows how fast a stock’s price is moving compared to its price a few days ago. It calculates the percentage change in price over a certain period, usually 10 or 14 days. If the ROC is positive and rising, it means the stock’s price is increasing quickly, which is a good sign for buyers. If the ROC is negative and falling, it means the price is dropping, and traders might consider selling. A sudden increase in ROC suggests a strong momentum in the stock’s direction, while a declining ROC means the momentum is weakening. Traders use ROC to confirm trends and to spot breakouts (when a stock moves sharply in one direction).
The formula to calculate ROC is,
ROC = (Current Price - Price ‘n’ days ago) / Price ‘n’ days ago * 100
")
The Commodity Channel Index (CCI) is a momentum indicator that helps traders find new trends and overbought or oversold levels. It measures how far the stock’s price is from its average price over a certain period (usually 20 days). If the CCI is above +100, it means the stock is in an uptrend, and traders might consider buying. If the CCI is below -100, it means the stock is in a downtrend, and traders might consider selling. Unlike RSI and the stochastic oscillator, CCI does not have strict overbought or oversold levels, but traders often use +100 and -100 as key points. A rising CCI suggests strong momentum, while a falling CCI means the stock’s trend is losing strength. Traders use CCI to identify trend reversals and confirm existing trends.
The formula to calculate CCI is,
CCI = (Typical Price−SMA of Typical Price) / 0.015 * Mean Deviation
Where,
Typical Price = (High+Low+Close) / 3
SMA = Simple Moving Average

Momentum indicators are a popular technical analysis tool for understanding the trend strength and avoiding false signals. However, traders need to consider the pros and cons of using momentum indicators for successful trading. Here is a brief analysis of the same.
Momentum indicators help identify the trend strength and are useful for confirming trend direction before entering a trade.
They can be used to generate buy and sell signals and identify potential entry and exit points for trades
These indicators work in multiple market conditions like trending markets or range-bound markets.
Momentum indicators can be used for short-term or long-term trading and are thus useful for intraday traders as well as swing and positional traders.
These indicators are easily accessible, as they are free and easy to use on most platforms, such as the NSE/BSE platform or broker apps.
Momentum indicators can generate false signals and can lead to misleading buy/sell signals in sideways or choppy markets.
Most momentum indicators can be lagging indicators, leading to delayed entry/exit points.
Momentum indicators can be less reliable in highly volatile stocks (such as small-cap or penny stocks), as they can quickly reach overbought and oversold levels.
Momentum indicators are powerful technical analysis tools that can help traders measure the strength and speed of price movements in stocks, indices, and other financial assets. These indicators can be a strong asset for traders, helping them to confirm the prevailing trend or potential reversals and shape a potentially profitable portfolio. However, they do come with a few limitations and hence, traders need to have a disciplined approach while using them for successful trading.
This blog talks about the basics of popular momentum indicators. Let us know if you have any queries on these indicators and how to use them, and we will address them in our coming blogs.
Till then, Happy Reading!
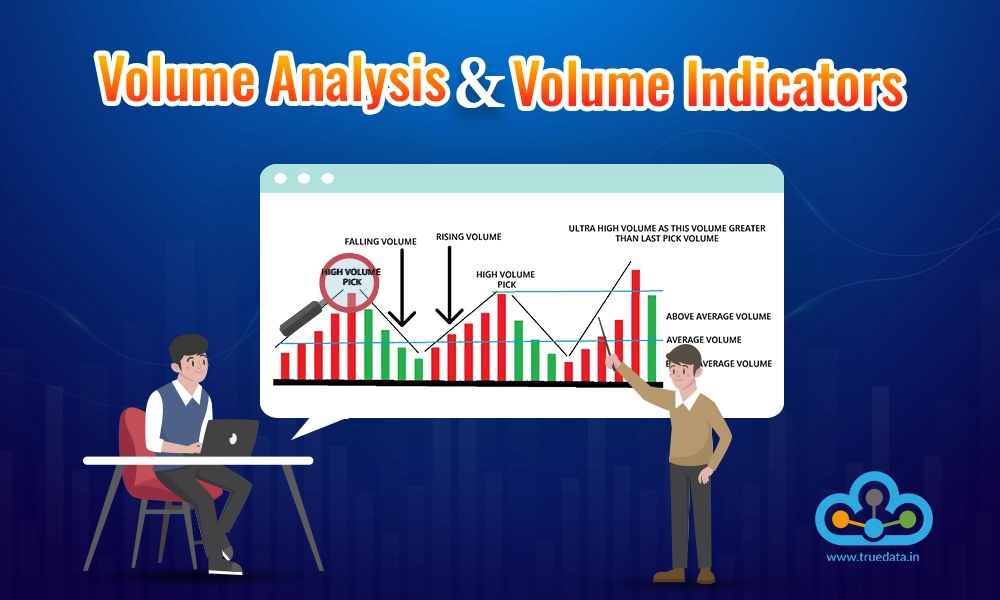
Read More: Volume Analysis and Volume Indicators
Marisha Bhatt is a financial content writer @TrueData.
She writes with the sole aim of simplifying complex financial concepts and jargon while attempting to clarify technical and fundamental analysis concepts of the stock markets. The ultimate goal is to spread vital knowledge and benefit the maximum audience. Her Chartered Accountant background acts as the knowledge base to help clarify crucial concepts and create a sound investment portfolio.
this is a great read. thank you. keep going
Thank you so much for your kind words! We truly appreciate it Sir!
good read.
Thank you for appreciating our work, sir!
how can i find momentum in intraday
Traders can watch for strong price movements with high trading volume using tools like moving averages or RSI to find momentum in intraday trading. It is also advisable to keep track of news and market trends as they often park momentum. We hope this addresses your query. Keep reading and engaging with TrueData for more quality content!
Excellent post.
Thanks a ton! Your appreciation means a lot to us.
I discovered an excellent blog on Pinterest. The topics related to trading strategies are quite intriguing.
Thank you for appreciating our work! Glad you liked the blog on trading strategies. Keep exploring and learning more on TrueData!
I found the explanation of momentum indicators very beginner-friendly. The formulas and practical use cases helped me understand how traders identify trend strength.
Thank you for your kind feedback! We are glad you found the explanation easy to understand. Keep reading and engaging with TrueData for more informative content!
Good post. Many traders focus only on signals and forget about the possibility of false indications.
Thank you for your valuable observation! You are absolutely right, no indicator is perfect, and false signals can occur, especially during volatile or sideways markets. Hence, traders should use momentum indicators along with other technical tools, risk management practices, and proper confirmation before making trading decisions.
I appreciate that the blog discusses multiple indicators instead of focusing on just one. It gives readers a broader perspective on momentum-based trading strategies.
Thank you for your thoughtful feedback! We are glad you appreciated the broader approach. Since each momentum indicator has its own strengths and limitations, understanding multiple indicators can help traders compare signals, confirm trends, and build more effective momentum-based trading strategies.
Well-written article with practical insights. The pros and cons section provides a balanced view and helps traders set realistic expectations when using momentum indicators.
Thank you for your kind feedback! We are glad you found the balanced approach helpful. Understanding both the advantages and limitations of momentum indicators is important because it helps traders set realistic expectations, avoid overreliance on any single tool, and make more informed trading decisions.
The comparison of RSI, MACD, Stochastic Oscillator, ROC, and CCI was very informative. Thanks for putting everything together in one place.
Thank you for your kind feedback! We are glad you found the comparison useful. Understanding the strengths and limitations of different momentum indicators can help traders choose the tools that best fit their trading style and market conditions.

When we take our first step into the trading game, we choose the best resource...
It is a fact that technical analysis is the basis of analysing stocks. What does...

Analysing the price direction is the holy grail of trading. To achieve this, t...