
Analysing the price direction is the holy grail of trading. To achieve this, traders use many indicators or charts that can help them understand the price direction or the potential reversals. The Parabolic SAR is one such indicator that can help in understanding such points enabling better entry and exit strategies. Check out this blog to learn the meaning of Parabolic SAR and how to trade using this indicator.
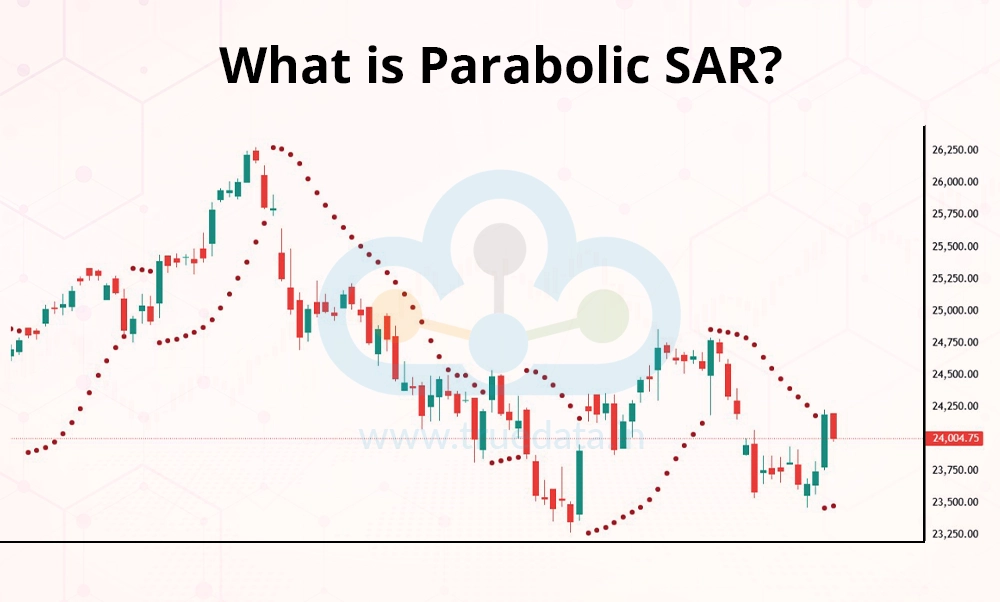
The Parabolic SAR (Stop and Reverse) is a popular technical indicator used in stock trading to help identify the direction of a trend and potential points where the trend might change. It was developed by J. Welles Wilder Jr. in 1978, who also created the Relative Strength Index (RSI), and acts as a guide for traders to understand the buy and sell signals in a trade. The term ‘parabolic’ represents the curvature of the indicator which resembles a parabola on a price chart. The SAR part stands for ‘Stop and Reverse’ suggesting the end of the current trend followed by a reversal. This indicator calculates a series of dots that are placed above or below the current price which can indicate a downtrend or an uptrend respectively.
The calculation of the Parabolic SAR is based on several factors like the current price, the previous price, and the Acceleration Factor (AF). The formula to calculate Parabolic SAR is given below,
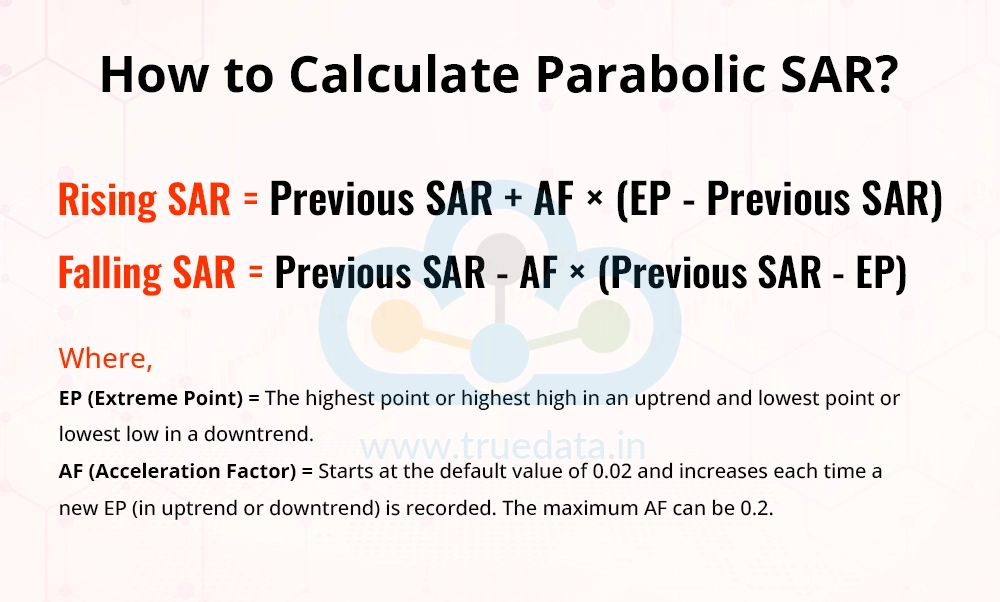
Rising SAR = Previous SAR + AF × (EP - Previous SAR)
Falling SAR = Previous SAR - AF × (Previous SAR - EP)
Where,
EP (Extreme Point) = The highest point or highest high in an uptrend and lowest point or lowest low in a downtrend.
AF (Acceleration Factor) = Starts at the default value of 0.02 and increases each time a new EP (in uptrend or downtrend) is recorded. The maximum AF can be 0.2
The Steps to calculate the Parabolic SAR are,
Identify the current trend and the strength of the trend.
The starting point for calculating the Parabolic SAR is the most recent price point of the trend.
Calculate the EP and the AF.
EP is the extreme point, i.e., the highest price point in an uptrend and the lowest price point in a downtrend.
The starting point for AF is 0.02 and it increases by 0.02 whenever the trend continues hitting a new high or new low.
Apply the formula to calculate the Parabolic SAR in a rising or falling trend.
Continue the same for the following periods.
Interpretation of Parabolic SAR
A higher SAR than the current price in an uptrend indicates a trend reversal to a downtrend.
A lower SAR than the current price in a downtrend indicates a trend reversal to an uptrend.
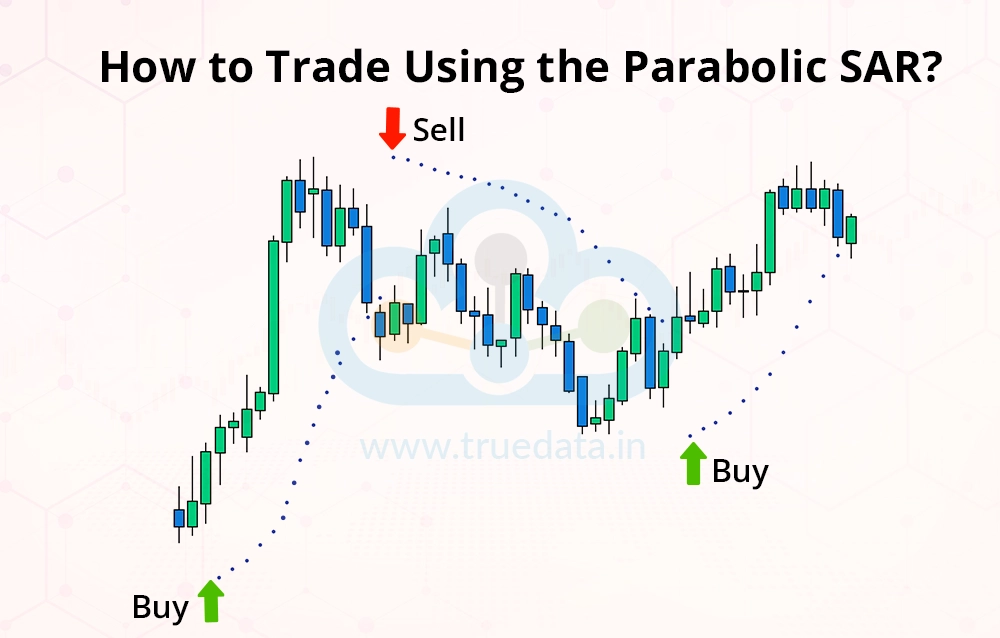
The Parabolic SAR is a trend-following indicator that works best in a trending market rather than a sideways market. Dots placed below the price bars signal an uptrend while dots placed above the price bars signal a downtrend. This helps traders know the market direction. Hence, the first step in using the Parabolic SAR should be to analyse the market direction and the strength of the trend.
The parabolic SAR can be a rising Parabolic SAR or a Falling Parabolic SAR. The dots placed below the price bars in the uptrend can be used as a buy signal by the traders as it indicates the continuation of the uptrend. Similarly, the dots placed above the price bars in a downtrend can be seen as a sell signal indicating the continuation of the same trend.
Traders can also use stop-loss as an effective risk management technique and minimise losses in case of sudden price shifts. These stop-loss orders can be placed at the SAR levels to limit the losses. Traders can also use trailing stop-loss to lock in the profits and move along the trend.
When the price crosses the SAR dots, it can indicate a potential trend reversal and traders can exit their trades to take revised suitable positions. It is also essential to confirm the continuation or reversal of the trend using other technical analysis tools and indicators like the Moving Averages, MACD (Moving Average Convergence Divergence), RSI Indicators, etc. to avoid false signals or misinterpretations.
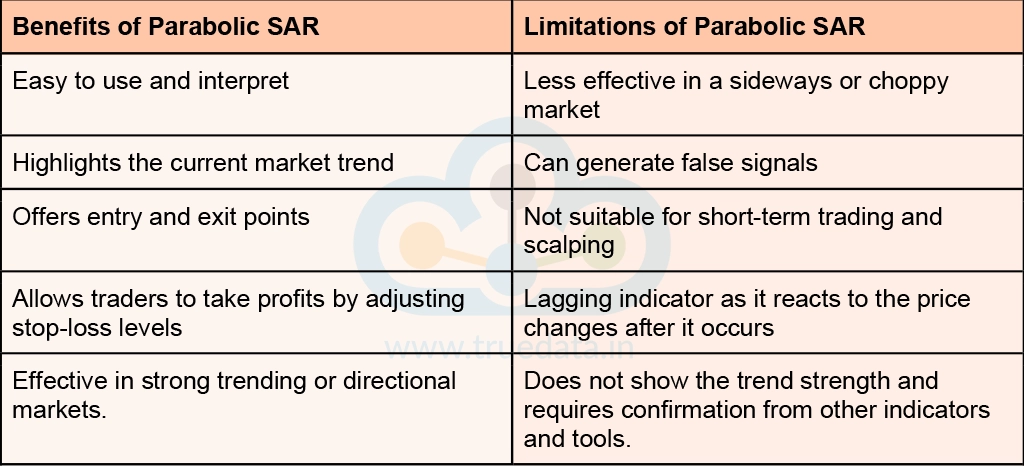
Like any other technical analysis indicator, the Parabolic SAR also has its own set of benefits and limitations. Traders should, therefore use this indicator with a thorough understanding of the same to make informed trading decisions.
The Parabolic SAR is an effective tool that allows traders to identify suitable entry and exit positions in a trend and capitalise on the price movements. This indicator can also help identify trend reversals allowing traders to adjust their trading positions to minimise losses or maximise profits in their trading journey. This allows traders to have a disciplined approach towards trading making the Parabolic SAR an essential tool or indicator for successful trading even after decades of its origins.
This blog is our addition to the series of indicators and trading strategies to help traders understand them in a simplified manner. Do you also use the Parabolic SAR as part of your trading strategy? Let us know your thoughts in the comments or if you need such information on any other indicator.
Till then Happy Reading!
Read More: ADX Indicator - All You Need to Know

When we take our first step into the trading game, we choose the best resource...

What is one of the deciding factors while investing in a stock? It is its valuat...

The key tosuccessful trading is understanding price variations and the degree of...