 When we take our first step into the trading game, we choose the best resources for ourselves. For rookie brokers, it can be a tad bit tedious to look for the Best Technical indicator. The purpose of using Technical indicators is to follow the action and it influences the way you interpret trends. Be it on positions and broad averages or the type of opportunities that pop up in those researches of yours. Technical indicators sure can be attractive and appealing, especially to those who are putting their foot in the market. The indicators return a clear sign of whether or not you should buy or sell the shares. One can interpret technical indicators very easily across different markets. Novices usually wonder as to why technical indicators are of great importance in the market.
When you don’t use technical indicators, it will be difficult for traders to assess the prevailing volatility of the market, the strength of a trend, or whether market positions are overbought or oversold. Before I go on listing the best technical indicators for you, there are three types of technical indicators that you should unquestionably know -
 Trend-following indicators are meant to ascertain the trends and measure the strength of a trending market. Yes, it can be told by looking at the price chart, however, it is a bit difficult to measure its strength and to spot a trend when it is early in its transformation. Momentum Indicators
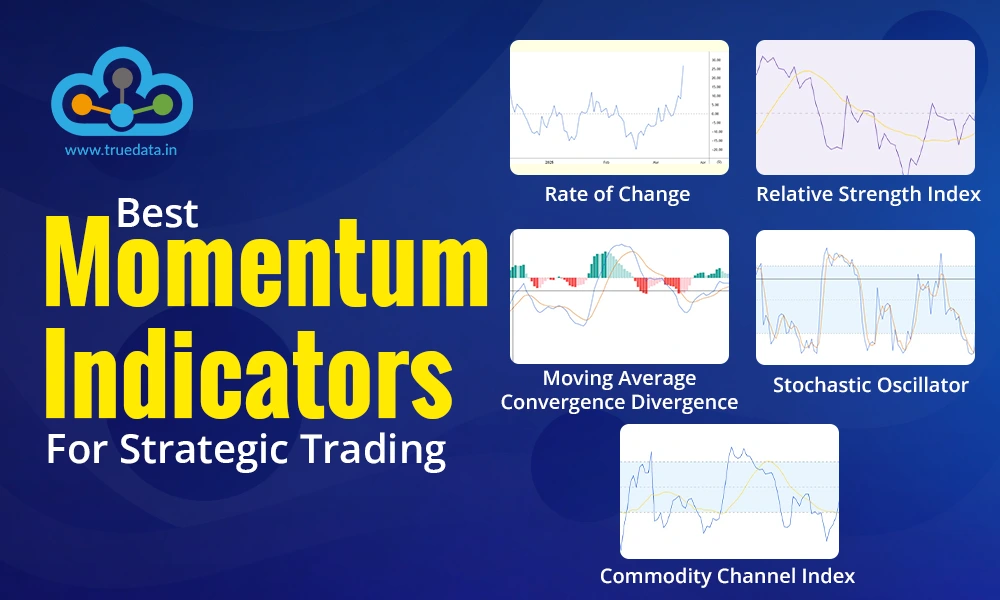
  Momentum indicators measure the strength of current price fluctuations in previous periods. These indicators fluctuate between 0 to 100 which provides signals whether the market conditions are overbought or oversold.
 Volatility indicators measure the volatility of the underlying instrument. Traders chase volatility across markets to ensure they find profitable opportunities to trade.
 These are not only popular day trading indicators but are ideal for both - trend-following indicators and counter-following indicators. Moving averages show the average of the last n-period closing prices. These averages are generally plotted on the price chart. As a new closing price comes in, the last closing price in the series drops, and thus, the moving average drops.
 The average True Range Indicator is one of the best technical indicators that measures the volatility of the market by considering the following - the current low subtracted from the current high, the previous close subtracted from the absolute value of the current high, and the absolute value of the current low minus the previous close. ATR indicator takes together all the averages of the values for a specified time, which is further then plotted in the form of a moving average on the chart. RSI - Relative Strength Index
  RSI - Relative Strength Index is one of the most popular and best technical indicators. This indicator measures the change in the current price changes and reverts the reading between 0 to 100. Most of the time, RSI to know whether the market is overbought or oversold. A reading which says above 70 usually indicates that the market is overbought whereas a reading below 30 indicates that the market is oversold. Bollinger Bands
  This technical indicator works based on the moving average, it is ideal for detecting the present market volatility. Bollinger bands contain three lines -
We aren’t telling you to drop other kinds of analyses and trust technical indicators blindly. However, technical indicators can come in handy when you’re new to the market. You need not worry about which one to use because we have already listed the best ones for you (they are not in any order of preference). And now, we will be addressing a few frequently asked questions -
To explain in simple words, a trend reversal is more or less your entry and exit in the stock market. When you identify the best reversals. You will be on the path to trading success in no time. There are consequences to false reversal such as missing potential trading setups or you will have to scramble back to be back in the flow. With that being said, here is the list of best technical indicators to find short-term trend reversals -
 One of the favored methods of using a moving average is by examining its direction. The strength of using moving averages is that it allows you to use a few of them to keep track of differing degrees. However, it comes with a drawback and that is if you use it too much then you will end up turning its strength into a disadvantage.
 Donchian channel has maintained its status as a powerful trend-tracking tool. Donchian Channel is grounded in price action. It is not a typical indicator with a hard-to-grasp formula. This indicator has two lines. This helps in attaining the highest price and the lowest price attained within the lookback period. In simple terms it means, defining a price range by using historical price action.
 The two moving averages of different periods diverge when the trend strengthens and the moving averages converge when the trend weakens. A price divergence is a very compelling reverse signal and happens to occur when a price and an oscillator disagree.
There is a close relationship between technical indicators and Technical Analysis. Technical indicators help technical analysis respond to any important volatility or price action as it takes place in the price of a stock. Technical analysis can help the traders to determine the levels of support and resistance in price whereas technical analysis helps the traders to determine whether the price of the stock has dropped lower or climbed higher and to break out of the last price range. The combination of technical analysis and technical indicators, helps the traders to predict prices and start undervalued security with the right price size at the right time. We have enlisted a few of the most useful technical indicators when combined with technical analysis.
 Relative Strength Indicator or RSI is a momentum (the rate at which price rises or falls) oscillator. RSI helps to compare the magnitude of recent gains and losses over a particular period for measuring the speed and variation of price movements of a security. This indicator can show, whether the product is overbought or oversold by measuring the magnitude of recent price changes.
 This is one of the oldest and the most popular technical indicators used by traders in technical analysis. It is more or less an average of past prices. It creates smooth price data and a single-flowing line.
 This is one of the most reliable momentum tools that helps traders measure the current momentum, especially when compared to the lows and highs of a historical set of prices. The prices tend to close near the high in an upward-trending market and tend to close near their low, in a downward-trending market.
Technical indicators are ideal for predicting the forthcoming changes in the price of the stocks. For carrying out your Stock Analysis, traders can use a combination of different charts and technical indicators. Some of the few reliable indicators for a bullish trend are -
 This indicator helps you to analyze the direction in which the stock price is moving and also helps to find the market volatility. It consists of two bands, the Upper Band and the Lower Band. For particular security, lines are used to depict the volatility range based on a standard deviation.
 We compare one observation point in the current base with the highest and lowest points from a specified range. It further helps to predict the strength of the current trends.
Following the basic intraday tips is a common practice for traders, be they beginners or established traders. The trading strategy for every trader changes with time. To maximize returns, it is necessary to understand the markets. Trading indicators can help in maximizing revenue If used with a comprehensive strategy.
Here are the best technical indicators for intraday trading -
 If long-term averages are more than short-term averages, it is an indication of a bullish market trend. Traders may take a buy call with specific strategies like stop-loss either at retracement support or long-term moving average and vice-versa. It can help users to earn decent profits.
 There is a great chance for the price to increase in the future only if the stock is trading at a price prevailing below the Bollinger Band lower line. Traders can sell the share when the current stock price is over the upper line. Using intraday indicators helps to avert risk and place appropriate traders based on market sentiments and technical analysis. It is not entirely true when they say that trading is based on our gut, rather it is a blend of a whole other lot of analyses, indicators, and gut. Our only advice is to keep trading and be safe. And on that note… Adios!
Welcome to our blog!
This blog is a collaborative effort and was compiled by multiple members of the TrueData Team
The key tosuccessful trading is understanding price variations and the degree of...
It is a fact that technical analysis is the basis of analysing stocks. What does...
Introduction Real Time Data from NSE, BSE & MCX is distributed to various d...