
Stock markets are volatile and therefore investing in stocks and other securities has inherent risk. There are a number of factors that can affect the stock markets and the market trends and the ultimate goal for any investor and trader is to minimise their risks and gain maximum returns. Interestingly, the interpretation of volatility and the way it is used to trade in different securities is what can be used to make a successful portfolio. However, there is another concept of implied volatility that also needs to be addressed, especially in options trading. Read on to learn about implied trading and its related concepts as well as its use in option trading.
Read More: What are option greeks?

The simple meaning of implied volatility is an estimate of how much the price of a security, like a stock or option, is expected to change in the future. It is derived from the prices of options traded on the underlying instrument. To understand the concept of implied volatility, it is important to understand the meaning of the term volatility first. Volatility is the degree of price fluctuation or uncertainty associated with an asset over a given period. High volatility suggests large price swings, while low volatility indicates relatively stable prices.
Implied volatility, on the other hand, is a forward-looking measure that is not based on historical price movements but is instead derived from the prices of options. When market participants buy and sell options, the prices of these options fluctuate. The implied volatility is the level of volatility that would make the option's current market price reasonable or fair. In other words, it is the level of volatility that market participants expect the underlying asset to experience before the option's expiration. Implied volatility is an essential concept in options trading because it affects the price of options. When implied volatility is high, option prices tend to be more expensive because there is a higher likelihood of significant price movements in the underlying asset. Conversely, when implied volatility is low, options prices tend to be cheaper since there is less expected price fluctuation. Traders and investors closely monitor implied volatility because it can provide insights into market sentiment and expectations.
Implied Volatility (IV) is calculated using an iterative process that involves option pricing models and market prices. The most commonly used option pricing model is the Black-Scholes model.
The calculation starts with an initial assumption of implied volatility. The option pricing model is then used to calculate the theoretical price of the option based on the assumed volatility, along with other inputs like the underlying asset price, strike price, time to expiration, interest rates, and dividends. The calculated theoretical price is then compared to the actual market price of the option. If the calculated price does not match the market price, the assumed volatility is adjusted, and the calculation is repeated. This iterative process continues until the calculated price closely matches the market price. The final assumed volatility that produces the best match between the calculated and market prices is considered implied volatility.
Implied volatility represents the market's expectation of future price volatility for the underlying asset. Traders can access implied volatility calculations through trading platforms, financial websites, or specialized software, which provide the necessary inputs for the calculations.

To effectively use implied volatility in options trading, here are the steps you can follow:
Conduct thorough research and analysis on the underlying asset you want to trade options on.
Identify specific options contracts aligned with your trading objectives.
Assess the implied volatility of the options to determine relative levels.
Consider historical volatility to evaluate whether options are overpriced or underpriced.
Determine an appropriate trading strategy based on the analysis of implied and historical volatility.
Implement risk management techniques to protect your options positions.
Monitor and track changes in implied volatility over time.
Combine implied volatility analysis with other technical and fundamental indicators.
Stay informed about news and market developments that may impact volatility.
Adjust trading strategies or exit positions if implied volatility significantly deviates from expectations.

Historical implied volatility (IV) is a measure used in financial markets to assess the expected future volatility of a particular financial instrument, such as a stock or an index, based on its past price movements. It provides insights into the market's perception of the instrument's potential price fluctuations.
Implied volatility, in general, represents the market's expectation of future volatility, as inferred from the prices of options on the instrument. However, historical IV specifically focuses on analyzing past price and option data to estimate the implied volatility for a given historical period.
The steps to calculate historical IV are mentioned below.
Obtain the historical daily closing prices of the underlying instrument you are interested in trading. This data is usually available from financial data providers or online platforms.
Access historical option prices for the same underlying instrument and time period. You can obtain this data from options exchanges, financial data providers, or specialised options databases.
Calculate the logarithmic returns of the underlying instrument based on the historical price data. The formula to calculate the logarithmic return for a specific day is:
Return(t) = ln(Price(t) / Price(t-1))
Where:
Return(t) is the logarithmic return at time t
Price(t) is the closing price at time t
Price(t-1) is the closing price at the previous time period (t-1)
Use an options pricing model, such as the Black-Scholes model, to estimate the implied volatility that would make the model's predicted option prices match the observed option prices. This involves an iterative process of adjusting the implied volatility until the model's prices closely align with the observed prices.
The Black-Scholes model formula for calculating the theoretical price of a European call or put option is:
C = S * N(d1) - X * e^(-r * T) * N(d2)
P = X * e^(-r * T) * N(-d2) - S * N(-d1)
Where:
C is the theoretical call option price
P is the theoretical put option price
S is the current price of the underlying instrument
X is the option's strike price
r is the risk-free interest rate
T is the time to expiration in years
N() is the cumulative standard normal distribution function
d1 = [ln(S / X) + (r + (IV^2 / 2)) * T] / (IV * sqrt(T))
d2 = d1 - IV * sqrt(T)
In the formulas above, IV represents the implied volatility. You would need to adjust the implied volatility value until the calculated option prices match the observed option prices from the historical data.
Repeat the estimation process for different options with varying strike prices and expiration dates. This allows you to capture a range of implied volatilities across the options chain.
Once you have estimated implied volatilities for various options, you can aggregate the results to obtain a historical IV estimate. This is typically done by calculating the average or weighted average of the implied volatilities across the options.

Current implied volatility represents the market's expectation of future price volatility for the underlying asset. It is derived from the prices of options in the market. IV reflects the collective view of market participants regarding the potential magnitude of price movements. Historical IV, on the other hand, is a measure of the actual volatility experienced by the underlying asset over a specific historical period. It is calculated based on the historical prices of options.
The relationship between current implied volatility and historical IV can provide valuable insights for traders. Here is a brief discussion on the same.
Traders can compare the current implied volatility with the historical IV to assess whether options are currently priced relatively higher or lower compared to past levels of volatility.
If the current implied volatility is higher than the historical IV, it suggests that options may be relatively expensive. Traders may consider selling options or employing strategies that benefit from a decrease in volatility.
Conversely, if the current implied volatility is lower than the historical IV, it indicates that options may be relatively cheap. Traders may consider buying options or strategies that benefit from an increase in volatility.
Significant deviations between current implied volatility and historical IV can reflect shifts in market sentiment.
This situation may indicate heightened market expectations or uncertainties, such as upcoming news or events that could impact the asset's price. Traders may adjust their strategies to account for potential market developments.
It may suggest a period of calm or complacency in the market, potentially leading to underpricing of options. Traders may look for opportunities to position themselves for potential volatility spikes.
The relationship between current implied volatility and historical IV can also provide insights into the efficiency of option pricing in the market.
If options consistently exhibit higher implied volatility than their historical counterparts, it may indicate persistent overpricing. Traders may explore strategies to take advantage of potentially overpriced options.
Conversely, if options consistently have lower implied volatility than their historical counterparts, it may suggest persistent underpricing. Traders may seek strategies to benefit from potentially underpriced options.
 Works With Options")
The effect of implied volatility on option pricing is explained hereunder.
Implied volatility directly affects the premium or price of an option. As IV increases, option premiums tend to rise, and as IV decreases, option premiums tend to decline.
Implied volatility reflects market expectations of future price volatility. Higher implied volatility suggests anticipated larger price swings, while lower implied volatility indicates expected stability in the underlying asset's price.
Implied volatility contributes to the time value component of an option's price. Time value represents the portion of the option premium related to the potential for future price changes. Higher implied volatility increases the time value component, making options more expensive.
Implied volatility does not directly impact intrinsic value, which is the value an option would have if it were exercised immediately. Intrinsic value is based on the difference between the option's strike price and the current price of the underlying asset.
Implied volatility has a more significant impact on the pricing of out-of-the-money (OTM) options compared to in-the-money (ITM) options. OTM options derive a larger portion of their value from implied volatility since their intrinsic value is minimal.
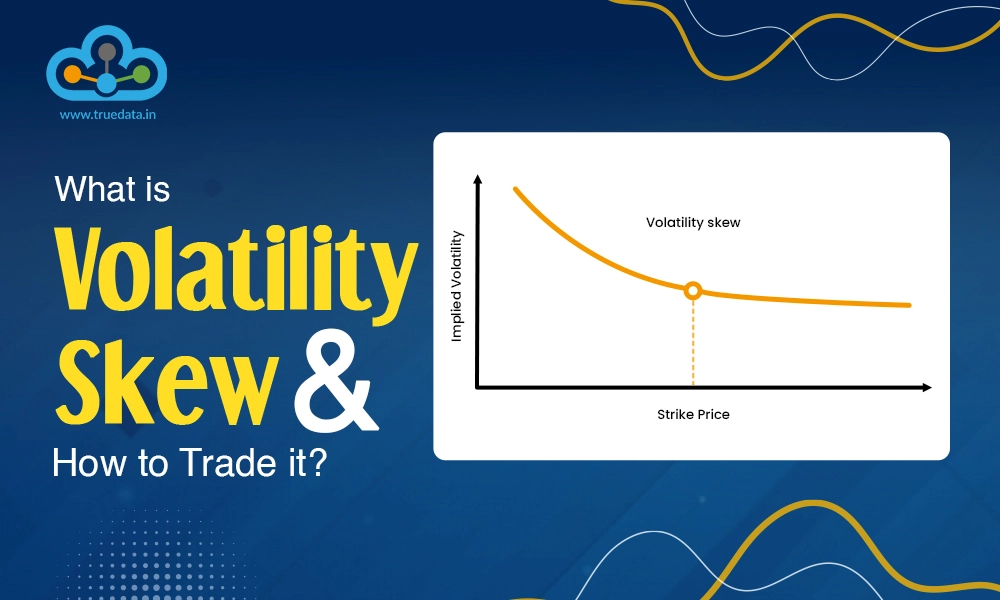
Implied volatility can vary across different strike prices and maturities, leading to volatility skew or smile. Volatility skew refers to the uneven distribution of implied volatility across different strike prices, while volatility smile represents the variation of implied volatility across different option maturities. These phenomena impact option pricing by affecting the relative cost of options at different strikes and expirations.
Implied volatility plays a crucial role in determining the viability and profitability of various options strategies. Different strategies, such as straddles, strangles, or iron condors, rely on specific expectations of implied volatility. Higher implied volatility is generally favourable for strategies that benefit from larger price movements, while lower implied volatility is preferable for strategies that capitalize on relatively stable market conditions.
Implied volatility reflects the market's perception of risk. During periods of heightened uncertainty or market turbulence, implied volatility tends to increase, leading to higher option prices. Traders and investors often use implied volatility as a gauge of market sentiment and risk appetite.
Implied volatility tends to decline after significant events or announcements, especially earnings releases or major economic reports. This reduction in implied volatility, known as implied volatility crush, can significantly impact option prices. Traders who hold options positions through such events must be mindful of the potential impact of implied volatility contraction.
Implied volatility is a vital concept in options trading. Implied volatility can provide useful insights into the options pricing and trading strategies that can help build a successful trading portfolio. Furthermore, Monitoring changes in IV and considering its relationship with historical IV helps traders make informed trading decisions.
This was a detailed discussion on implied volatility and how it is important for traders to understand options trading. Let us know if you have any queries or need more information on the same.
Marisha Bhatt is a financial content writer @TrueData.
She writes with the sole aim of simplifying complex financial concepts and jargon while attempting to clarify technical and fundamental analysis concepts of the stock markets. The ultimate goal is to spread vital knowledge and benefit the maximum audience. Her Chartered Accountant background acts as the knowledge base to help clarify crucial concepts and create a sound investment portfolio.
Good blog post. nicely optimized for search engine.
Thank you for appreciating our efforts Sir!
Excelente explicacion. Gracias !!
Muchas gracias, senor. Me alegra que la explicacion le haya resultado satisfactoria. Esperamos sinceramente que siga leyendo nuestros ultimos blogs.
Thank you Marisha for your comprehensive explaination of implied volatility. Great job, I hope to read more of your work.
Thank you so much for your kind words! Such appreciation is the motivation we writers need to provide more quality content. Stay tuned for more interesting topics, and if there is any specific topic you would like me to cover, please let me know. Always happy to dive into interesting topics with curious minds!
Options trading is one of the trickiest yet a prevalent trading segment in the I...

Introduction For the longest time, investment in stock markets was thought to b...

Every investor knows that the stepping stones to a good investment in thestock m...