
We have previously covered various financial statements and their analysis in our blog. Now, let us implement this understanding in a practical scenario. The next step in our fundamental analysis of financial statement series is understanding the profit and loss statement in detail with an example. Check out this blog, which extracts details from the profit and loss statement of a company, along with our practical example on understanding the balance sheet, to have a comprehensive understanding of the two financial statements.


Interpretation for Investors
Positive Signals -
Strong revenue growth
Continued expansion of operations.
Negative Signals -
Costs (materials, power, and employees) grew disproportionately.
High depreciation and interest show capital-intensive expansion.
Resulted in a net loss in 2024 despite higher sales.
Thus, Borosil Renewables Limited expanded its scale, but profitability declined due to higher operating and financing costs. Investors should watch if these costs stabilise or if the company can improve margins in the next year.
Ratio analysis of the profit and loss statement helps in understanding the profitability, operational efficiency and cost management trend of the company.

Interpretation for Investors
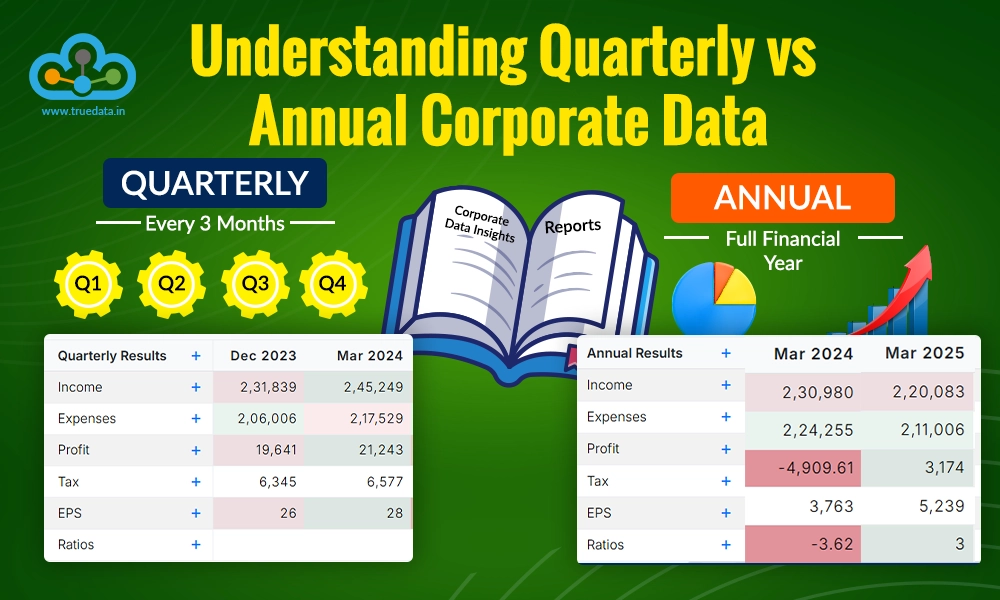
Strong Top-Line, Weak Bottom-Line - Revenue grew 53%, but profits fell due to a sharp 82% increase in expenses.
Cost inflation and Inefficiency - Power & fuel and employee expenses surged. Depreciation doubled, possibly due to new capacity expansion, but returns are not yet visible.
Financial Pressure - Interest tripled (Rs. 8 Cr to Rs. 29 Cr), implying higher debt, i.e., expansion financed through borrowings.
Margins Under Pressure - All profitability ratios fell sharply, and the company is operating on thin or negative margins.
Future Outlook - Expansion may pay off in the long term if capacity utilisation rises. Short-term liquidity and debt management will be key risks.
Borosil Renewables in FY2024 shows a classic case of expansion-phase strain. Revenues are up, but the profitability is down. This indicates the company is investing heavily for future growth, but bearing short-term financial pain. In short, it can be translated into a healthy top line but a hurting bottom line.

Profit and Loss Statement talks about the income and expenses for the period and the overall profitability of the organisation at the various levels. However, if you read the profit and loss statement with a keen eye, you can also spot potential red flags that can be a concern for various stakeholders. The potential red flag that can be seen in the above data and its interpretation is explained below.
Sharp Increase in Expenses Outpacing Revenue Growth - Costs are rising much faster than revenue, which can indicate cost inefficiency, poor control, or input price inflation. This can be especially worrying for a manufacturing company where profit margins are under pressure.
Sharp Jump in Power & Fuel Costs - A steep rise in energy costs (as % of revenue) implies either inefficient energy usage, higher input prices not passed to customers, or overcapacity / idle plant operation.
Explosion in Depreciation Expense - This increase can be concerning as it suggests heavy new capital investment or revaluation of assets. This is normally good for growth, but revenues have not scaled enough to justify this jump. Depreciation, being a non-cash expense, does not affect liquidity but reduces accounting profits sharply. This may also signal underutilised new capacity (invested but not yet producing output).
Rising Interest Expense and Leverage Risk - This increase indicates the company has taken on significant new debt. Further, the interest coverage ratio turns negative in 2024. Thus, operating profit no longer covers interest payments. This could point to liquidity risk or strain on cash flow.
Negative Profitability Despite Revenue Growth - The company turned from profitable to loss-making in one year. The significant boost in sales did not translate to profits, which can signal inefficiency or cost absorption issues.
EPS Turned Negative - The EPS of the company turned from a nominal Rs. 5 per share to negative in a span of a year, and the loss per share erodes shareholder value. This signals poor return on capital and potential stock price weakness if the trend continues.
Exceptional Item of Rs. 32 crores - The company has recorded a one-time gain of Rs. 32 crore, which reduced the reported loss. Without it, PBT would have been Rs. -86 Cr instead of Rs. -54 Cr. This means core operations performed worse than the reported headline loss. This can be a red flag if the company starts depending on such one-off items to offset recurring losses.
Inventory and Raw Material Pattern - FY23 had an inventory drawdown (negative figure), boosting profit. FY24 had an inventory buildup (positive figure), reducing profit. This may indicate slow-moving or unsold stock due to a demand slowdown or overproduction.
Overall, the company appears to be in a capital-intensive expansion phase, but cost overruns and financing burdens have turned profits into losses. Unless future capacity utilisation improves and costs stabilise, these trends could lead to liquidity strain or profit erosion in the coming years.

Borosil Renewables Limited (FY2024) shows a revenue growth story overshadowed by cost and leverage pressures. The core points indicating the overall analysis of the data are highlighted below.
Strong revenue growth - Sales increased sharply, showing steady demand for the company’s products.
Expansion shows confidence - Heavy investment in new plants reflects management’s belief in long-term market growth.
One-time income support - Exceptional income helped reduce losses in FY2024, giving short-term financial relief.
High operating costs - Rising expenses in power, materials, and staff have reduced profit margins.
Rising debt load - Increased borrowings have pushed up interest costs, putting pressure on profits.
High depreciation - Large new investments have increased fixed costs, limiting financial flexibility.
Inventory buildup - Unsold stock has tied up funds, possibly straining working capital.
Falling profitability - The company shifted from profit to loss, lowering shareholder returns and market confidence.

Borosil Renewables Limited’s FY2024 results show a company that is growing in size but struggling with profits. It is clearly in a phase of heavy investment and expansion, which has increased costs and financial pressure in the short term. However, if it can control expenses, manage its debt, and make better use of its new production capacity, the company can recover and improve its profitability in the coming years. For now, the focus should be on stabilising operations and improving efficiency to avoid long-term margin and liquidity problems.
A few strategic insights from the above data are explained below.
Focus on cost optimisation - The company needs to improve efficiency by cutting down on unnecessary costs. Areas like power consumption, material usage, and manpower productivity can be managed better so that profits can improve even if sales growth slows.
Stabilise new capacity - Since Borosil has expanded its manufacturing facilities, the next step can be to ensure that these plants are fully utilised. Higher utilisation will spread fixed costs over more units, improving margins and justifying the heavy investment made.
Debt management - To reduce financial risk, the company can control future borrowings. It can look for cheaper financing options, refinance high-interest loans, or use internal funds more effectively to manage debt levels.
Improve cash flow - The company could focus on generating cash from its main business operations rather than depending on one-time exceptional income. Better control over working capital, especially inventory and receivables, will help improve liquidity.
Long-term opportunity - If the company successfully manages costs and starts using its expanded capacity efficiently, profitability can improve over time. Once the initial phase of expansion is absorbed, Borosil Renewables has the potential to grow strongly in the long run.
The profit and loss statement is a vital part of a company’s financial reporting, showing how effectively it generates income, manages expenses, and creates profits over time. When read alongside the balance sheet, it helps investors and readers understand not just the company’s current financial position, but also its profitability, operational efficiency, and potential for sustained growth. Together, these statements offer a clearer picture of how well the company is performing today and how prepared it is for future expansion.
This article provides a practical insight into reading the profit and loss statement and the inferences that can be drawn from the same. Let us know your thoughts on the topic or if you need further information on the same, and we will address it.
Till then, Happy Reading!
Read More: Dividend Policy-What are the Different Types of Dividends?
Marisha Bhatt is a financial content writer @TrueData.
She writes with the sole aim of simplifying complex financial concepts and jargon while attempting to clarify technical and fundamental analysis concepts of the stock markets. The ultimate goal is to spread vital knowledge and benefit the maximum audience. Her Chartered Accountant background acts as the knowledge base to help clarify crucial concepts and create a sound investment portfolio.
I loved your posts about P and L . and it is very helpful
Thank you so much for your valuable feedback. Your support means a lot! We are delighted to know the P&L posts were helpful for you. Watch this space for more quality content on diverse topics!
Excellent topic mam
Thank you for appreciating our work! Stay tuned for more quality content on TrueData!
I like your blogs and efforts
Thank you so much for your encouraging words! Keep reading and engaging with TrueData for more informative and interesting content!
Good post
Thank you! Glad you found the post helpful.
Good Article
Thank you! Glad you found the article useful.
Thanks for sharing this post
You’re welcome! Thanks for taking the time to read the post, we appreciate it.

Thestock market never stands still, and prices swing constantly with every new h...
Corporate data is more than just the numbers of a company. They can show what is...
Investing is not just about numbers on a screen. It is about understanding the s...