Trading Strategies / Indicators

What is Volume Profile and How to Use it?

Marisha Bhatt · 26 Apr 2026 · 12 mins read · 32 Comments

what-is-volume-profile-and-how-to-use-it

Have you seen a stock rising for quite some time and then suddenly pausing or reversing at certain levels? It happens due to the simple demand and supply dynamics. Price and volume are two sides of the same coin when it comes to trading. While price tells ‘what’ is happening to a stock, volume gives answers to ‘why’ for the events. Thus, ignoring volume can be a fatal flaw in the trading plan. So, how to read a volume profile, and what does it say? Get answers to these questions and more in this blog, and refine your trading journey. 

What is Volume Profile?

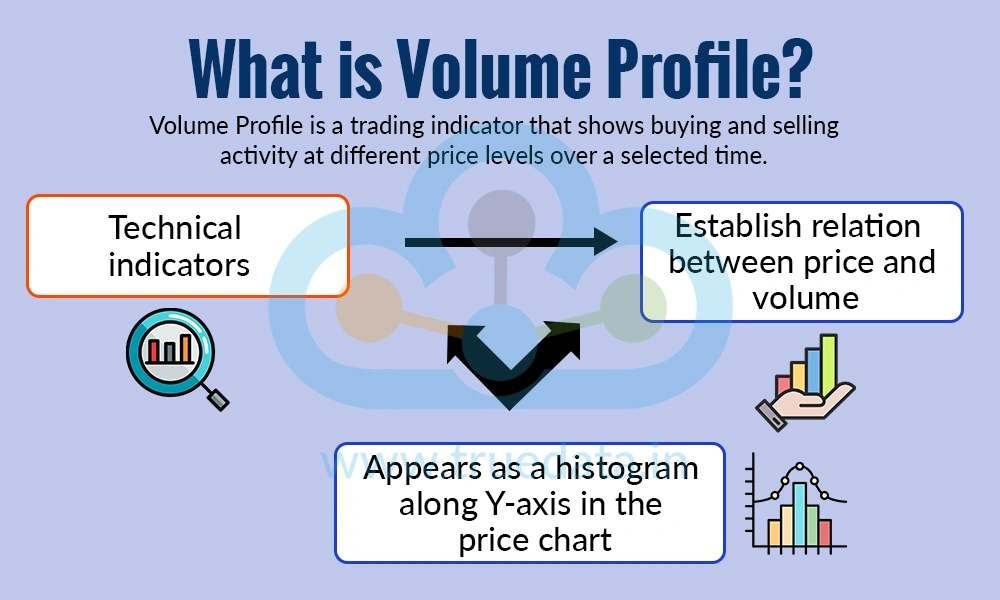
What is Volume Profile

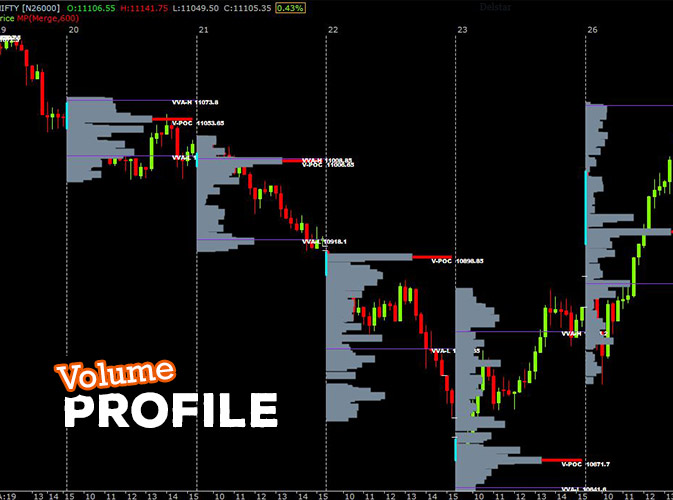
Volume Profile is a trading tool or indicator that highlights the levels of buying and selling at different price levels of a stock over a specific period of time. Volume profile displays this data sideways on the price axis, unlike normal volume bars that appear at the bottom of a chart and show total volume for each day or candle. This helps traders identify the price levels with the maximum trading activity. These levels often act as strong support or resistance, as many buyers and sellers are active there. Volume profile indicator helps investors find the optimum price level that buyers are willing to pay, and the sellers are willing to sell at, as well as the levels where prices are likely to react again. Thus, it can be a useful tool for identifying crucial price zones in stocks or indices like the Nifty or Sensex, thereby aiding in making better entry and exit decisions.

What are the Key Components of Volume Profile?

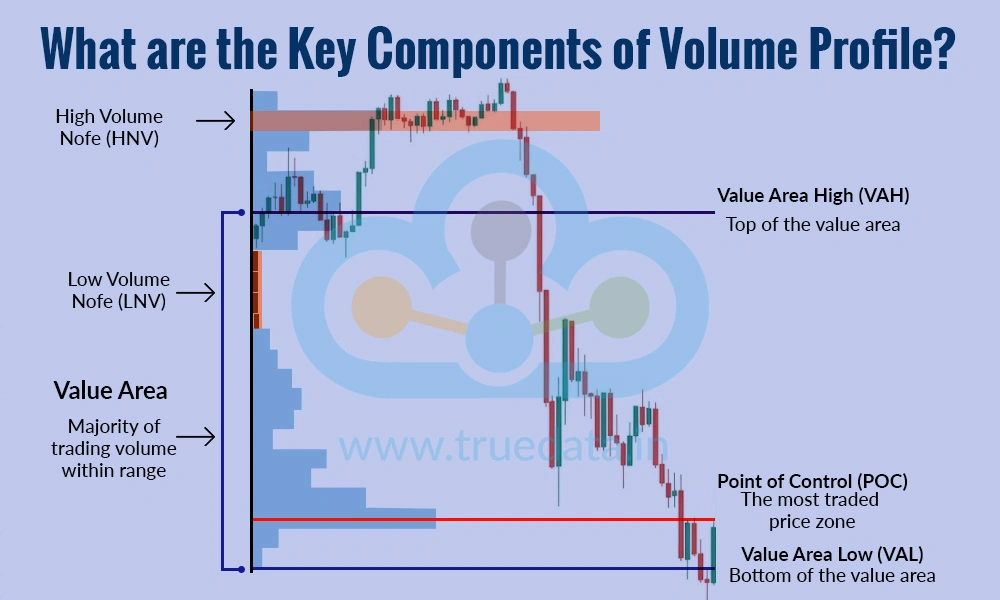
What are the Key Components of Volume Profile

The key components of the volume profile indicator include,

  • Point of Control (POC) - The Point of Control (POC) refers to the price level which records the highest amount of trading volume that has taken place during a given period. This implies that it indicates the optimum price level at which the buyers and sellers showed the most interest. This becomes an important level as it often acts as a strong support and resistance. Eventually, prices tend to return to the POC, as it represents a ‘fair value’ area where the market was most comfortable trading the stock or the commodity.

  • Value Area (VA) - The Value Area is the price range which records around 70% of the total trading volume that has occurred during the given period of time. Thus, it shows the price range in which the majority of market participants agreed on the price. When the price stays within this range, the market is considered balanced. However, if the price moves outside the value area, it may indicate a potential breakout or new trend.

  • Value Area High (VAH) - Value Area High (VAH) represents the upper boundary of the value area (VA), i.e., it indicates the highest price within the 70% volume range. This level often acts as resistance, hence, the prices may struggle to move above it unless there is strong buying interest.

  • Value Area Low (VAL) - Value Area Low (VAL) is at the opposite end of the Value Area High (VAH), i,e., the lower boundary of the value area and represents the lowest price within the 70% volume range. While the VAH acts as the resistance, the VAL often acts as support, where prices may find buying interest and bounce back.

  • High Volume Nodes (HVNs) - Another important component of the volume profile indicator is the High Volume Nodes (HVNs). These are the price levels where a large amount of trading activity has taken place, and the volume profile seems thick or wide. Such levels indicate strong interest from both buyers and sellers, and prices tend to spend more time around these zones. HVNs often act as support or resistance and are seen as areas of fair value.

  • Low Volume Nodes (LVNs) - Similar to the HVNs, the Low Volume Nodes (LVNs) represent the price levels with little trading activity. They appear as thin areas in the volume profile, and prices tend to move quickly through these zones due to less interest from traders. LVNs often act as areas of quick movement or breakouts.

  • Volume Profile Shape (Distribution) - The overall shape of the volume profile gives clues about market behaviour. For example, a bell-shaped profile indicates a balanced market, while a skewed or uneven shape may suggest trending conditions or strong buying/selling pressure. Understanding the shape helps investors judge whether the market is stable or likely to move sharply.

Why is Volume Profile Important?

Volume profile indicator is one of the primary technical analysis tools used by traders. The importance of this indicator can be explained below.

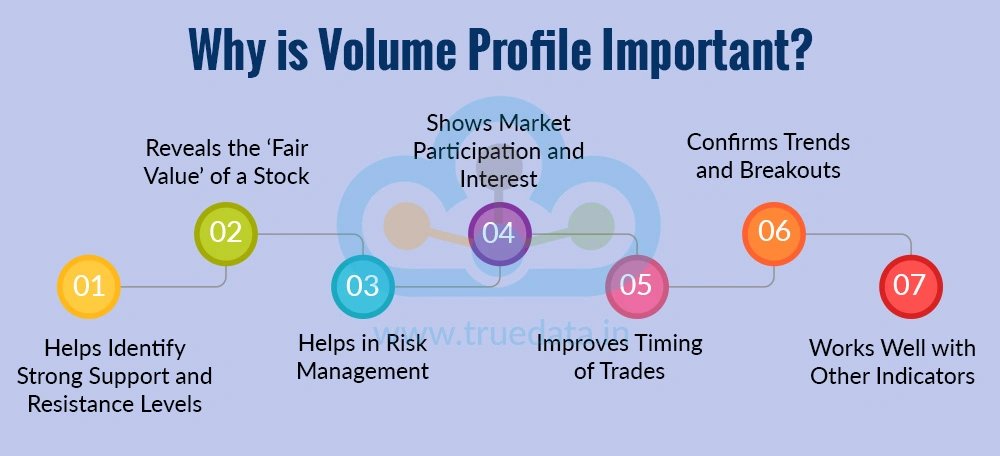
Why is Volume Profile Important

  • Helps Identify Strong Support and Resistance Levels - Volume Profile shows where the highest trading activity has taken place, which helps identify strong support and resistance levels. Prices often react at these levels because many traders have already bought or sold there. This can be useful in stocks or indices like Nifty and Sensex to plan better entry and exit points.

  • Reveals the ‘Fair Value’ of a Stock - The levels where the most volume is concentrated (like the Point of Control) indicate where the market believes the stock is fairly valued. When prices move far away from this area, they often tend to come back. This helps investors understand whether a stock is overvalued or undervalued in the short term.

  • Helps in Risk Management - By identifying important price zones like support, resistance, and low-volume gaps, traders can place better stop-loss and target levels. This improves risk management and helps protect capital, which is especially important in volatile markets.

  • Shows Market Participation and Interest - Volume Profile clearly shows where buyers and sellers are most active. High-volume areas indicate strong interest, while low-volume areas show less interest. This helps investors understand market behaviour better instead of relying only on price movements.

  • Improves Timing of Trades - Volume Profile helps in better timing of trades by showing where price is likely to slow down, reverse, or break out. For example, if the price approaches a high-volume area, it may pause or reverse. On the other hand, if it moves through a low-volume area, it may move quickly. This helps traders avoid poor entry points.

  • Confirms Trends and Breakouts - When price breaks out of a key level along with strong volume at new price zones, it signals strength in the trend. Volume Profile helps confirm whether a breakout is genuine or weak. This reduces the chances of getting trapped in false breakouts, which is a common problem for many traders.

  • Works Well with Other Indicators - Volume Profile does not need to be used alone. It works very well with other tools like price action, trendlines, and moving averages. Combining it with other methods gives a more complete view of the market and improves decision-making.

How Does Volume Profile Work?

The volume profile indicator helps process the price and volume movement of the market and enables traders to make informed portfolio decisions. The use of the volume profile is explained below.

How Does Volume Profile Work

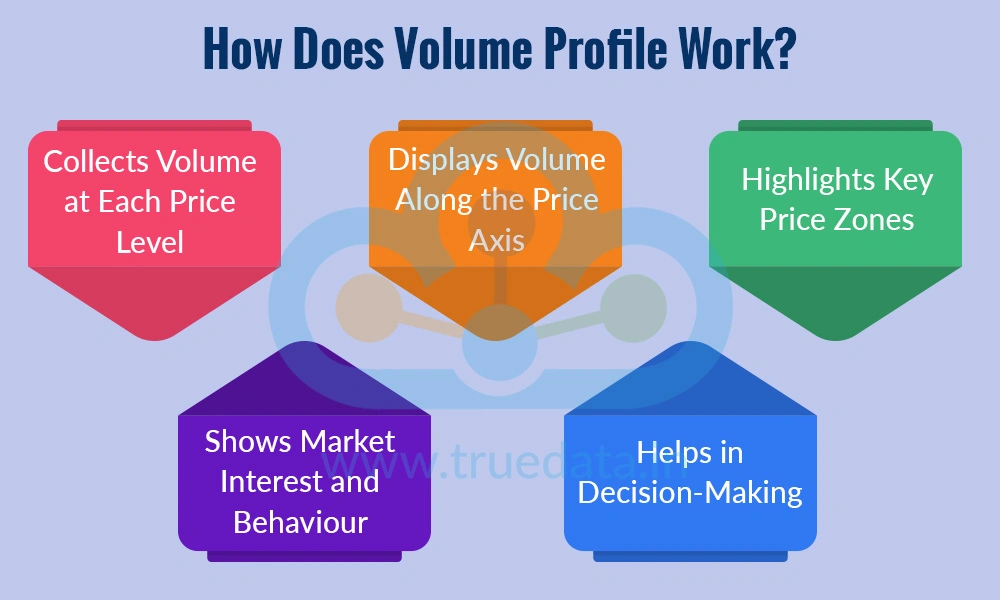
  • Collects Volume at Each Price Level - Volume Profile works by collecting data on how much trading has happened at different price levels over a selected time period. Instead of just showing total volume for the day, it breaks it down price by price. This helps traders understand where most buying and selling activity takes place.

  • Displays Volume Along the Price Axis - Unlike traditional charts, where volume is shown at the bottom, Volume Profile displays it sideways on the price axis. This creates a clear visual of which price levels have high or low trading activity, making it easier for traders to spot important zones.

  • Highlights Key Price Zones - The tool identifies important levels such as the Point of Control (where the most volume occurred) and the Value Area (where most trading happened). These levels act as key reference points for traders to identify support, resistance, and fair value zones.

  • Shows Market Interest and Behaviour - High-volume areas indicate strong interest from buyers and sellers, so prices often slow down or reverse near these levels. On the other hand, low-volume areas show less interest, so prices tend to move quickly through them. This helps traders understand how the market is behaving.

  • Helps in Decision-Making - By analysing these volume-based levels, traders can make better decisions about when to enter or exit trades. It also helps them plan stop-loss and target levels more effectively, improving overall trading discipline.

What are the Common Types of Volume Profiles?

There are multiple types of volume profiles that help traders understand the market movement effectively. These types include,

What are the Common Types of Volume Profiles

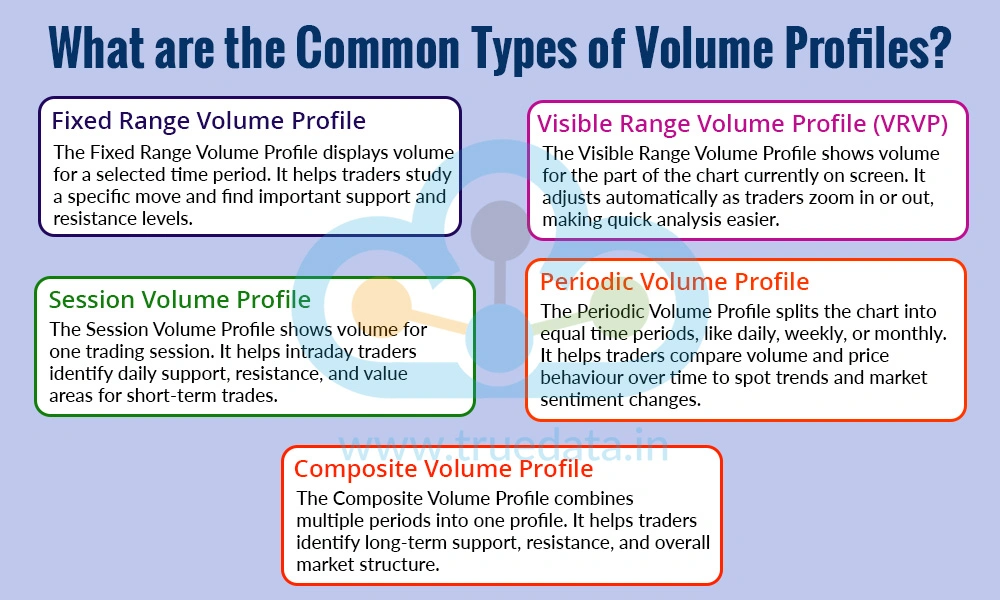
  • Fixed Range Volume Profile - The Fixed Range Volume Profile shows volume data for a specific period chosen by the trader, such as a few days, weeks, or a particular price move. This type is used by traders to analyse a particular trend or event, like a rally or a correction. It helps them understand where the most trading activity happened within that selected range and identify key support and resistance levels.

  • Visible Range Volume Profile (VRVP) - The Visible Range Volume Profile displays volume based on what is currently visible on the chart screen. As traders zoom in or out, the volume profile automatically adjusts. This makes it very useful for quick analysis, as traders can instantly see important volume levels for the current view without selecting a fixed time period.

  • Session Volume Profile - The Session Volume Profile shows volume distribution for a single trading session, such as one trading day. It is commonly used by intraday traders who want to understand daily market behaviour. Analysing each session helps traders identify daily support, resistance, and value areas to plan short-term trades.

  • Periodic Volume Profile - The Periodic Volume Profile divides the chart into equal time periods, such as daily, weekly, or monthly profiles. Each period has its own volume distribution. Traders use this to compare how volume and price behaviour change over time, helping them spot trends and shifts in market sentiment across different timeframes.

  • Composite Volume Profile - The Composite Volume Profile combines multiple sessions or periods into one larger profile. It gives a broader view of where the most trading activity has occurred over a longer duration. Traders use this type to identify long-term support and resistance zones and understand the overall market structure.

How to Identify Bullish, Bearish or Balanced Market Using the Volume Profile?

Volume Profile helps traders understand who is in control, i.e., buyers, sellers, or neither. Observing the shift of price and volume together can help traders identify market conditions and adjust their trading strategy accordingly.

Identifying a Bullish Market (P-Shape)

Identifying a Bullish Market (P-Shape)

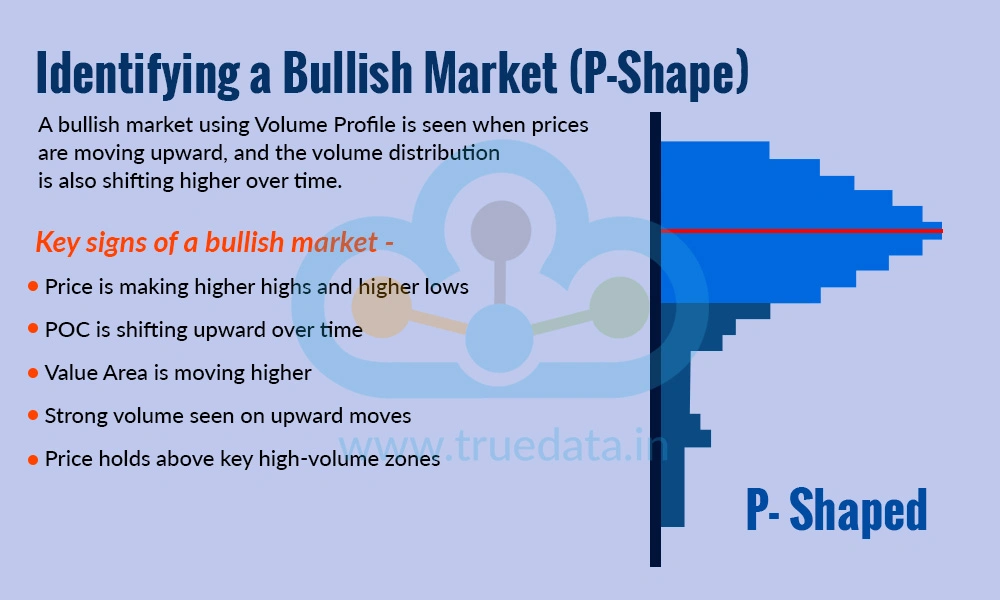
A bullish market using Volume Profile is seen when prices are moving upward, and the volume distribution is also shifting higher over time. This means buyers are willing to pay higher prices, indicating strength in the trend. The Point of Control (POC) and Value Area also tend to move upward, indicating that the stock's fair value is increasing. Traders observe that in such conditions, price often finds support near the Value Area Low (VAL) or previous high-volume zones and continues moving higher. Furthermore, breakouts above the Value Area High (VAH) with strong volume can confirm bullish strength.

Key signs of a bullish market - 

  • Price is making higher highs and higher lows

  • POC is shifting upward over time

  • Value Area is moving higher

  • Strong volume seen on upward moves

  • Price holds above key high-volume zones

Identifying a Bearish Market (b-Shape)

Identifying a Bearish Market (b-Shape)

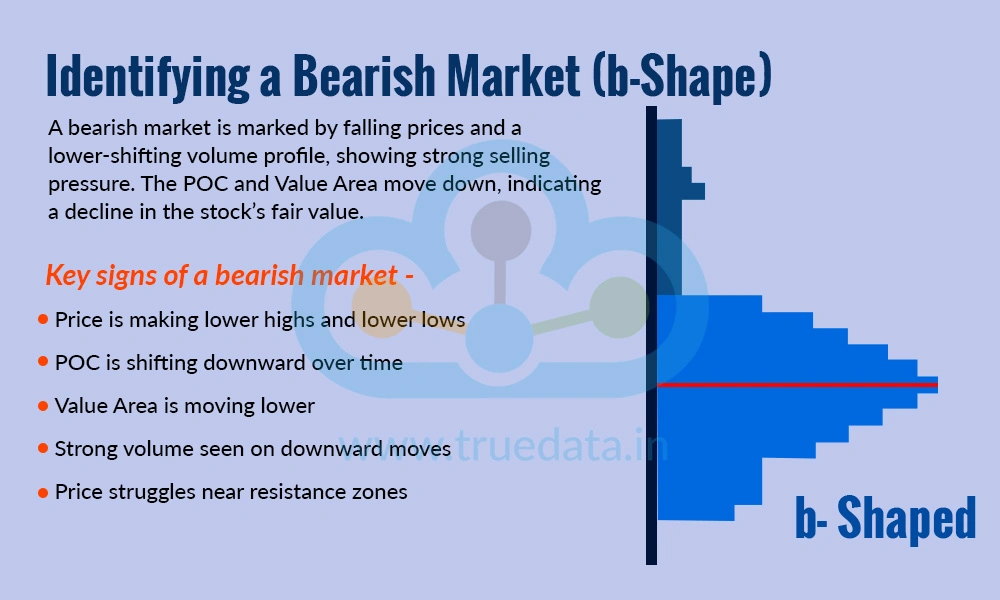
A bearish market is identified when prices are consistently moving downward, and the volume profile shifts lower. This shows that sellers are in control and are willing to sell at lower prices. The POC and Value Area move downward, indicating a drop in the perceived stock’s fair value. Traders notice that prices often encounter resistance near the Value Area High (VAH) or previous high-volume zones and then continue to fall. Breakdowns below Value Area Low (VAL) with strong volume confirm bearish momentum.

Key signs of a bearish market - 

  • Price is making lower highs and lower lows

  • POC is shifting downward over time

  • Value Area is moving lower

  • Strong volume seen on downward moves

  • Price struggles near resistance zones

Identifying a Balanced Market (D-Shape)

Identifying a Balanced Market (D-Shape)

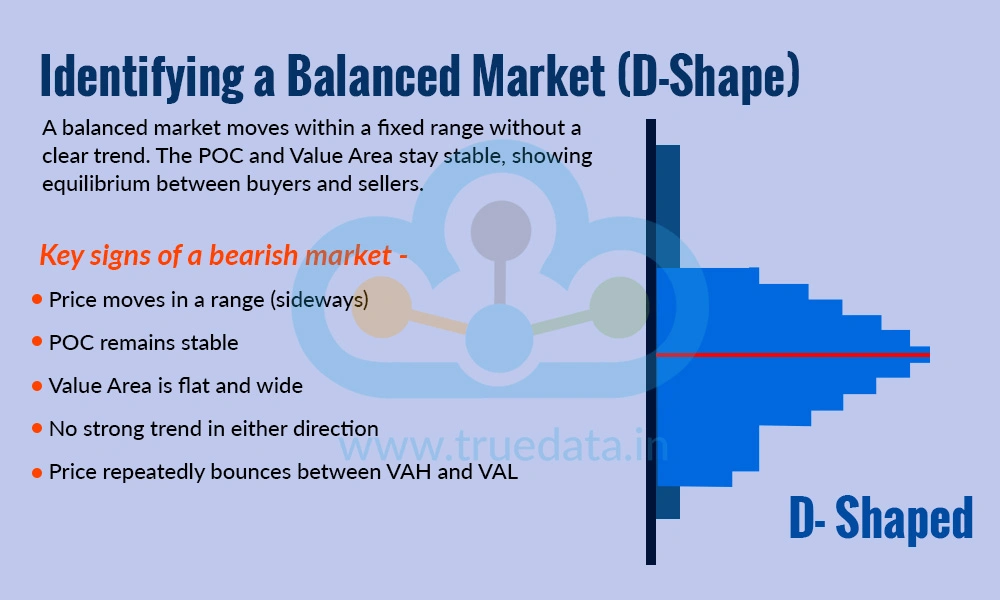
A balanced market is seen when prices move within a range but do not show a clear upward or downward trend. This appears as a bell-shaped volume profile with a wide distribution, where most of the trading happens within a fixed range. The POC stays relatively stable, and the Value Area does not shift much. Traders understand that in such markets, buyers and sellers are in equilibrium. Prices tend to move between support (VAL) and resistance (VAH), and breakouts are less reliable unless supported by strong volume.

Key signs of a balanced market - 

  • Price moves in a range (sideways)

  • POC remains stable

  • Value Area is flat and wide

  • No strong trend in either direction

  • Price repeatedly bounces between VAH and VAL

What are the Limitations of Volume Profile?

What are the Limitations of Volume Profile

Similar to any other technical analysis tool, the volume profile indicator is not foolproof and comes with a few limitations. These limitations include,

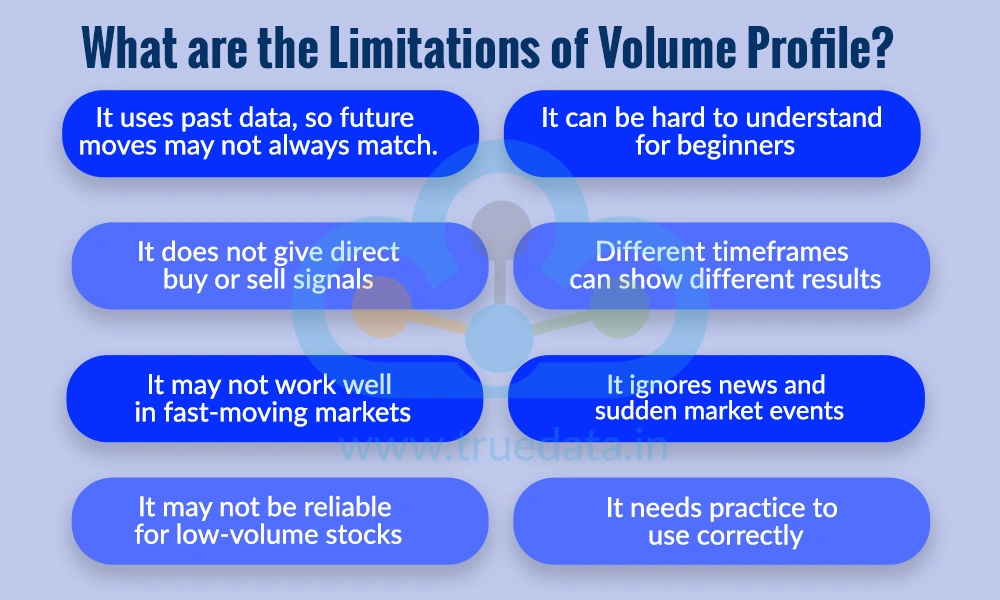
  • It is based on past data, so it may not always predict future moves

  • It can be hard to understand for beginners

  • It does not give direct buy or sell signals

  • Different timeframes can show different results

  • It may not work well in fast-moving markets

  • It ignores news and sudden market events

  • It may not be reliable for low-volume stocks

  • It needs practice to use correctly

Conclusion

Volume Profile is a powerful tool that helps traders understand where the most trading activity has taken place and identify important price levels like support, resistance, and fair value. It not only shows what the price is doing but also explains why it is happening by highlighting the behaviour of buyers and sellers. However, since it is based on past data and does not give direct signals, it works best when combined with other tools and with proper practice.

This article explains a critical concept in trading and how to use it to build a successful portfolio. Let us know your thoughts on the topic or if you need further information on the same, and we will address it soon. 

Till then, Happy Reading! 


Read More: Best Momentum Indicators for Strategic Trading

Frequently Asked Questions

Volume Profile can be used on different timeframes like intraday (minutes or hours), daily, weekly, or even monthly charts. Traders can choose the timeframe based on their trading style, whether short-term trading or long-term analysis.

In Volume Profile, ‘value’ means the price range where most trading has happened and both buyers and sellers agree on the price. It is usually shown as the Value Area, which covers around 70 of total trading volume.

Volume Profile shows how much trading happened at each price level, helping traders see key support and resistance zones. VWAP (Volume Weighted Average Price) shows the average price traded during the day, helping traders understand the overall price trend.

Volume Profile can be used in different markets like stocks, futures, options, commodities, and even cryptocurrencies. Traders can apply it to any market where reliable volume data is available.

A high-volume node shows a price level where a lot of trading has happened, indicating a strong interest from buyers and sellers. It often acts as a support or resistance level where the price may pause or reverse.
Marisha Bhatt

Marisha Bhatt is a financial content writer @TrueData.

She writes with the sole aim of simplifying complex financial concepts and jargon while attempting to clarify technical and fundamental analysis concepts of the stock markets. The ultimate goal is to spread vital knowledge and benefit the maximum audience. Her Chartered Accountant background acts as the knowledge base to help clarify crucial concepts and create a sound investment portfolio.

32 Comments
D
Divya Kumar
· April 27, 2026

This is a very well-explained guide on Volume Profile. The breakdown of POC, VAH, and VAL makes it easy for beginners to understand how price reacts at key levels.

·
Marisha Bhatt Author
Divya Kumar · April 30, 2026

Thank you! Glad the breakdown of POC, VAH, and VAL made it easier to understand. These levels really help traders spot key price areas and make better decisions.

·
D
Dhana
· April 27, 2026

Great article! Volume Profile is often overlooked, but as you explained, it plays a crucial role in identifying strong support and resistance zones.

·
Marisha Bhatt Author
Dhana · April 30, 2026

Thank you! You are absolutely right. Volume Profile can reveal strong support and resistance zones, helping traders make more confident and informed decisions.

·
B
Bawiz
· April 27, 2026

Really insightful content. The way you explained value areas and trading activity at different price levels adds clarity for traders at all levels.

·
Marisha Bhatt Author
Bawiz · April 30, 2026

Thank you, glad our post could add clarity to the concept and help traders read the market and plan their trades efficiently. Stay tuned for more insightful content on TrueData!

·
D
Dan Shiv
· April 27, 2026

This guide simplifies a complex concept nicely. Understanding where most trading happens really helps in making better entry and exit decisions.

·
Marisha Bhatt Author
Dan Shiv · April 30, 2026

Thank you, we are glad we could simplify this complex content and help traders make better entry and exit decisions. Watch this space for more insightful content on TrueData!

·
M
Mohan
· April 27, 2026

I like how the blog highlights Point of Control as a key level. In my experience, POC often acts as a magnet for price, especially during consolidation phases.

·
Marisha Bhatt Author
Mohan · April 30, 2026

Thank you for sharing your experience! You are absolutely right! POC often acts like a magnet for price, especially in sideways markets, making it a very useful level for traders to watch.

·
H
Hariharan
· April 27, 2026

The explanation of high-volume and low-volume nodes is very useful. Prices tend to move quickly through low-volume areas and slow down near high-volume zones, which aligns with real trading behavior.

·
Marisha Bhatt Author
Hariharan · April 30, 2026

Thank you! That is a great observation. Low-volume areas often see quick price moves, while high-volume zones act as strong support or resistance, helping traders plan better entries and exits. Watch this space for more informative content on TrueData!

·
N
Nowsib
· April 27, 2026

Combining Volume Profile with price action or indicators like moving averages can significantly improve trade accuracy. Nice mention of that!

·
Marisha Bhatt Author
Nowsib · April 30, 2026

Thank you! Absolutely, combining Volume Profile with price action or moving averages can give stronger signals and help traders make more accurate decisions.

·
M
Mohith
· April 27, 2026

Thanks for Sharing in Diigo. I love this blog and the section on different types of Volume Profiles (Fixed Range, Visible Range, Session) is particularly helpful for traders using multiple timeframes.

·
Marisha Bhatt Author
Mohith · April 30, 2026

Thank you for your kind words! Glad you found the different Volume Profile types useful. Using them across timeframes can really help traders get a clearer view of market structure and make better decisions.

·
P
Prabhas
· April 27, 2026

This blog really helps in understanding how to use volume profile for support and resistance.

·
Marisha Bhatt Author
Prabhas · April 30, 2026

Thank you, we are glad you found the post helpful. Using Volume Profile to spot support and resistance can make it easier to identify key price levels and trade with more confidence.

·
N
Nalin Yadav
· April 27, 2026

One of the best explanations of volume profile trading strategy I’ve read.

·
Marisha Bhatt Author
Nalin Yadav · April 30, 2026

Thank you for your encouraging feedback! Keep reading and sharing your thoughts on our other topic too. We are looking forward to hearing more from you!

·
M
Mounik J
· April 27, 2026

Very useful guide on the volume profile indicator. The explanation of POC and value area makes it easier to apply in real trading.

·
Marisha Bhatt Author
Mounik J · April 30, 2026

Thank you! Glad the explanation of POC and value area helped. These levels can make it much easier to apply Volume Profile in real trading decisions.

·
R
Rahul K
· April 27, 2026

This article clearly explains how to use volume profile in trading, especially for identifying key price levels and market structure.

·
Marisha Bhatt Author
Rahul K · April 30, 2026

Thank you! Glad you found it helpful. Understanding key price levels and market structure through Volume Profile can help evaluate market movements and really improve trading decisions.

·
B
Bhargav
· April 27, 2026

Helpful content for anyone learning volume profile strategy for intraday trading. Looking forward to more such detailed guides.

·
Marisha Bhatt Author
Bhargav · April 30, 2026

Thank you! Glad you found it useful for intraday trading. We will keep sharing more simple and detailed guides to help you trade better. Stay tuned!

·
S
Sai Sanjay
· April 27, 2026

Can Volume Profile be effectively used for intraday trading on Nifty and Bank Nifty?

·
Marisha Bhatt Author
Sai Sanjay · April 30, 2026

Yes, Volume Profile can be very effective for intraday trading in Nifty and Bank Nifty, as it helps identify key support and resistance levels based on real trading activity. Using it with price action can further improve trade decisions. We hope this resolves your query. Stay tuned for more insightful content on TrueData!

·
H
Hardik
· April 27, 2026

One key takeaway is that volume reveals the “fair value” of price, not just movement. That’s something many traders ignore while focusing only on price action.

·
Marisha Bhatt Author
Hardik · April 30, 2026

Absolutely true, volume helps identify where the market sees fair value, not just how price moves. Thus, combining this with price action can give traders a much clearer and more reliable view.

·
T
Thilak Pandey
· April 27, 2026

Volume Profile truly gives a deeper understanding of market structure compared to traditional volume indicators. This article explains that difference well.

·
Marisha Bhatt Author
Thilak Pandey · April 30, 2026

Thank you! Glad you found it useful. Volume Profile does offer a deeper view of market structure, helping traders understand where real buying and selling interest lies. Stay tuned for more insightful content on TrueData!

·