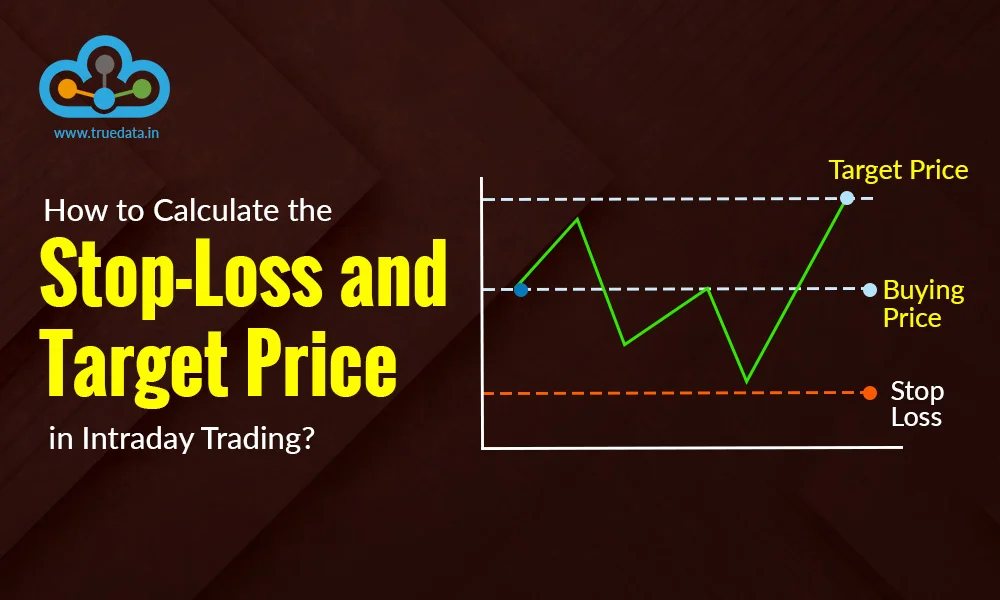
Did you know the number of intraday traders in India increased by over 300% from 15 lakh in FY 19 to 69 lakh in FY 23? This increase reflects the growing participation of retail traders in stock markets, especially in intraday trading. However, intraday trading is easier said than done, as most of these participants end up in losses without proper knowledge and risk management. The key pillars of intraday trading are stop loss and target price. Check out this blog to know the meaning of these terms and how to use them in intraday trading for a profitable portfolio.
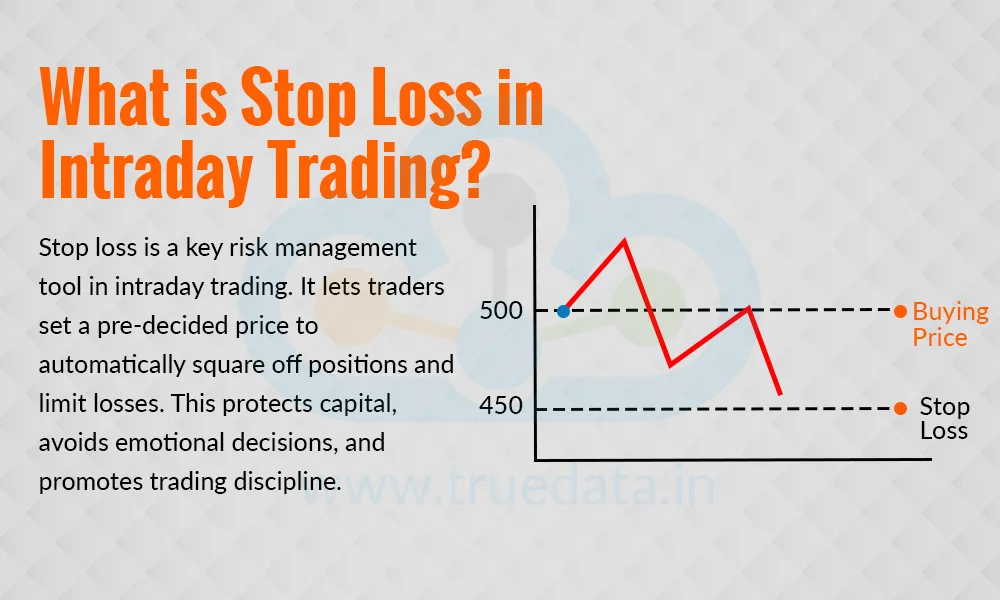
Stop loss is an important risk management tool in intraday trading. It helps traders control their losses in the stock markets if the market moves in the opposite direction. Stop loss requires traders to set a pre-decided price at which the trading platform will automatically square off the position to prevent further loss. For example, if a trader buys a stock at Rs. 500 and places a stop loss at Rs. 495, the system will automatically sell the stock when the price drops to Rs. 495, protecting the trader from bigger losses if the price keeps falling. Similarly, in a short trade, if the price rises above the stop loss level, the position will be closed. Since intraday trading involves fast price movements and high volatility, stop loss is very useful in protecting capital, reducing emotional decision-making, and ensuring that a trader follows discipline while trading.
The ability to understand and implement a stop-loss is often the key element that differentiates a successful portfolio from a loss-making one. Therefore, along with learning its meaning, here is a quick guide to understand the different ways that it can be calculated.
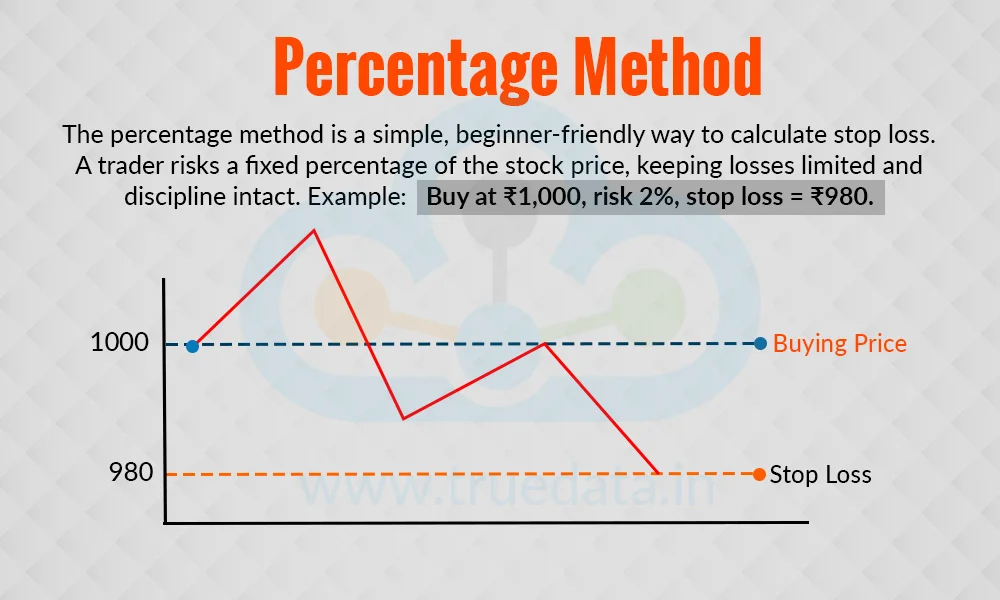
This is the most common and beginner-friendly way to calculate stop loss. In this method, a trader decides what percentage of the stock’s price they are willing to risk. For example, if a trader buys a stock at Rs. 1,000 and decides to risk 2%, the stop loss will be Rs. 980 (because 2% of 1,000 is 20). This means the maximum loss on this trade will be Rs. 20 per share. If the trader bought 100 shares, the maximum total loss will be Rs. 2,000. The percentage method is simple to apply and helps a trader trade with discipline because the loss limit is fixed from the beginning.
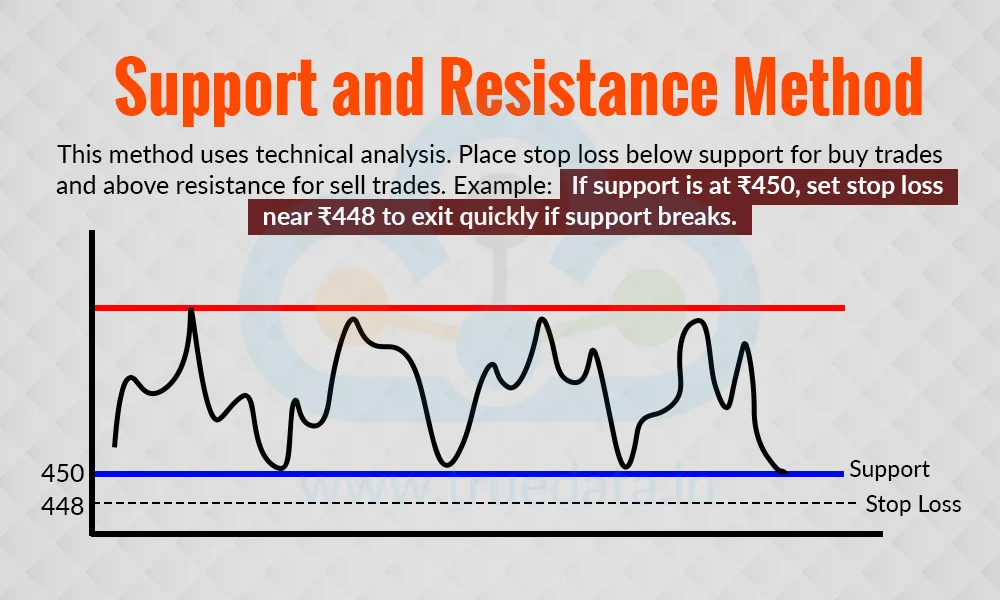
This method uses technical analysis to find stop loss levels. A support level is the price point where a stock usually stops falling because many buyers enter at that price. Similarly, a resistance level is the price at which a stock usually stops rising because many sellers start selling there. If a trader takes a buy position, the stop loss should be placed just below the support level. If the trade is a sell position, the stop loss should be placed just above the resistance level. For example, if a stock is trading at Rs. 460 and has strong support at Rs. 450, a trader may set the stop loss at Rs. 448. This ensures that if the support breaks, the trader exits quickly to avoid bigger losses.
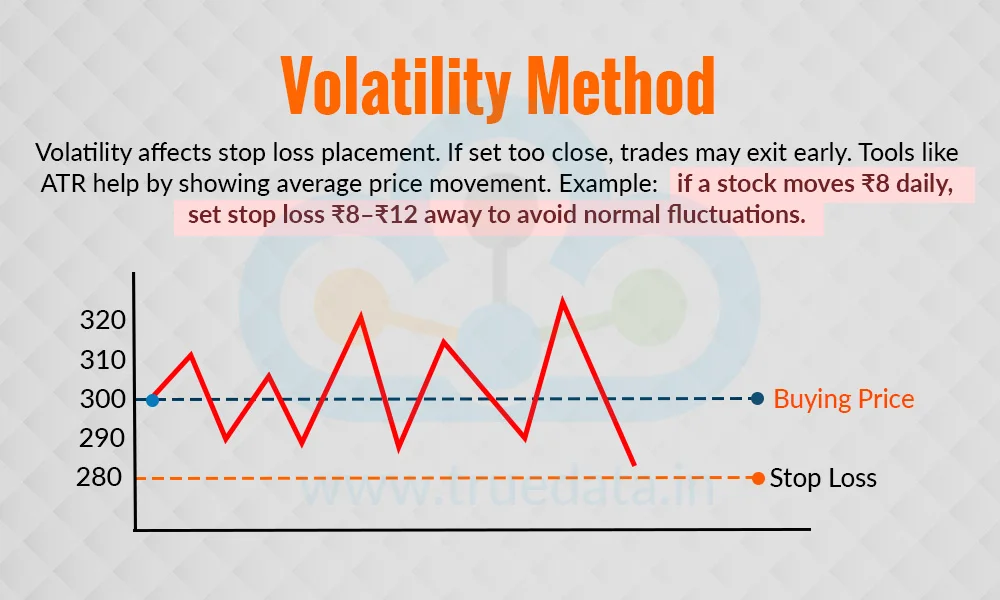
Every stock moves up and down during the day, but some stocks move more than others. This natural movement is called volatility. If a trader keeps the stop loss too close, the trade may exit too early because of normal price fluctuations. To avoid this, traders use tools like the Average True Range (ATR), which shows the average price movement of a stock over a given time. For example, if a stock usually moves Rs. 8 per day, a trader might set the stop loss at least Rs. 8-12 away from the entry price. This way, the stop loss only triggers if the move is bigger than normal, showing that the trade idea may not be working. This method is especially useful for highly volatile stocks like those in the banking or IT sectors.
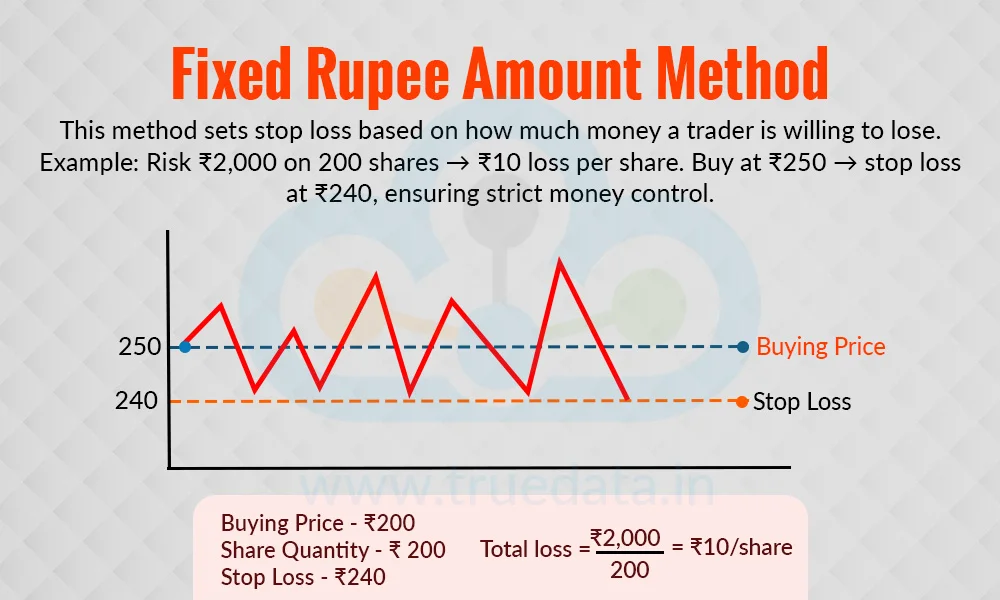
This method focuses on the amount of money a trader is ready to lose, instead of a percentage or technical level. For example, a trader may decide not to lose more than Rs. 2,000 on a trade. If they are trading 200 shares, that means the maximum loss per share should be Rs. 10 (Rs. 2,000 ÷ 200). So, if the stock is bought at Rs. 250, the stop loss will be at Rs. 240. This method is very practical for traders who want strict control over their money, as it allows them to set clear financial limits before entering any trade.
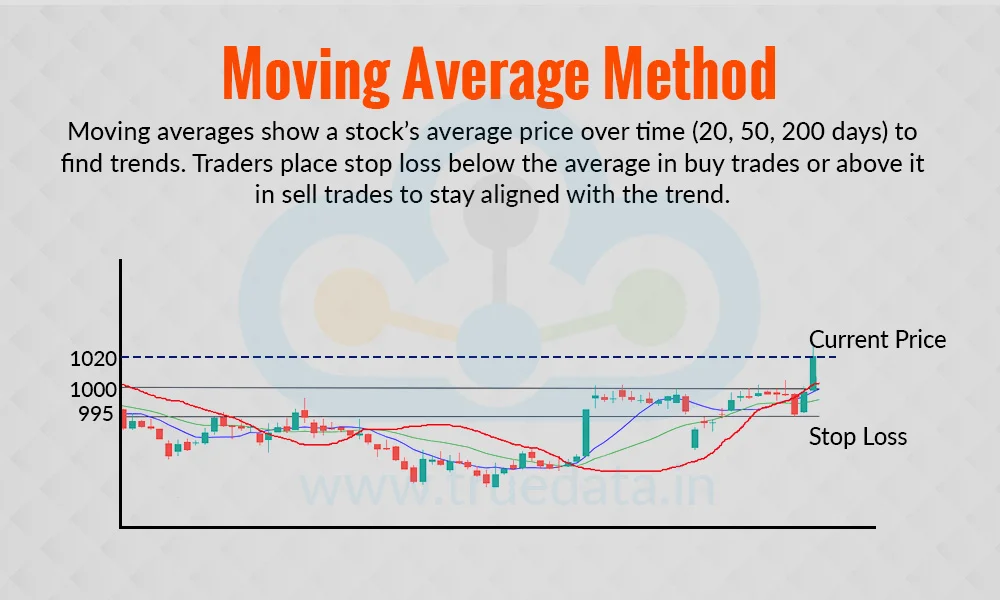
Moving averages are indicators that show the average price of a stock over a certain period, such as 20 days, 50 days, or 200 days. Many traders use these averages to find the overall trend of the stock. If a stock is trading above its moving average, the trend is usually upward, and if it is below, the trend is usually downward. Traders can place their stop loss just below the moving average in a buy trade, or just above the moving average in a sell trade. For example, if a stock is trading at Rs. 1,020 and the 20-day moving average is at Rs. 1,000, the trader may set the stop loss at Rs. 995. This way, the stop loss is aligned with the trend and helps the trader avoid exiting too early.
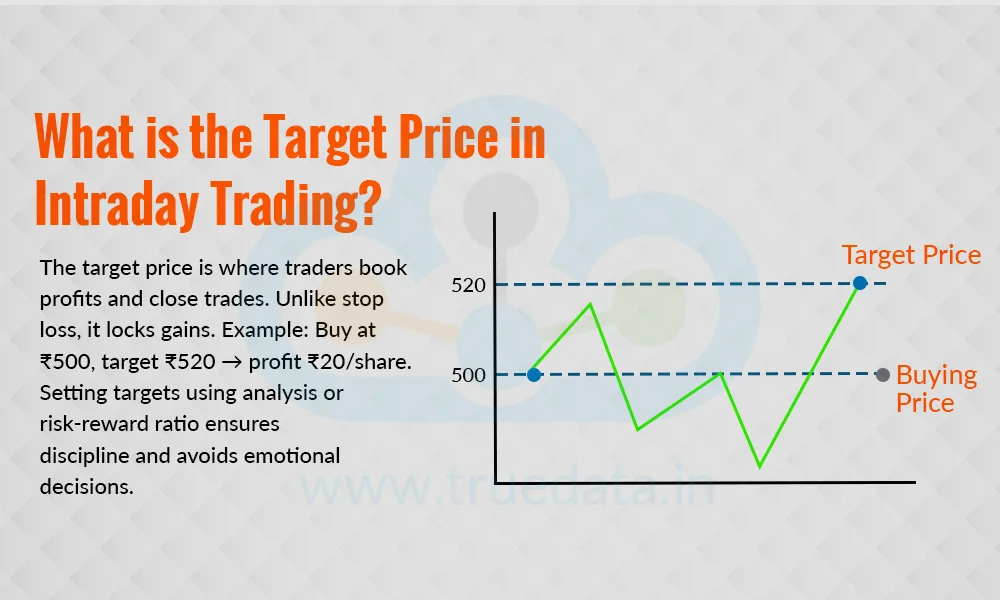
The target price is the price level at which the trader decides to book a profit in intraday trading and close the trade. It is the opposite of stop loss, while stop loss limits the potential losses from a trade, the target price helps to lock in the profits on a trade. For example, if a stock is bought at Rs. 500 and the target price is set at Rs. 520, the position will close at Rs. 520, giving a profit of Rs. 20 per share. Traders usually set their target price based on technical analysis, support and resistance levels, chart patterns, or by using a risk-to-reward ratio. Fixing a target price is important as it helps traders avoid emotional decisions like exiting too early out of fear or holding too long out of greed. Thus, traders can protect their profits by deciding the target in advance and following a discipline, thereby improving their chances of earning consistently from intraday trading.
Similar to the stop loss calculation, the target price can also be calculated in many ways. These popular methods to calculate the target price are explained below.
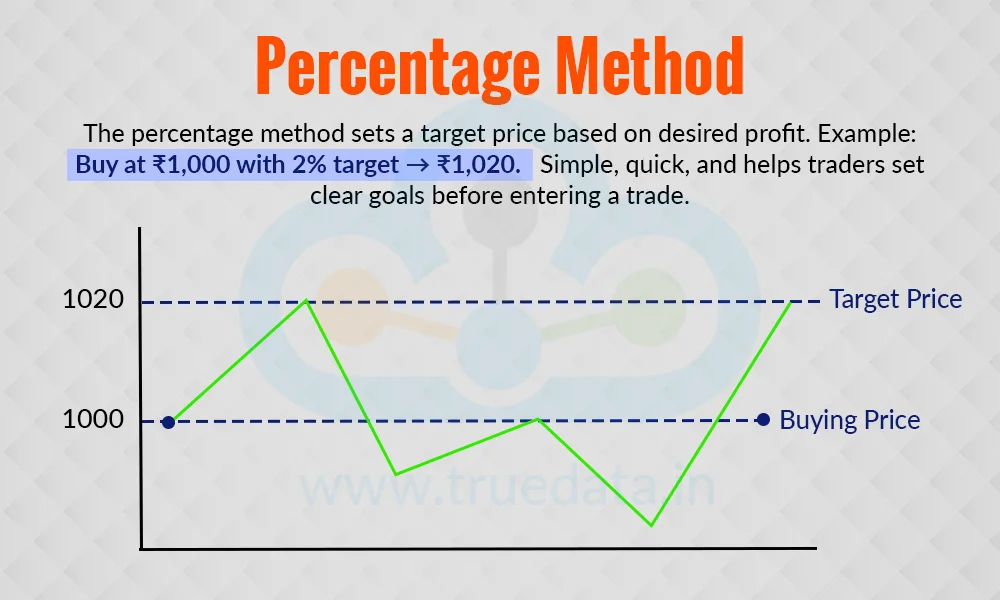
This is one of the easiest ways to calculate a target price. In this method, a trader decides in advance what percentage of profit they want to make from a trade. For example, if a stock is bought at Rs. 1,000 and the trader expects a 2% return, the target price will be Rs. 1,020. Similarly, in a sell trade at Rs. 1,000, a 2% target would mean Rs. 980. The percentage can vary depending on the stock’s movement and the trader’s risk appetite. Many intraday traders prefer this method because it is simple, quick, and gives a clear goal before entering the trade.
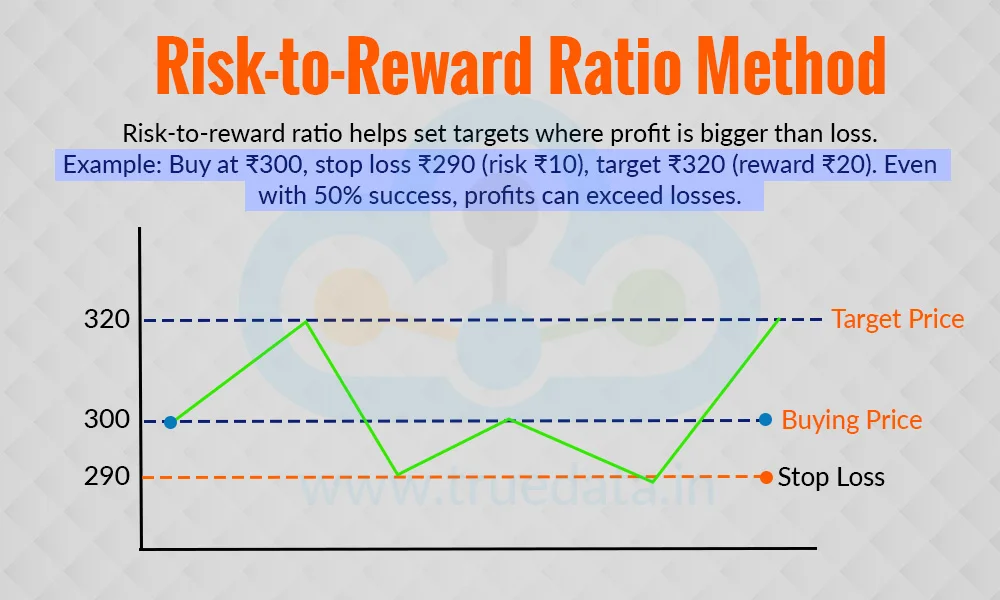
Many disciplined traders use a risk-to-reward ratio to set their target price. The idea is quite simple, i.e., the potential profit should be larger than the potential loss. A common ratio is 1:2, meaning if the stop loss is Rs. 10 away from the entry price, the target price should be Rs. 20 away. For example, if a trader buys a stock at Rs. 300 with a stop loss at Rs. 290 (risk of Rs. 10), the target will be set at Rs. 320 (reward of Rs. 20). This method ensures that even if only half the trades are successful, the profits are still higher than the losses over time.
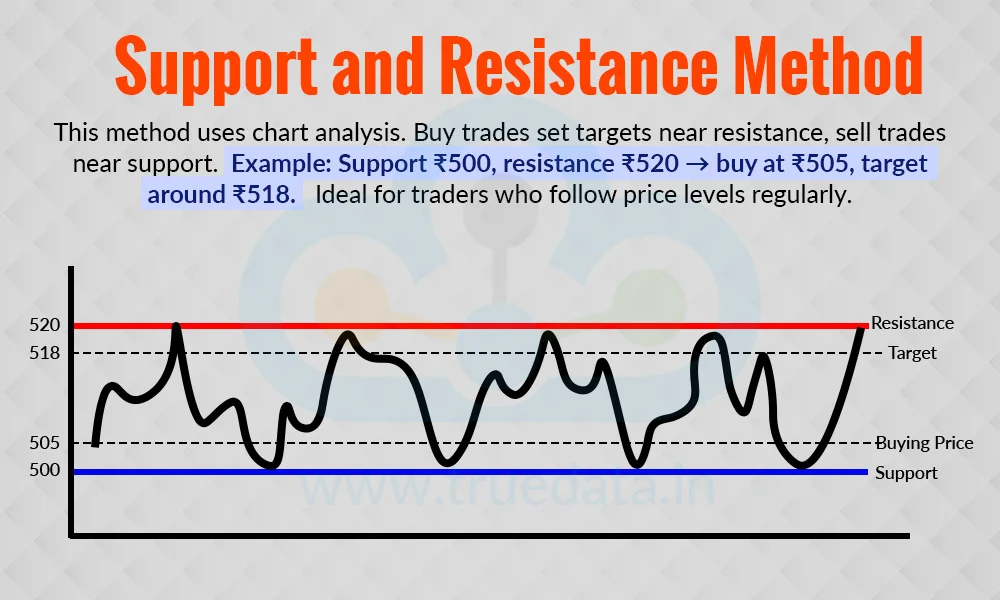
This method is based on technical analysis of price charts. A support level is where the stock price usually stops falling, while a resistance level is where it usually stops rising. If a trader buys a stock near the support level, the target price is often set close to the resistance level. For example, if a stock has support at Rs. 500 and resistance at Rs. 520, a trader buying at Rs. 505 may set the target around Rs. 518. Similarly, in a sell trade, the target is often set near the support level. This method works well for traders who consistently follow chart patterns and price levels.
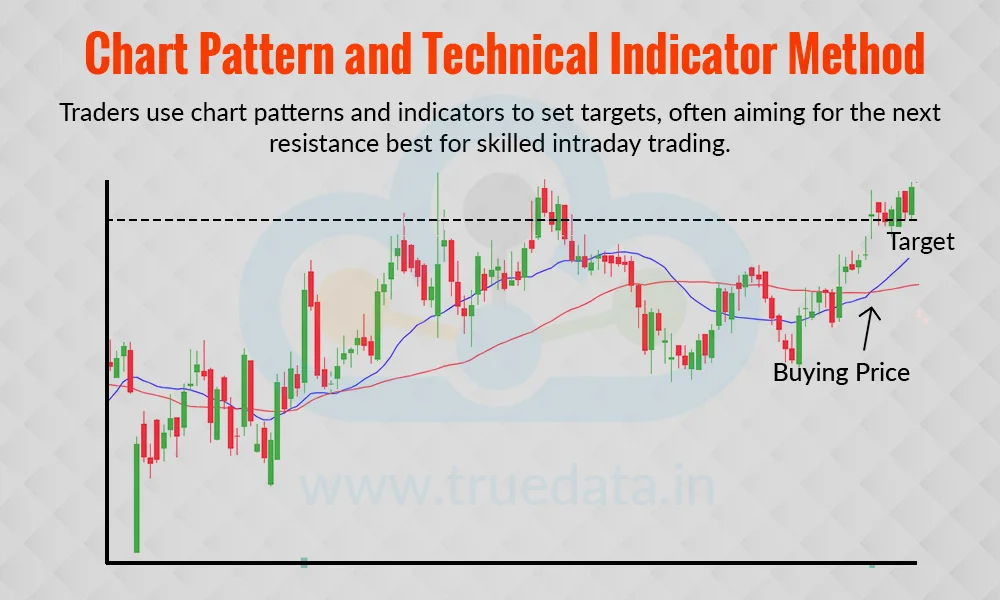
Some traders use chart patterns like triangles, flags, or head and shoulders, as well as technical indicators like moving averages or Bollinger Bands, to calculate target prices. For example, if a stock crosses above a moving average, traders may set the target at the next resistance level or the upper Bollinger Band. This method requires more chart-reading skills but is very effective for active intraday traders.
The concept of stop loss and target price is essential for intraday trading to have a robust trading portfolio. We have discussed the meaning and ways to calculate these important parameters above. Let us now understand the calculation and application of stop loss and target price with a simple example.
Consider Trader A, who buys 100 shares of XYZ Ltd. for Rs. 300 in intraday trading and decides the stop loss (maximum loss that can be handled) to be not more than Rs. 10 per share and target price (profit level expected) to be as per a 1:2 risk-reward ratio.
Calculating Stop Loss -
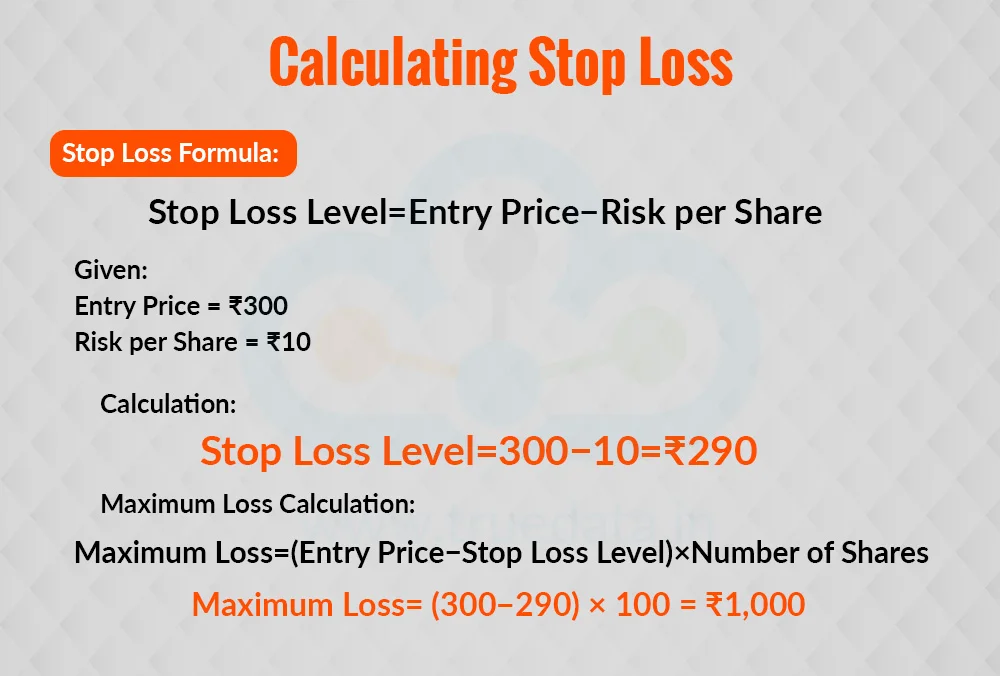
The stop loss is set at Rs. 10 per share. Thus, the stop loss will be calculated as,
Stop loss level = Rs. 300-Rs. 10 = Rs. 290
Thus, if the price falls to Rs. 290, the shares will be sold automatically, and the maximum loss will be Rs. 1,000 (10 * 100 shares).
Calculation of Target Price -
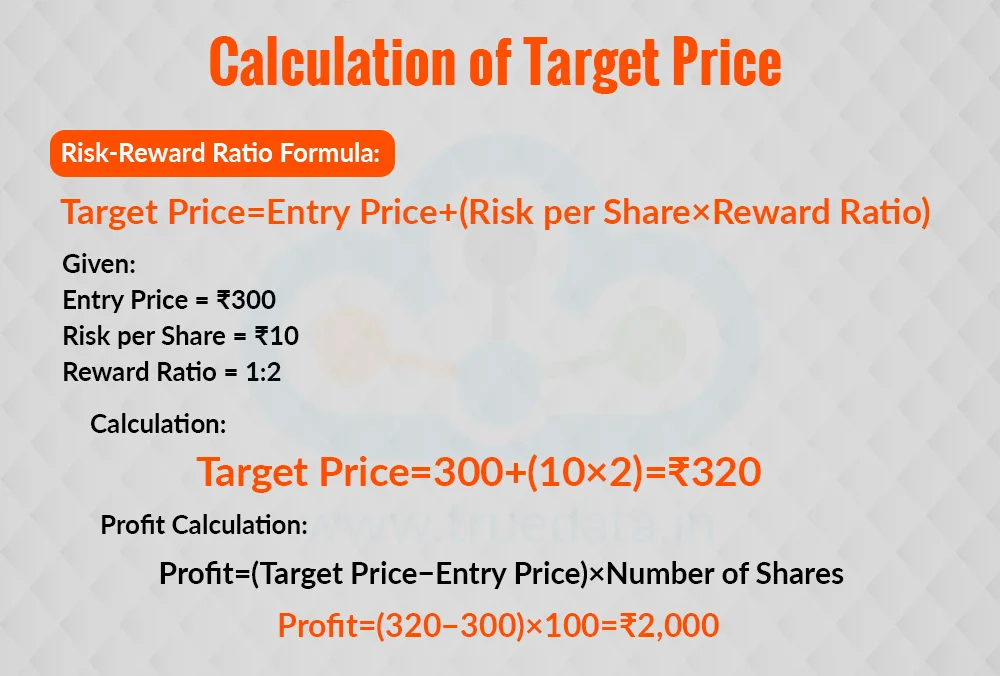
The target price is set at a 1:2 risk-reward ratio. The risk per share is Rs. 10 (maximum loss), hence, the target profit is Rs. 20 per share (twice the risk).
Thus, the target price will be Rs 320 (Rs. 300+Rs. 20 per share). If the price rises to Rs. 320, the shares will be automatically sold, giving a profit of Rs. 2,000 (20 * 100 shares).
The calculation of stop loss and target price helps traders dive into intraday trading with a clear plan, thereby controlling the overall risk and trading with discipline.
Stop loss and target price are two essential tools that help traders trade with discipline and protect their capital. They are essential tools for risk management and help lock in profits before the trend reverses. With the help of these tools, traders can determine both exit points in advance and thereby avoid emotional decisions, handle market volatility better, and improve their chances of earning consistent profits in intraday trading.
This article talks about the essentials of successful intraday trading to help make informed trading decisions. Let us know your thoughts on the topic or if you need further information on the same, and we will address it soon.
Till then, Happy Reading!
Read More: Engulfing Candlestick Patterns
Introduction It is often said that technical analysis in stock is the bread and...
Trading is the art of buying and selling securities to make a profitable trading...
NSE Stock Prices in Excel in Real Time - Microsoft Excel is a super software cap...