Trading Strategies / Indicators

On Balance Volume Indicator

Marisha Bhatt · 14 Jul 2026 · 10 mins read · 0 Comments

on-balance-volume-indicator

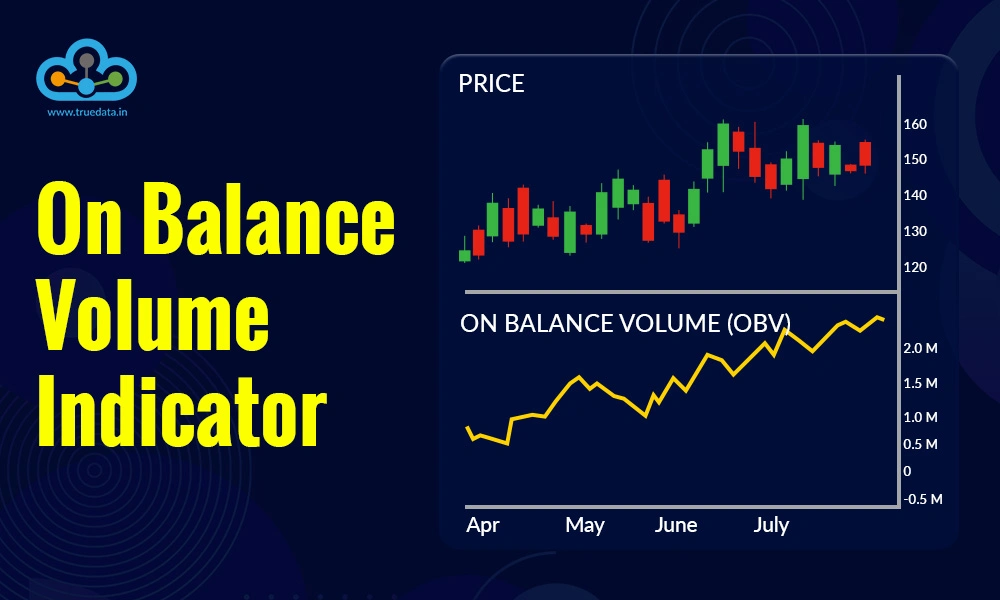
Successful trading is not just about tracking price movements but also about understanding the volume behind those moves. Price and volume work together to reveal the strength of a market trend, making it crucial for traders to use a range of technical indicators to analyse it. One such popular indicator in this category is the On-Balance Volume (OBV) indicator. Dive into this blog, where we will explore the On-Balance Volume indicator, how it works, and how traders use it to make more informed trading decisions.

What is the On-Balance Volume Indicator?

What is the On-Balance Volume Indicator

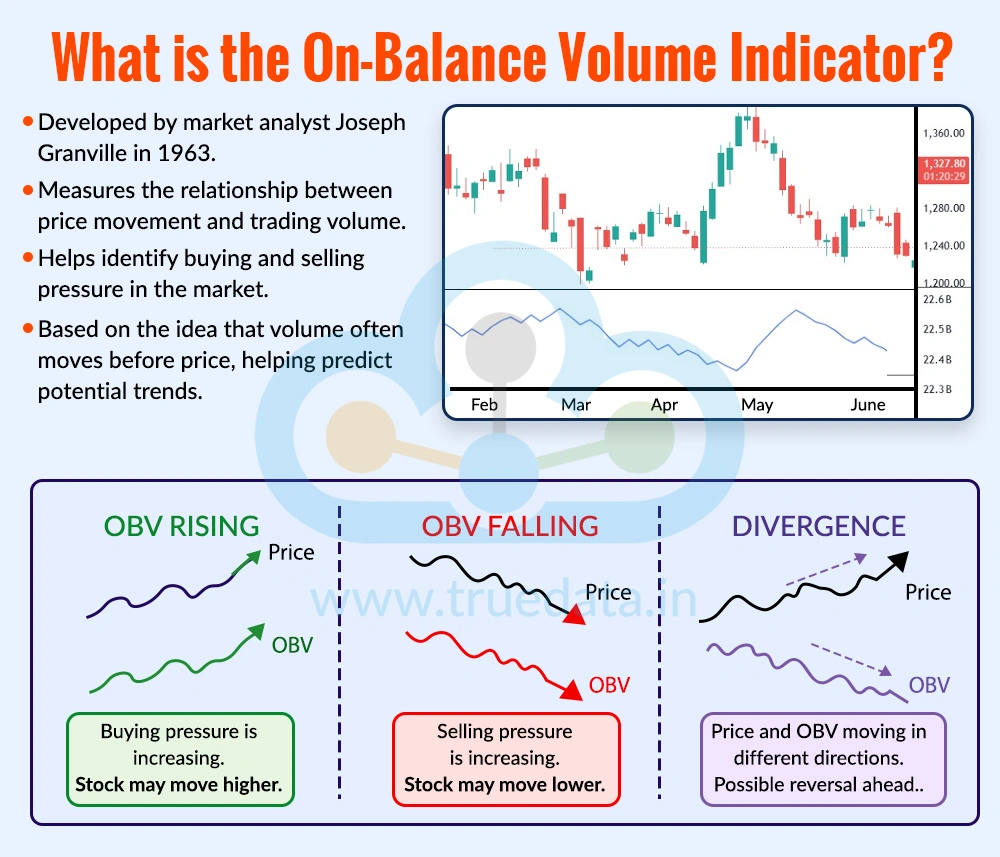
The On-Balance Volume (OBV) Indicator is a popular technical analysis tool that helps traders understand the relationship between price movements and trading volume. It was developed by market analyst and author Joseph Granville and introduced in his 1963 book, Granville's New Key to Stock Market Profits. Granville believed that trading volume often moves before stock prices, making it an important clue for identifying future market trends. 

The OBV indicator adds a stock's volume on days when the price closes higher and subtracts the volume on days when the price closes lower. This creates a running total that shows whether money is flowing into or out of a stock. If the OBV line is rising, it suggests buying pressure is increasing, and the stock may move higher. If the OBV line is falling, it indicates selling pressure and potential weakness in the stock. Traders commonly use OBV to confirm trends, spot possible reversals, and identify situations where volume and price are moving differently, which can provide early signals for trading decisions.

How to Calculate the OBV Indicator?

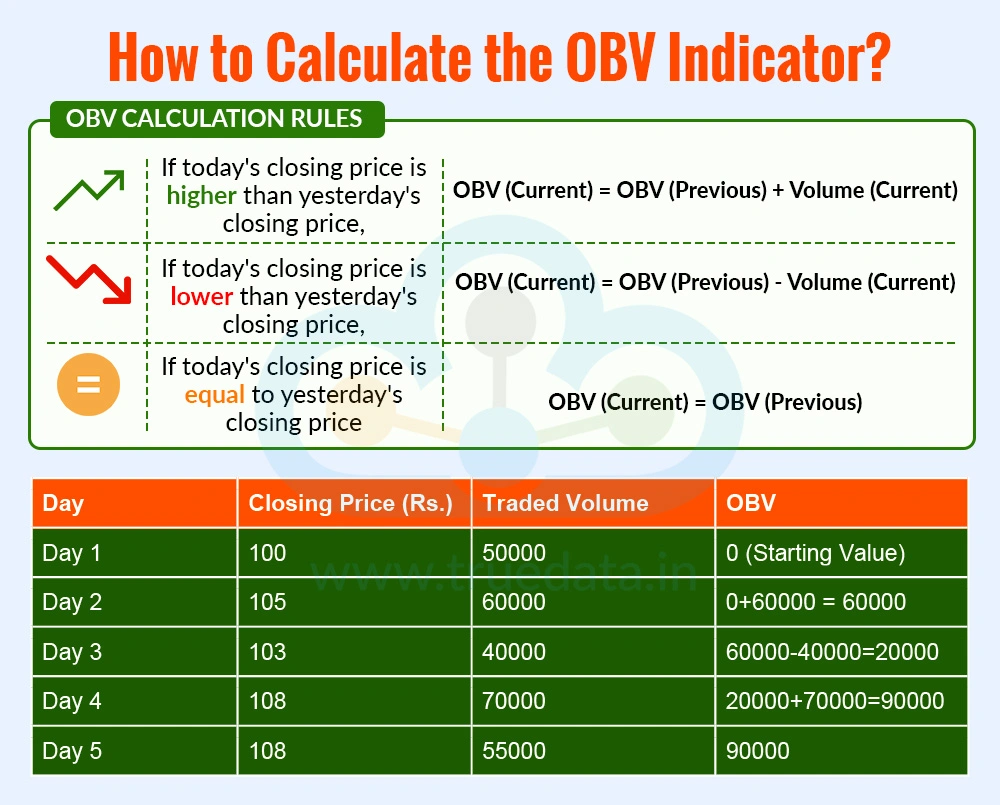
The On-Balance Volume (OBV) Indicator measures buying and selling pressure by combining price movement and trading volume. The basic idea in calculating OBV is quite simple. When a stock closes higher than the previous day's closing price, the day's volume is added to the OBV value. When the stock closes lower, the day's volume is subtracted. If the closing price remains unchanged, the OBV value stays the same. The resulting values are then joined together to form the OBV line, which is plotted on a chart below the stock's price chart. Traders use this line to identify whether volume is supporting the current price trend.

The OBV is calculated using the following rules.

  • If today's closing price is higher than yesterday's closing price,

    • OBV (Current) = OBV (Previous) + Volume (Current)

  • If today's closing price is lower than yesterday's closing price,

    • OBV (Current) = OBV (Previous) - Volume (Current)

  • If today's closing price is equal to yesterday's closing price,

    • OBV (Current) = OBV (Previous)

Understanding the Calculation of OBV Using an Example

How to Calculate the OBV Indicator

Day

Closing Price (Rs.)

Traded Volume

OBV

Day 1

100

50000

0 (Starting Value)

Day 2

105

60000

0+60000 = 60000

Day 3

103

40000

60000-40000=20000

Day 4

108

70000

20000+70000=90000

Day 5

108

55000

90000

Once the OBV value is calculated for each trading session, the values are plotted on a chart and connected to form the OBV line. The horizontal axis (X-axis) represents time, while the vertical axis (Y-axis) represents the cumulative OBV values. Traders do not focus on the absolute OBV number; instead, they watch the direction of the OBV line.

In the above example, the OBV line would move as follows,

  • Day 1 - 0

  • Day 2 - 60,000

  • Day 3 - 20,000

  • Day 4 - 90,000

  • Day 5 - 90,000

As these points are connected, the OBV line rises from Day 1 to Day 2, falls on Day 3, rises sharply on Day 4, and remains flat on Day 5. A rising OBV line generally indicates increasing buying pressure, while a falling OBV line suggests increasing selling pressure. Traders often compare the movement of the OBV line with the stock price chart to confirm trends, identify divergences, and spot potential trend reversals before they become visible in price alone. 

It is important to note that the actual OBV value itself is less important than the trend of the OBV line. A steadily rising OBV line may signal accumulation by market participants, whereas a declining OBV line can indicate distribution and weakening market sentiment.

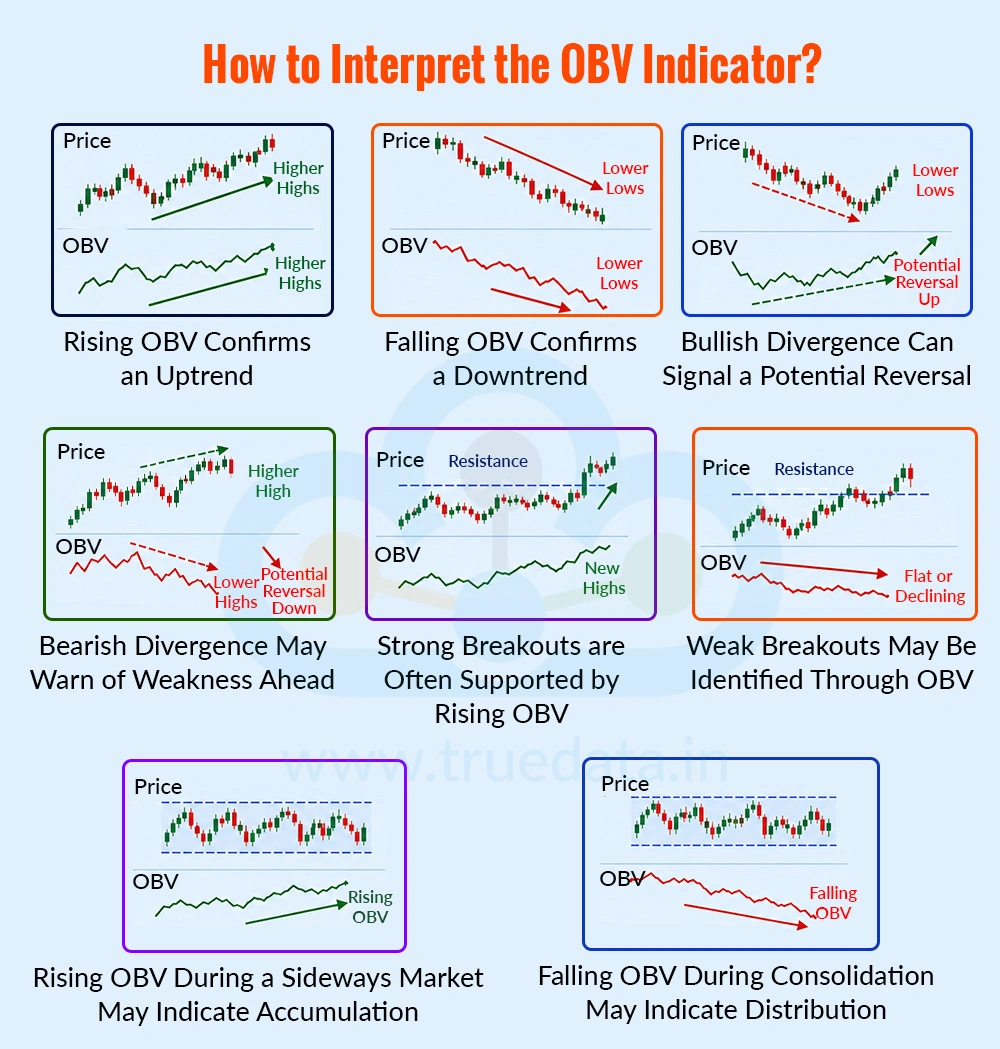
How to Interpret the OBV Indicator?

How to Interpret the OBV Indicator

The On-Balance Volume (OBV) indicator helps traders understand whether buying or selling pressure is supporting a stock's price movement. Here are some common ways to interpret it.

  • Rising OBV Confirms an Uptrend - When both the stock price and the OBV line are moving higher, it suggests that buying activity is increasing alongside the price rise. This indicates that traders and investors are actively participating in the uptrend, making the move more reliable. A rising OBV during an uptrend generally signals strong market sentiment and increases the likelihood of the trend continuing.

  • Falling OBV Confirms a Downtrend - If the stock price is declining and the OBV line is also trending downward, it indicates that selling pressure is increasing. More volume is occurring on down days than on up days, showing that market participants are exiting their positions. This alignment between price and volume confirms the weakness in the stock and suggests that the downtrend may persist.

  • Bullish Divergence Can Signal a Potential Reversal - Divergences between the OBV line and stock price can provide valuable trading signals. A bullish divergence occurs when a stock continues to make lower lows, but the OBV line starts making higher lows. This suggests that despite the falling price, buying volume is gradually increasing. Such a situation may indicate that informed investors or institutions are accumulating shares, potentially leading to a reversal from a downtrend to an uptrend.

  • Bearish Divergence May Warn of Weakness Ahead - A bearish divergence occurs when the stock price reaches higher highs, but the OBV line fails to do so and instead forms lower highs. This indicates that the price is rising without strong volume support. The lack of buying participation can be a warning sign that the uptrend is losing momentum and that a correction or reversal may be approaching.

  • Strong Breakouts are Often Supported by Rising OBV - When a stock breaks above an important resistance level, and the OBV line simultaneously moves to new highs, it suggests that the breakout is supported by strong buying interest. Higher volume reflects greater conviction among market participants, making the breakout more likely to sustain itself and develop into a larger upward move.

  • Weak Breakouts May Be Identified Through OBV - Sometimes a stock price moves above a resistance level, but the OBV line remains flat or declines. This indicates that the breakout is not attracting sufficient buying volume. Such price moves may be driven by short-term speculation rather than genuine demand and can often result in a false breakout, where the price quickly falls back below the resistance level.

  • Rising OBV During a Sideways Market May Indicate Accumulation - If a stock is trading within a narrow range while the OBV line gradually rises, it may suggest that investors are quietly accumulating shares. Since OBV captures buying volume, a rising OBV during a consolidation phase can indicate growing demand beneath the surface. This often precedes a breakout and a new upward trend.

  • Falling OBV During Consolidation May Indicate Distribution - A stock's price may sometimes appear stable, but if the OBV line continues to decline, it could indicate distribution. In this scenario, larger investors may be gradually selling their holdings without causing a significant price decline. As selling pressure builds, the stock may eventually break down and enter a downtrend.

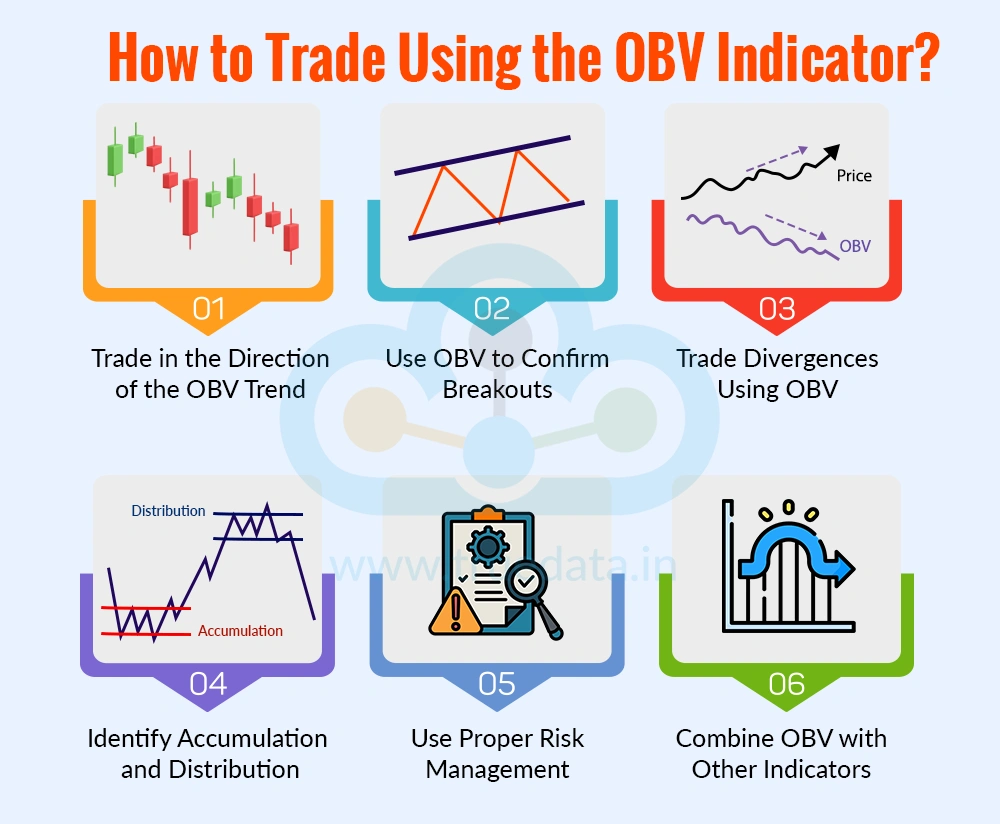
How to Trade Using the OBV Indicator?

How to Trade Using the OBV Indicator

Using the OBV indicator for creating a successful trading portfolio requires a deep understanding of the indicator and its nuances. The steps to trade using this indicator are explained below. 

  • Trade in the Direction of the OBV Trend - If both the stock price and the OBV line are moving higher, traders may look for buying opportunities. If both are falling, it may indicate a bearish trend and potential selling opportunities.

  • Use OBV to Confirm Breakouts - When a stock breaks above an important resistance level, traders should check whether the OBV line is also rising or making new highs. A rising OBV adds confidence that the breakout is supported by strong buying volume.

  • Trade Divergences Using OBV - Traders often use OBV divergences to identify potential trend reversals. A bullish divergence occurs when the stock price makes lower lows, but the OBV line makes higher lows, indicating that buying pressure is increasing despite the price decline. Conversely, a bearish divergence occurs when the stock price makes higher highs while the OBV line makes lower highs, suggesting that buying interest is weakening. These divergences can serve as early signals of a possible change in the stock's price direction.

  • Identify Accumulation and Distribution - The OBV indicator can help traders identify whether a stock is being accumulated or distributed during periods of sideways price movements. A rising OBV line while the price remains stable may indicate accumulation, suggesting that investors are gradually buying shares and that an upward breakout could follow. On the other hand, a falling OBV line with a stable stock price may signal distribution, indicating increasing selling pressure and a potential risk of future price weakness.

  • Use Proper Risk Management - It is important to remember that no indicator is accurate all the time. Therefore, traders should always use stop-loss orders, manage position sizes carefully, and avoid relying solely on OBV when making trading decisions.

  • Combine OBV with Other Indicators - OBV works best when used along with tools such as moving averages, RSI, MACD, and support and resistance levels. Multiple confirmations can improve the reliability of trading signals and help traders make more informed portfolio decisions.

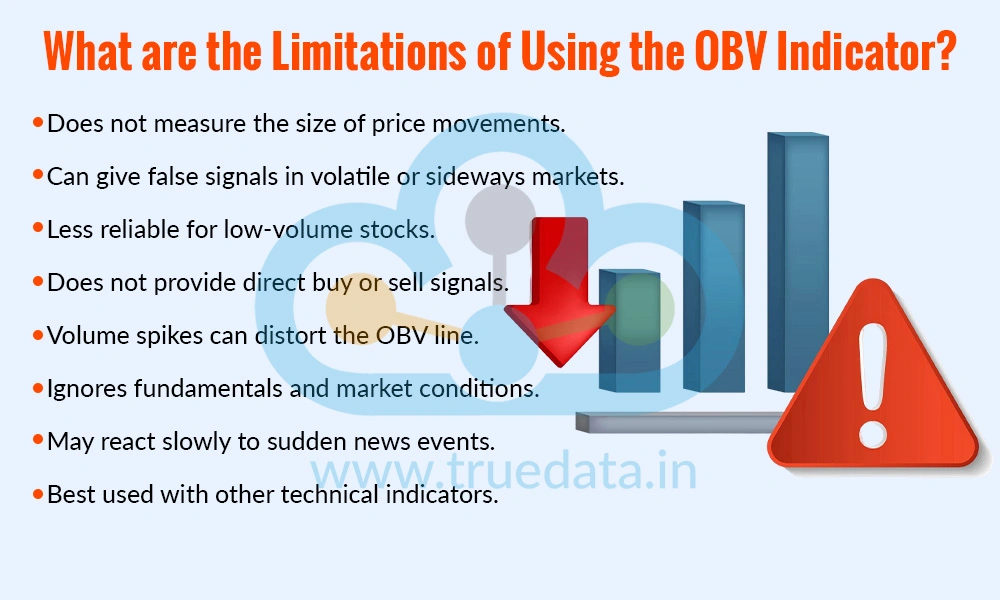
What are the Limitations of Using the OBV Indicator?

What are the Limitations of Using the OBV Indicator

Some of the key limitations of using the OBV Indicator are explained below.

  • Does not measure the magnitude of price movements as it only considers whether the price closed higher or lower.

  • Can generate false signals, especially in volatile or sideways markets.

  • May be less reliable for stocks with low trading volume.

  • Does not provide clear buy or sell signals on its own.

  • Large volume spikes can distort the OBV line and affect its interpretation.

  • Ignores company fundamentals and broader market conditions.

  • May not react quickly to sudden news-driven market movements.

  • Works best when used alongside other technical indicators and price analysis.

Conclusion

The On-Balance Volume (OBV) indicator is a simple yet powerful tool that helps traders understand whether buying or selling pressure is supporting a stock's price movement. By combining price action with trading volume, OBV can help confirm trends, identify potential reversals, and validate breakouts. However, like any technical indicator, it should not be used in isolation. Traders can improve their decision-making by combining OBV with other technical indicators and price analysis. When used correctly, OBV can provide valuable insights into market sentiment and help investors make more informed trading decisions.

This article explains a popular trading indicator in detail and is an attempt to help traders understand the nuances of technical analysis in a refined manner. Let us know your thoughts on the article or if you need further information on the same, and we will address it soon. 

Till then, Happy Reading!


Read More: Average True Range (ATR) Indicator

Frequently Asked Questions

Price alone shows how a stock's value is changing, while the OBV indicator combines price and trading volume to show whether buying or selling pressure is supporting that move. This helps traders assess the strength and reliability of a price trend.

No, OBV should not be used as the sole basis for trading decisions. It works best when combined with other technical indicators, price action analysis, and risk management tools to confirm signals and reduce the chances of false trades.

Yes, the OBV indicator can be used on any timeframe, including intraday, daily, weekly, and monthly charts. However, signals on longer timeframes are generally considered more reliable than those on shorter timeframes, which may be affected by market noise.

Volume spikes caused by events such as block deals, stock splits, index rebalancing, or corporate announcements can temporarily distort the OBV line. Traders should analyse the reason behind the spike and confirm signals with price action and other indicators before making trading decisions.

Common OBV trading strategies include trend confirmation, divergence trading, breakout confirmation, and identifying accumulation or distribution phases. Traders often combine OBV with indicators such as RSI, moving averages, and support and resistance levels to improve the reliability of their signals.

Traders can apply a moving average to the OBV line to identify changes in volume trends more clearly. When the OBV line moves above its moving average, it may signal strengthening buying pressure, while a move below it may indicate increasing selling pressure.
Marisha Bhatt

Marisha Bhatt is a financial content writer @TrueData.

She writes with the sole aim of simplifying complex financial concepts and jargon while attempting to clarify technical and fundamental analysis concepts of the stock markets. The ultimate goal is to spread vital knowledge and benefit the maximum audience. Her Chartered Accountant background acts as the knowledge base to help clarify crucial concepts and create a sound investment portfolio.

0 Comments

Related Articles

SEE ALL
Trading Strategies / Indicators
Average True Range (ATR) Indicator

Technical analysis offers traders a wide range of tools to better understand mar...

Trading Strategies / Indicators
Best Technical Indicators

When we take our first step into the trading game, we choose the best resource...

Investing / Trading
Investing / Trading
Volume Analysis and Volume Indicators

It is a fact that technical analysis is the basis of analysing stocks. What does...