
Technical analysis offers traders a wide range of tools to better understand market movements, and the Average True Range (ATR) is one of the most useful among them. Unlike many indicators that focus on price direction, ATR measures market volatility, helping traders understand how much a stock or index is likely to move. Curious to know more? Dive into this blog to explore the meaning and origins of this indicator and how to use it for successful trading.

The Average True Range (ATR) Indicator is a popular technical analysis tool that measures how much the price of a stock, index, commodity, or other financial asset typically moves over a given period. It helps traders understand the level of market volatility, or how calm or active the market is, without indicating whether prices are likely to rise or fall.
The ATR indicator was developed by J. Welles Wilder Jr. and introduced in his 1978 book, New Concepts in Technical Trading Systems. It was originally designed for analysing commodity markets, where price gaps and sharp movements were common, but today it is widely used across stocks, indices, currencies, commodities, and other financial markets. A higher ATR value suggests that prices are making larger moves and the market is more volatile, while a lower ATR value indicates smaller price movements and relatively stable market conditions. Traders often use ATR to set stop-loss levels, determine position size, and better manage risk based on current market volatility.

The Average True Range (ATR) is calculated in two steps. The first step is to calculate the True Range (TR) for each trading session. The True Range measures the actual price movement by considering both the day's trading range and any price gaps from the previous day's closing price. It is taken to be the largest of the following three values,
Current High - Current Low
Current High - Previous Close
Current Low - Previous Close
Once the True Range has been calculated for each period, the first ATR is calculated by taking the simple average of the True Range values over the selected period, which is 14 periods by default.
First ATR = (Sum of the first 14 True Range values) / 14
After the first ATR is calculated, all future ATR values are calculated using Wilder's smoothing formula, developed by J. Welles Wilder Jr. This method updates the ATR by combining the previous ATR with the latest True Range, making the indicator smoother without recalculating the entire average every time.
ATR = {[(Previous ATR × (n − 1)] + Current TR} / n
Where,
Previous ATR = ATR value from the previous period
Current TR = Current period's True Range
n = Number of periods (usually 14)
Understanding the Calculation of ATR Using an Example

Consider the following stock prices of PQR Ltd.
Previous day's closing price = Rs. 100
Current day's high = Rs. 108
Current day's low = Rs. 102
The calculation of ATR for PQR Ltd is shown below.
Step 1- Calculate the True Range (TR)
Current High - Current Low = Rs. 108 - Rs. 102 = Rs. 6
Current High - Previous Close = Rs.108 - Rs. 100 = Rs. 8
Current Low - Previous Close = Rs.102 - Rs. 100 = Rs. 2
The True Range (TR) is the highest of these three values; therefore,
TR = Rs. 8
Step 2 - Calculate the First ATR
Assuming the sum of the first 14 True Range values is Rs. 98, then,
First ATR = Rs. 98 / 14 = Rs. 7
So, the stock has moved by an average of Rs. 7 per trading session over the last 14 periods.
Step 3 - Calculate the Next ATR
On the next trading day,
Previous ATR = Rs. 7
Current True Range = Rs. 9
Using Wilder's smoothing formula,
ATR = {[(7 × 13) + 9]} / 14 ≈ Rs. 7.14
This means the stock's average price movement has increased slightly from Rs. 7.00 to Rs. 7.14, indicating a small rise in market volatility. Traders use this information to set appropriate stop-loss levels, estimate potential price movement, and manage trading risk more effectively.

The Average True Range (ATR) measures market volatility, not the direction of price movement. A rising or falling ATR simply tells whether price movements are becoming larger or smaller. Here's how to interpret it
High ATR Indicates High Volatility - A high ATR means the price is making larger-than-usual moves. This often happens during strong trends, major news events, or periods of high buying and selling activity. Traders may expect bigger price swings and adjust their stop-loss levels accordingly.
Low ATR Indicates Low Volatility - A low ATR means the price is moving within a narrow range. This usually indicates a calm or sideways market where price fluctuations are relatively small.
Rising ATR Shows Increasing Market Activity - When the ATR starts rising, it means volatility is increasing. This often happens when a new trend begins or when the market reacts to important events. However, ATR does not indicate whether the trend is bullish or bearish.
Falling ATR Shows Decreasing Market Activity - A falling ATR suggests that price movements are becoming smaller. This may indicate that an existing trend is losing momentum or that the market is entering a consolidation phase.
ATR Does Not Predict Price Direction - One of the most important things to remember is that ATR does not tell whether prices will move up or down. It only measures the strength of price movement. Traders usually combine ATR with other indicators, such as moving averages or RSI, to identify the likely market direction.
Compare ATR with the Asset's Price - The ATR value should always be interpreted in the context of the asset's price. For example, an ATR of Rs. 5 may indicate high volatility for a stock of Rs. 50 but relatively low volatility for a stock of Rs. 5,000.
Use ATR for Better Risk Management - Many traders use ATR to set stop-loss levels and determine position size. In highly volatile markets, they may use wider stop-losses, while in less volatile markets, they may use tighter stop-losses to better manage risk.

The Average True Range (ATR) is mainly used to measure market volatility and improve risk management. Since it does not indicate whether prices will move up or down, traders usually combine it with other technical indicators or chart patterns. Some of the common ways to use the ATR indicator include,
Set Better Stop-Loss Levels - ATR helps traders place stop-loss orders based on the market's current volatility instead of using a fixed price distance. During highly volatile markets, a wider stop-loss can help avoid getting stopped out by normal price fluctuations, while a tighter stop-loss may be suitable during calmer market conditions.
Decide Position Size - ATR can help traders decide how many shares or lots to buy or sell. If the ATR is high, traders may reduce their position size to limit risk. If the ATR is low, they may be comfortable taking a slightly larger position while maintaining the same level of risk.
Identify Breakout Opportunities - A sudden rise in ATR after a period of low volatility may indicate that the market is becoming more active. When combined with support and resistance levels or chart patterns, this can help traders identify potential breakout opportunities.
Confirm the Strength of a Trend - A rising ATR during an existing uptrend or downtrend often suggests that the trend is gaining strength as price movements are becoming larger. However, ATR should be used alongside trend indicators since it does not indicate the direction of the trend.
Avoid Trading During Low Volatility - A very low ATR often indicates that the market is moving sideways with limited price movement. Some traders prefer to wait until volatility increases before entering a trade, as this may offer better trading opportunities.
Combine ATR with Other Indicators - ATR works best when used with other technical analysis tools such as Moving Averages, RSI, MACD, or support and resistance levels. While ATR measures the size of price movements, these indicators help identify the likely direction of the market, leading to more informed trading decisions.
As ATR does not indicate whether prices will move up or down, it is usually combined with price action, chart patterns, or other technical indicators. By understanding how ATR behaves, traders can make better decisions about when to enter a trade, where to place a stop-loss, and how much capital to risk.

The most popular use of the ATR indicator is to set volatility-based stop-loss levels. Instead of placing a stop-loss at a fixed price or percentage, traders place it at a multiple of the ATR, such as 1.5*ATR or 2*ATR, away from their entry price. This ensures that the stop-loss is based on the stock's normal price movement rather than an arbitrary number. For example, if a stock is trading at Rs. 500 and its ATR is Rs. 10, a trader using a 2*ATR stop-loss may place the stop-loss Rs. 20 below the entry price, at Rs. 480. Since the stock normally moves around Rs. 10 in a trading session, this gives the trade enough room to fluctuate without being exited too early due to normal market noise. At the same time, it helps limit losses if the trade moves against the trader.

ATR can also be used to create a trailing stop-loss, which automatically moves in the direction of a profitable trade. Instead of keeping the stop-loss fixed, the trader adjusts it based on the latest ATR value as the stock price rises or falls. For example, suppose a trader buys a stock at Rs. 500 with an ATR of Rs. 10. If the stock rises to Rs. 540, they can move their stop-loss higher while keeping it about 2*ATR below the current price. This allows them to protect a part of their profit while still giving the stock enough room to continue its upward movement. If the trend continues, the trailing stop keeps moving higher. If the price reverses sharply, the stop-loss helps exit the trade before a large portion of the profit is lost.

Many stocks spend days or weeks trading within a narrow price range. During such periods, the ATR usually remains low, indicating that price movements are relatively small. A sudden increase in the ATR often signals that volatility is returning to the market. Traders look for situations where the price breaks above a resistance level or below a support level while the ATR is also rising. This combination suggests that the breakout is backed by increasing market activity and may have a higher chance of continuing. However, ATR alone does not confirm a breakout. Many traders also check for higher trading volumes or use indicators like RSI or MACD to avoid false breakouts.

One of the biggest mistakes traders make is investing the same amount of money in every trade, regardless of how volatile the stock is. ATR helps solve this problem by allowing traders to adjust their position size according to the stock's volatility. If the ATR is high, the stock experiences larger daily price swings, making it riskier. In such cases, traders often reduce the number of shares or lots they buy. If the ATR is low, the stock is relatively stable, so they may choose a slightly larger position while keeping the same level of risk. This approach helps maintain consistent risk across different trades instead of risking too much on highly volatile stocks.

Although ATR cannot tell whether a trend is bullish or bearish, it can indicate how strong the current trend is. A rising ATR during an uptrend or downtrend suggests that price movements are becoming larger and that the trend is gaining momentum. For example, if a stock keeps making higher highs and higher lows while the ATR also rises, it shows that buyers are becoming more active and the trend is strengthening. Similarly, if the price is falling and the ATR is increasing, it suggests that selling pressure is becoming stronger. On the other hand, if the ATR starts falling while the trend continues, it may indicate that the trend is losing strength and the market could soon move sideways or reverse.

ATR becomes more effective when combined with Moving Averages, as the two indicators provide different types of information. Moving averages help identify the direction of the trend, while ATR measures the strength of price movement. For example, if a stock is trading above its 50-day moving average and the ATR begins to rise, it may suggest that the uptrend is becoming stronger and attracting more buying interest. Similarly, if the stock is trading below the moving average and ATR increases, it may indicate that the downtrend is gaining momentum. By using both indicators together, traders can avoid relying on volatility alone and make more informed trading decisions.

Support and resistance levels are widely used to identify potential buying and selling zones. ATR can help traders judge whether a breakout from these levels is likely to be strong or weak. For example, suppose a stock has repeatedly failed to move above Rs. 1,000, making it a resistance level. If the stock finally breaks above Rs. 1,000 and the ATR also rises, it suggests that volatility is increasing and buyers are entering the market with greater strength. This increases the chances that the breakout may continue. Similarly, if a stock falls below an important support level while the ATR rises, it may indicate stronger selling pressure. Even then, traders should look for confirmation from higher trading volume or other technical indicators before taking a position, as no single indicator can guarantee successful trades.

While the Average True Range (ATR) is a useful tool for measuring market volatility, it also has some limitations that traders should keep in mind. These limitations include,
Does not indicate price direction - ATR only measures the size of price movements. It does not tell whether the price is likely to move up or down.
Works best with other indicators - ATR should not be used on its own. It is more effective when combined with indicators like Moving Averages, RSI, MACD, or support and resistance levels.
Based on past price data - ATR is a lagging indicator as it uses historical price movements. It may not always reflect sudden changes in market conditions immediately.
Can give high readings after sharp price moves - A sudden news event or market shock can cause ATR to rise sharply. The high ATR value may continue for some time even after the market becomes less volatile.
Does not identify entry or exit points - ATR helps measure volatility and manage risk, but it does not provide buy or sell signals on its own.
May be less useful in sideways markets - During periods of low volatility and range-bound trading, ATR may remain low and provide limited trading insights.
Different time periods can produce different results - Using different ATR settings, such as 7, 14, or 21 periods, can lead to different readings and trading decisions.
No guarantee of successful trades - Like any technical indicator, ATR cannot predict future price movements with certainty and should always be used as part of a broader trading strategy.
The Average True Range (ATR) is a valuable technical indicator that helps traders understand how much a stock or other asset is likely to move over a given period. While it does not predict the direction of prices, it can help traders measure market volatility, set better stop-loss levels and manage overall risk. Understanding and using ATR correctly can help investors and traders make more informed and disciplined trading decisions.
This article is an attempt to provide deep insight into an important trading indicator. Let us know your thoughts on the topic or if you need further information on the same, and we will address it soon.
Till then, Happy Reading!
Read More: What is Market Profile?
Marisha Bhatt is a financial content writer @TrueData.
She writes with the sole aim of simplifying complex financial concepts and jargon while attempting to clarify technical and fundamental analysis concepts of the stock markets. The ultimate goal is to spread vital knowledge and benefit the maximum audience. Her Chartered Accountant background acts as the knowledge base to help clarify crucial concepts and create a sound investment portfolio.
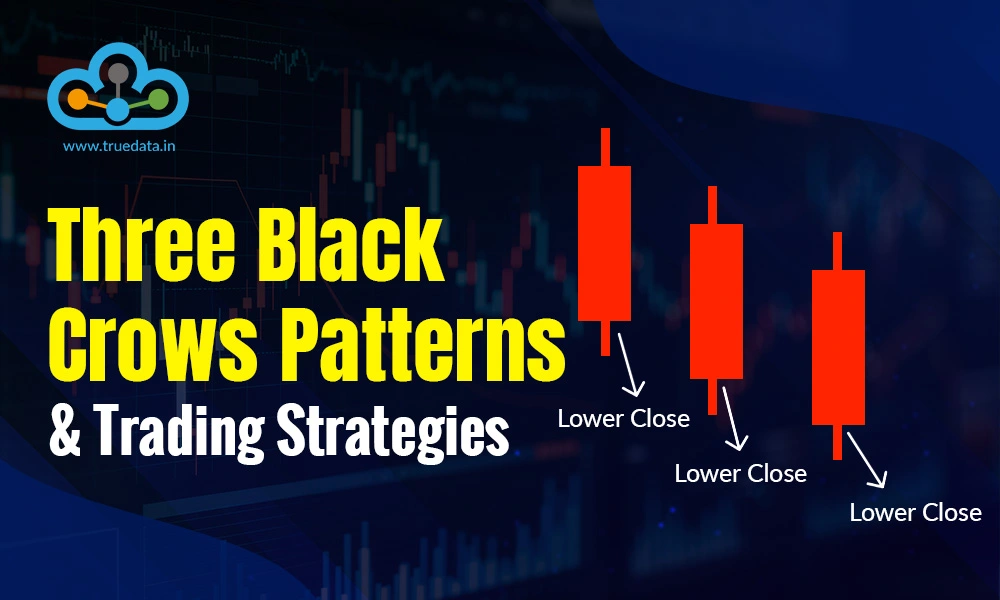
The red and green candlesticks on a chart may look like chaos at first glance. B...
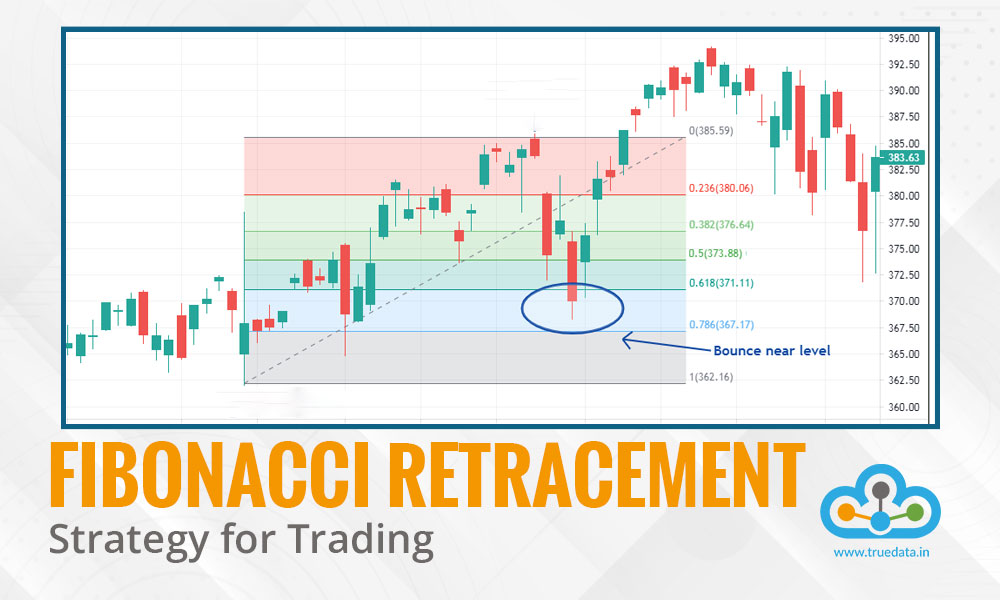
If you are a trader, then you would have definitely heard the term Fibonacci ret...

Ask any trader how they read market moves, and chances are they will mentioncand...