Corporate Data

Understanding Dividend Ratios for Stock Evaluation - Dividend Yield, Dividend Payout Ratio and Dividend Cover

Marisha Bhatt · 13 Aug 2026 · 15 mins read · 0 Comments

understanding-dividend-ratios-for-stock-evaluation-dividend-yield-dividend-payout-ratio-and-dividend-cover

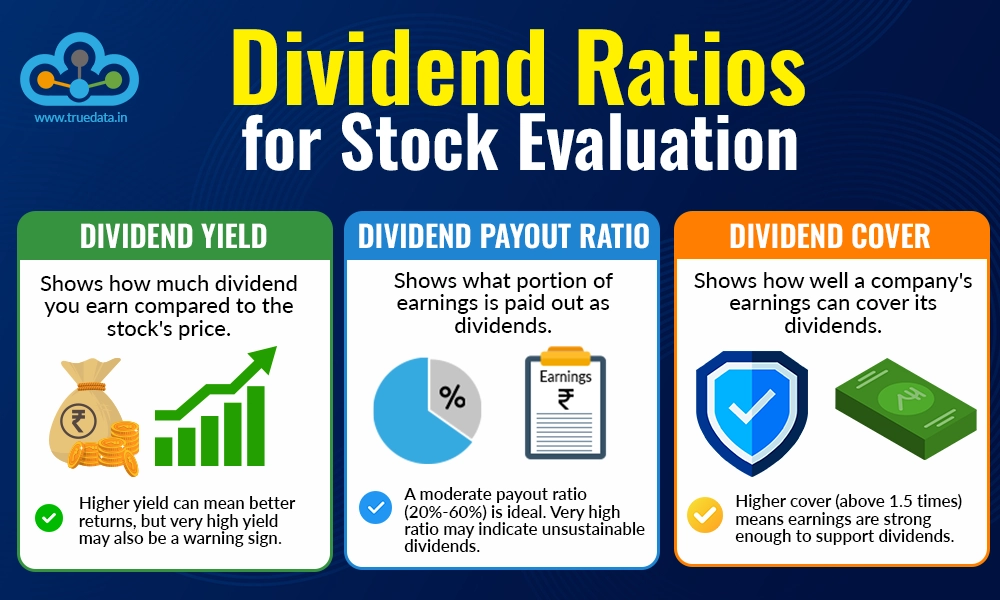
Dividends are one of the ways companies reward shareholders by sharing a portion of their profits. For many investors, especially those looking for regular income, dividend-paying stocks are an important part of a well-balanced portfolio. However, choosing a stock based only on the size of its dividend may not always be the best approach. This is where dividend ratios come in. Metrics such as Dividend Yield, Dividend Payout Ratio, and Dividend Cover can help you understand whether a company's dividends are attractive, sustainable, and backed by strong earnings. Check out our blog to understand these important dividend ratios and their use in making informed investment decisions.

What are Dividend Ratios and Why are they Important?

What are Dividend Ratios and Why are they Important

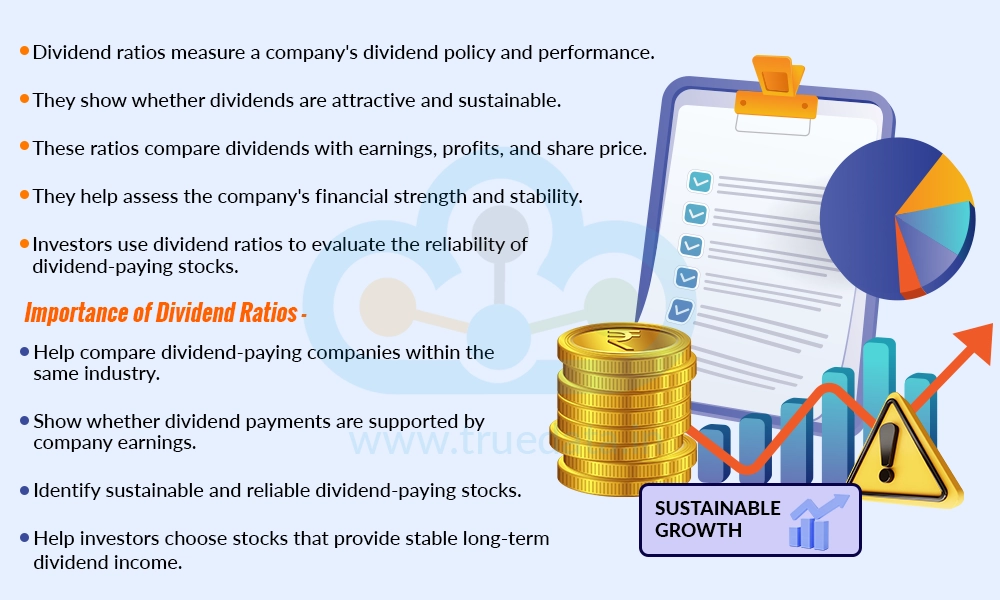
Dividend ratios are financial measures that help investors understand a company's dividend policy and its ability to continue paying dividends in the future. While the dividend amount tells investors how much money they receive, dividend ratios provide deeper insights into whether those payments are attractive, affordable, and sustainable. These ratios compare dividends with factors such as the company's share price, earnings, and profits, giving a clearer picture of its financial strength. By studying dividend ratios, investors can determine whether a company is rewarding shareholders consistently without putting pressure on its finances. Since companies may increase, reduce, or even stop paying dividends depending on their financial performance, dividend ratios are useful tools for evaluating the quality of dividend-paying stocks rather than relying only on the dividend amount.

Importance of Dividend Ratios - 

  • Dividend ratios help investors compare dividend-paying companies in the same industry more effectively than simply comparing the dividend amount.

  • They indicate whether a company's dividend payments are supported by its earnings, helping investors identify sustainable dividend stocks.

  • These ratios help investors avoid companies that may be paying unusually high dividends that could be difficult to maintain in the future.

  • They provide a better understanding of how much of a company's profits are being shared with shareholders and how much is being retained for future growth.

  • Dividend ratios help income-focused investors identify stocks that may provide a steady stream of dividend income over the long term.

  • Dividend ratios support better stock selection by helping investors distinguish between companies that offer attractive dividends and those that offer sustainable and financially sound dividends.

What is Dividend Yield and How to Calculate It?

What is Dividend Yield and How to Calculate It

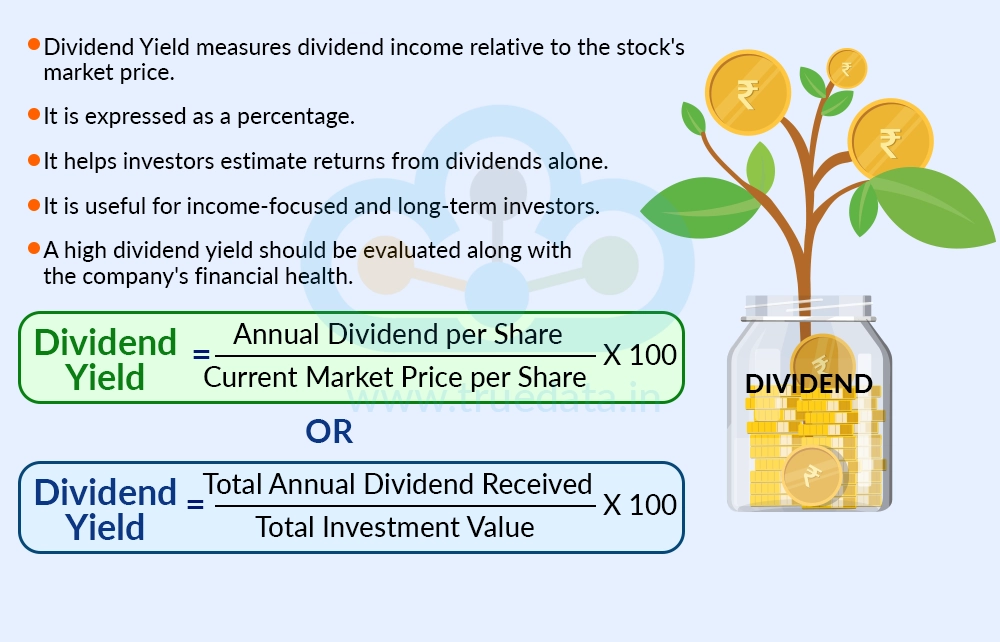
Dividend Yield is a financial ratio that shows how much dividend income an investor earns from a stock compared to its current market price. It is expressed as a percentage and helps investors understand the return they receive from dividends alone, without considering any increase or decrease in the stock's price. Investors seeking a regular source of income, such as retirees or long-term income-focused investors, use dividend yield as one of the most commonly used measures while selecting dividend-paying stocks. 

A higher dividend yield may appear attractive, but it should always be analysed along with the company's financial health, earnings, and ability to continue paying dividends in the future. A very high dividend yield can sometimes result from a sharp fall in the stock price rather than an increase in the dividend. Therefore, investors should avoid relying on this ratio alone.

The formula to calculate Dividend Yield is,

Dividend Yield = (Annual Dividend per Share / Current Market Price per Share) * 100

Where, 

  • Annual Dividend Per Share is the total dividend paid by the company on one share during a financial year. It includes all interim and final dividends declared during the year.

  • Current Market Price per Share is the latest price at which the company's share is trading in the stock market.

Or

Dividend Yield = (Total Annual Dividend Received / Total Investment Value) * 100

This formula can be used by investors owning multiple shares to understand the overall yield of the portfolio. 

Understanding Dividend Yield Using Example

understanding-dividend-yield-using-example-1

  • Example 1 - 

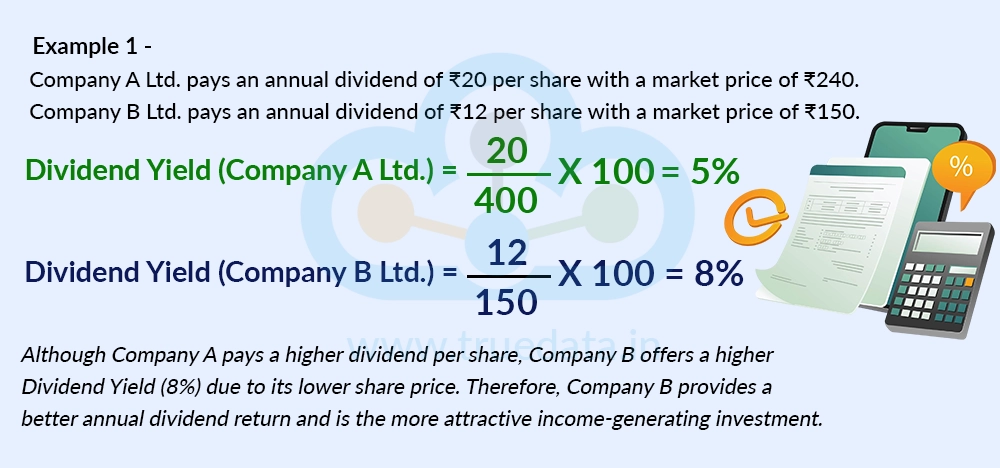
Consider Company A Ltd. paying Rs. 20 per share annual dividend with a current market price of Rs. 240 per share and Company B Ltd. paying Rs. 12 per share annual dividend and a current market price of Rs. 150 per share. 

Dividend Yield (Company A Ltd.) = 20/400*100 = 5%

Dividend Yield (Company B Ltd.) = 12/150*100 = 8%

Therefore, even though Company A pays a larger dividend in rupee terms, Company B offers a higher Dividend Yield of 8% as its share price is much lower relative to the dividend it pays. This means an investor buying Company B's shares at the current market price earns a higher dividend return on every rupee invested than an investor buying Company A's shares. Thus, Company B Ltd. appears to be the better income-generating investment, as it provides a higher annual dividend return on the investment amount.

  • Example 2 - 

understanding-dividend-yield-using-example-2

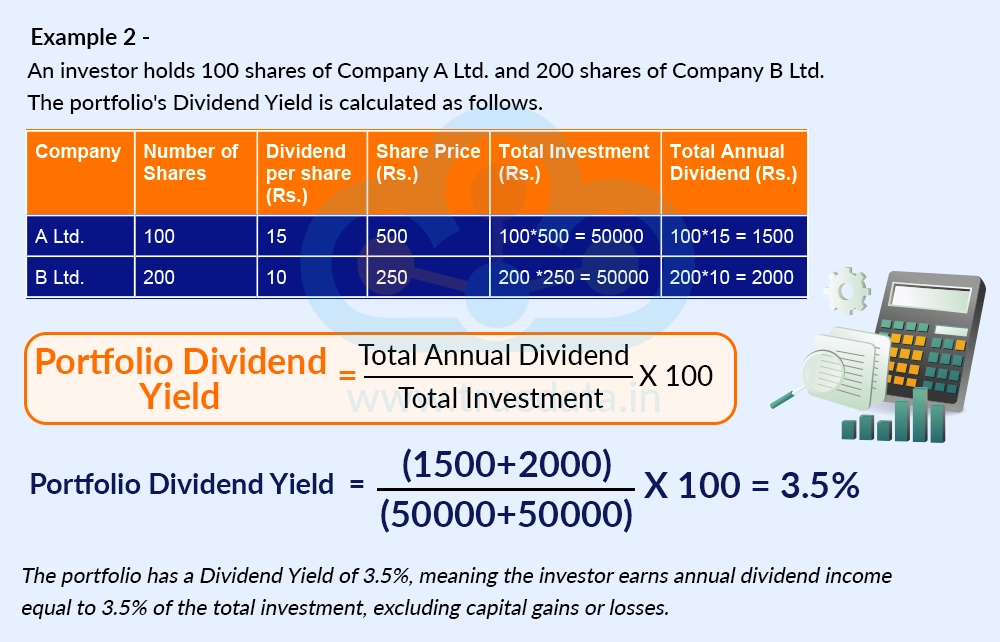
An investor has 100 shares of Company A Ltd. giving a dividend of Rs. 15 per share with a market price of Rs. 500 per share and 200 shares of Company B Ltd. giving a dividend of Rs. 10 per share with a market price of Rs. 250 per share. The dividend yield of the portfolio is shown below. 

Company

Number of Shares

Dividend per share (Rs.)

Share Price (Rs.)

Total Investment (Rs.)

Total Annual Dividend (Rs.)

A Ltd. 

100

15

500

100*500 = 50000

100*15 = 1500

B Ltd. 

200

10

250

200 *250 = 50000

200*10 = 2000

Portfolio Dividend Yield = (Total Annual Dividend / Total Investment) * 100

Portfolio Dividend Yield = (1500+2000) / (50000+50000) * 100 = 3.5%

The overall Dividend Yield of the portfolio is 3.5%. Thus, the investor earns an annual dividend income equal to 3.5% of the total amount invested, excluding any gains or losses due to changes in the share prices. Calculating the portfolio's Dividend Yield gives a better picture of the income generated from the entire investment portfolio rather than looking at each stock separately. It also helps investors compare the income potential of different portfolios and assess whether the dividend income matches their investment goals.

What is Dividend Payout Ratio and How to Calculate It?

What is Dividend Payout Ratio and How to Calculate It

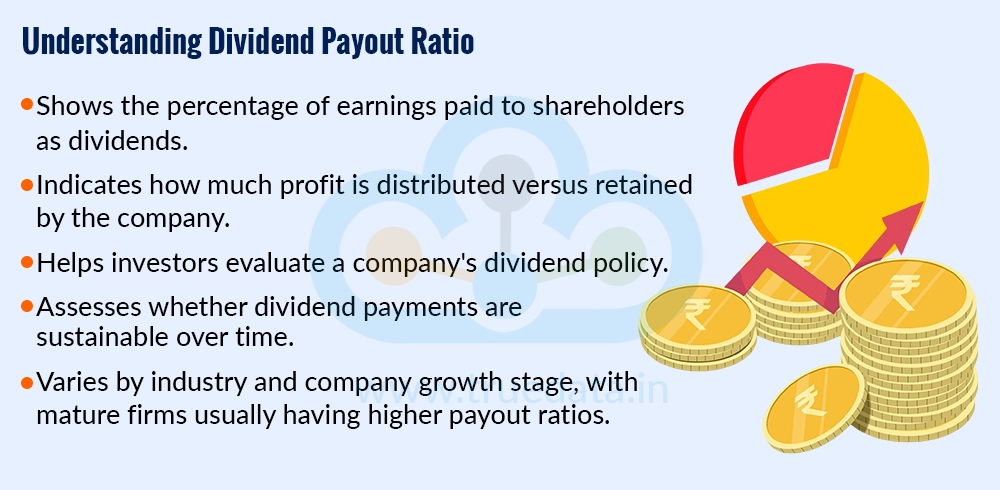
The Dividend Payout Ratio is a financial ratio that shows what percentage of a company's earnings is distributed to shareholders as dividends. It tells investors how much of the profit a company shares with its shareholders and how much it retains for future growth, expansion, debt repayment, or other business needs. This ratio helps investors understand a company's dividend policy and whether its dividend payments are sustainable. A company that pays out a reasonable portion of its earnings while retaining enough profits to grow its business is generally considered financially healthy. However, the ideal Dividend Payout Ratio varies across industries and depends on the company's stage of growth. Mature companies often have higher payout ratios, while fast-growing companies usually retain a larger share of their profits and therefore have lower payout ratios. The formulas for calculating the dividend payout ratio are explained below.

  1. Using Dividend per Share (DPS) and Earnings per Share (EPS)

using-dividend-per-share-dps-and-earnings-per-share-eps

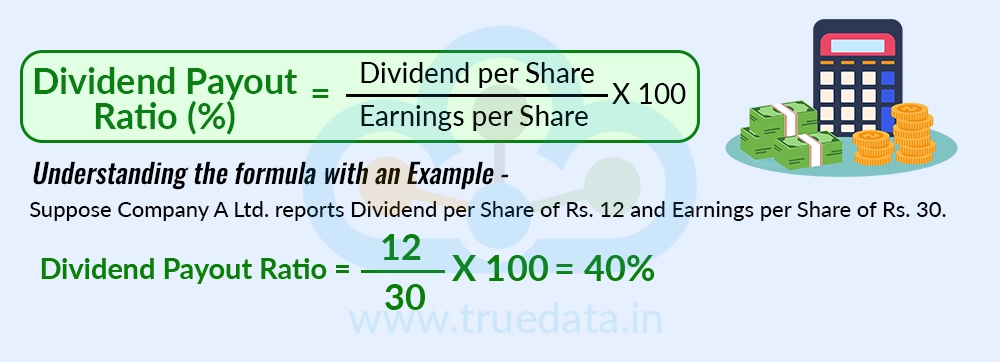
Dividend Payout Ratio (%) = (Dividend per Share / Earnings per Share) * 100

Where,

  1. Dividend per Share (DPS) is the total dividend paid by the company on each share during a financial year.

  2. Earnings Per Share (EPS) is the profit earned by the company for each outstanding share after taxes and preference dividends.

Understanding the formula with an Example - 

Suppose Company A Ltd. reports Dividend per Share of Rs. 12 and Earnings per Share of Rs. 30

Dividend Payout Ratio = (12 / 30) * 100 = 40%

Thus, the company distributes 40% of its earnings as dividends and retains the remaining 60% for business growth, expansion, debt repayment, or other corporate purposes.

  1. Using Total Dividends and Net Profit After Tax

Using Total Dividends and Net Profit After Tax

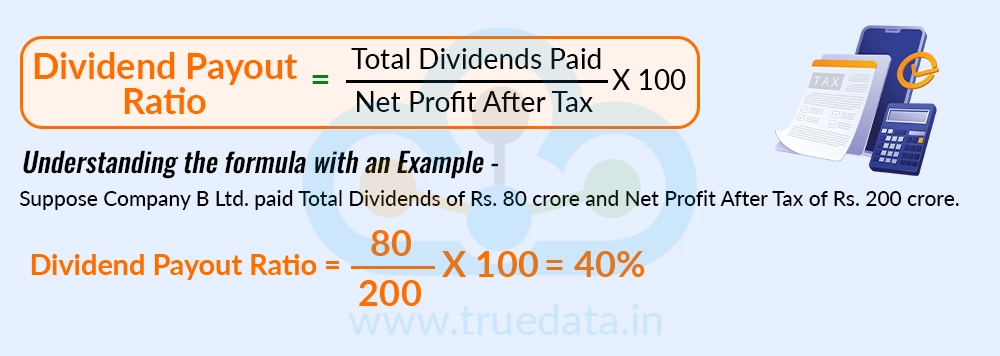
Dividend Payout Ratio = (Total Dividends Paid / Net Profit After Tax) * 100

This formula is commonly used when analysing a company's financial statements.

Where,

  1. Total Dividends Paid is the total amount of dividends paid to all shareholders during the financial year.

  2. Net Profit After Tax (PAT) is the company's total profit after deducting taxes.

Understanding the formula with an Example - 

Suppose Company B Ltd. paid Total Dividends of Rs. 80 crore and Net Profit After Tax of Rs. 200 crore

Dividend Payout Ratio = (80 / 200) * 100 = 40%

Thus, the company distributes 40% of its total profits to shareholders and retains the remaining 60% within the business.

  1. Using Retention Ratio

using-retention-ratio

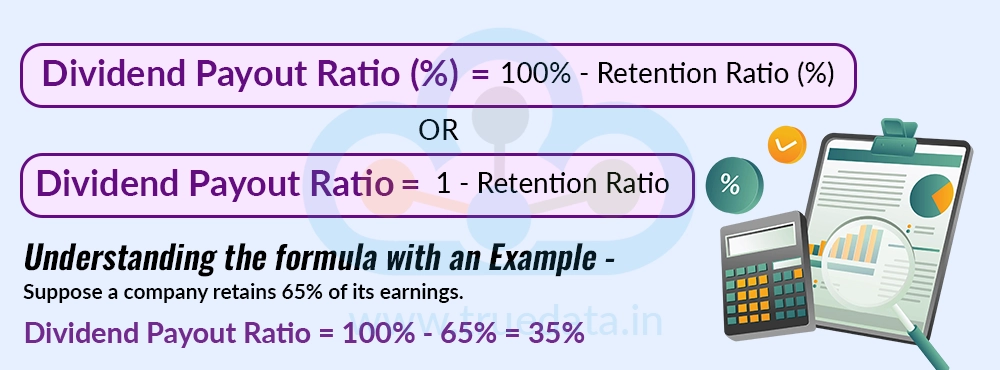
Since a company's profits are either distributed as dividends or retained in the business, the Dividend Payout Ratio can also be calculated using the Retention Ratio.

Dividend Payout Ratio (%) = 100% - Retention Ratio (%)

Or 

Dividend Payout Ratio = 1 - Retention Ratio 

Where, 

  1. Retention Ratio is the percentage of earnings that the company keeps for future growth instead of paying as dividends.

Understanding the formula with an Example - 

Suppose a company retains 65% of its earnings.

Dividend Payout Ratio = 100% - 65% = 35%

Thus, the company pays 35% of its earnings as dividends and keeps the remaining 65% for reinvestment and future business needs.

Key Points to Remember - 

  • A high Dividend Payout Ratio indicates that a company distributes a large portion of its earnings as dividends. This is common among mature and well-established companies.

  • A low Dividend Payout Ratio indicates that the company retains more of its earnings to support future growth, which is common among fast-growing businesses.

  • A Dividend Payout Ratio above 100% means the company is paying more in dividends than it earned during the period. If this continues for a long time, it may not be sustainable unless the company has sufficient cash reserves or other sources of funds.

  • The Dividend Payout Ratio should always be analysed together with Dividend Yield, Dividend Cover, earnings growth, cash flows, debt levels, and the company's overall financial health before making an investment decision.

What is Dividend Cover Ratio and How to Calculate It?

What is Dividend Cover Ratio and How to Calculate It

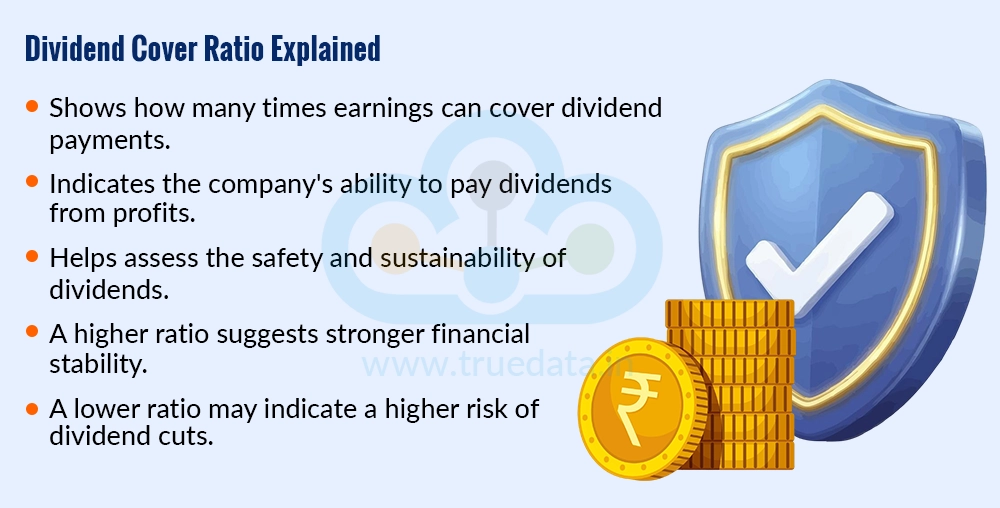
The Dividend Cover Ratio is a financial ratio that shows how many times a company's earnings can cover the dividends it pays to shareholders. It indicates whether the company is earning enough profit to comfortably pay its dividends. Unlike the Dividend Payout Ratio, which tells investors what percentage of earnings is paid as dividends, the Dividend Cover Ratio measures the safety of those dividend payments. A higher Dividend Cover Ratio generally suggests that the company has sufficient earnings to maintain its dividend even if profits decline in the future. On the other hand, a lower Dividend Cover Ratio may indicate that the company has limited room to continue paying dividends if its earnings fall. Therefore, this ratio is widely used by investors to assess the sustainability and reliability of a company's dividend policy. The formulas for calculating the dividend cover ratio are explained below.

  1. Using Earnings per Share (EPS) and Dividend per Share (DPS)

using-earnings-per-share-eps-and-dividend-per-share-dps-dividend-cover-ratio

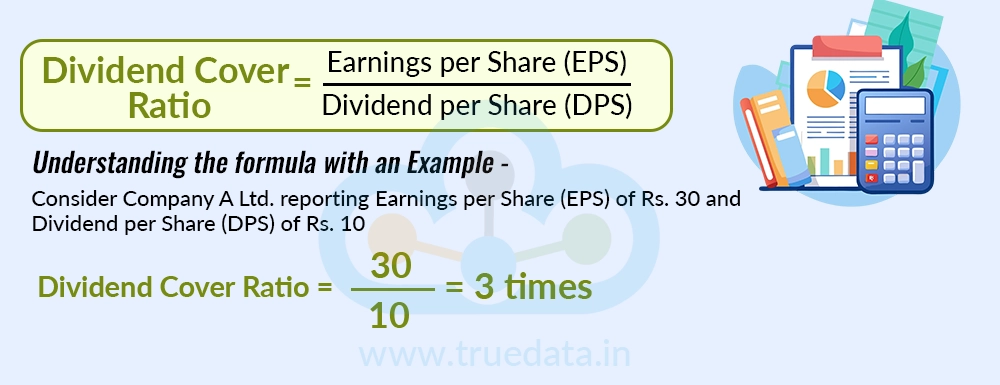
Dividend Cover Ratio = Earnings per Share (EPS) / Dividend per Share (DPS)

Where,

  1. Earnings per Share (EPS) is the profit earned by the company for each outstanding share after taxes and preference dividends.

  2. Dividend per Share (DPS) is the total dividend paid on each share during a financial year.

The result shows how many times the company's earnings can cover the dividend paid on each share.

Understanding the formula with an Example - 

Consider Company A Ltd. reporting Earnings per Share (EPS) of Rs. 30 and Dividend per Share (DPS) of Rs. 10

Dividend Cover Ratio = 30 / 10 = 3 times

Thus, the company's earnings are three times the amount needed to pay its annual dividend. Even if earnings decline moderately, the company may still be able to continue paying dividends.

  1. Using Net Profit After Tax and Total Dividends

Using Net Profit After Tax and Total Dividends

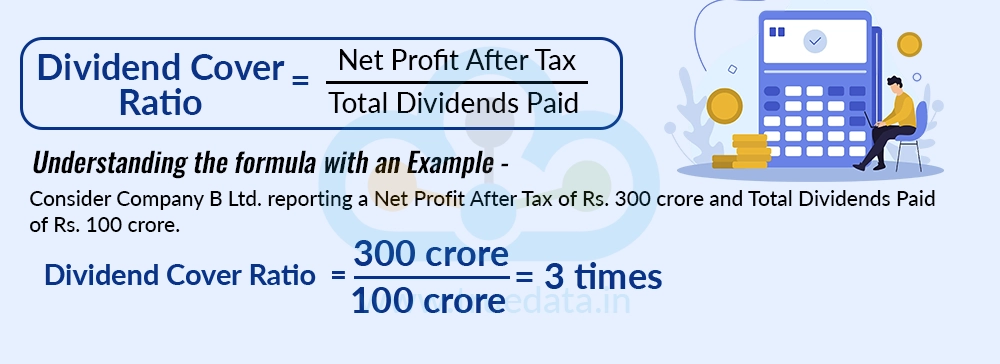
Dividend Cover Ratio = Net Profit After Tax / Total Dividends Paid

This formula is commonly used while analysing a company's financial statements.

Where, 

  1. Net Profit After Tax (PAT) is the company's total profit after deducting taxes.

  2. Total Dividends Paid are the total dividends distributed to all shareholders during the financial year.

The result shows how many times the company's total profits cover the total dividend payments.

Understanding the formula with an Example - 

Consider Company B Ltd. reporting a Net Profit After Tax of Rs. 300 crore and Total Dividends Paid of Rs. 100 crore

Dividend Cover Ratio = 300 crore / 100 crore = 3 times

Thus, the company earned three times the amount required to pay its dividends during the year, indicating that its dividend payments are well supported by profits.

  1. Using Dividend Payout Ratio

Using Dividend Payout Ratio

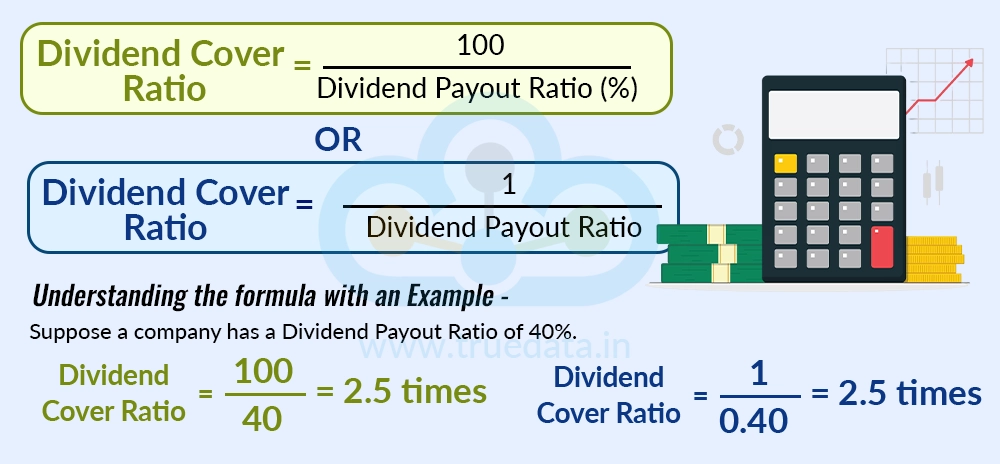
Since the Dividend Cover Ratio and Dividend Payout Ratio are inversely related, one can also be calculated from the other.

Dividend Cover Ratio = 100 / Dividend Payout Ratio (%)

or

Dividend Cover Ratio = 1 / Dividend Payout Ratio

Where, 

  1. Dividend Payout Ratio is the percentage of earnings distributed as dividends.

Understanding the formula with an Example - 

Suppose a company has a Dividend Payout Ratio of 40%.

Dividend Cover Ratio = 100 / 40 = 2.5 times

or

Dividend Cover Ratio = 1 / 0.40 = 2.5 times

Thus, the company's earnings are 2.5 times the dividend it pays to shareholders.

Key Points to Remember - 

  • A higher Dividend Cover Ratio generally indicates that the company's dividend payments are well supported by earnings and may be more sustainable.

  • A Dividend Cover Ratio of around 2 or more is often considered comfortable because the company earns at least twice the amount required to pay dividends. However, the ideal ratio varies across industries.

  • A Dividend Cover Ratio below 1 means the company is paying more in dividends than it earns during the period. Such a situation may not be sustainable over the long term unless the company uses retained earnings or cash reserves.

  • The Dividend Cover Ratio should always be analysed along with the Dividend Yield, Dividend Payout Ratio, earnings growth, cash flows, debt levels, and overall financial health before making an investment decision.

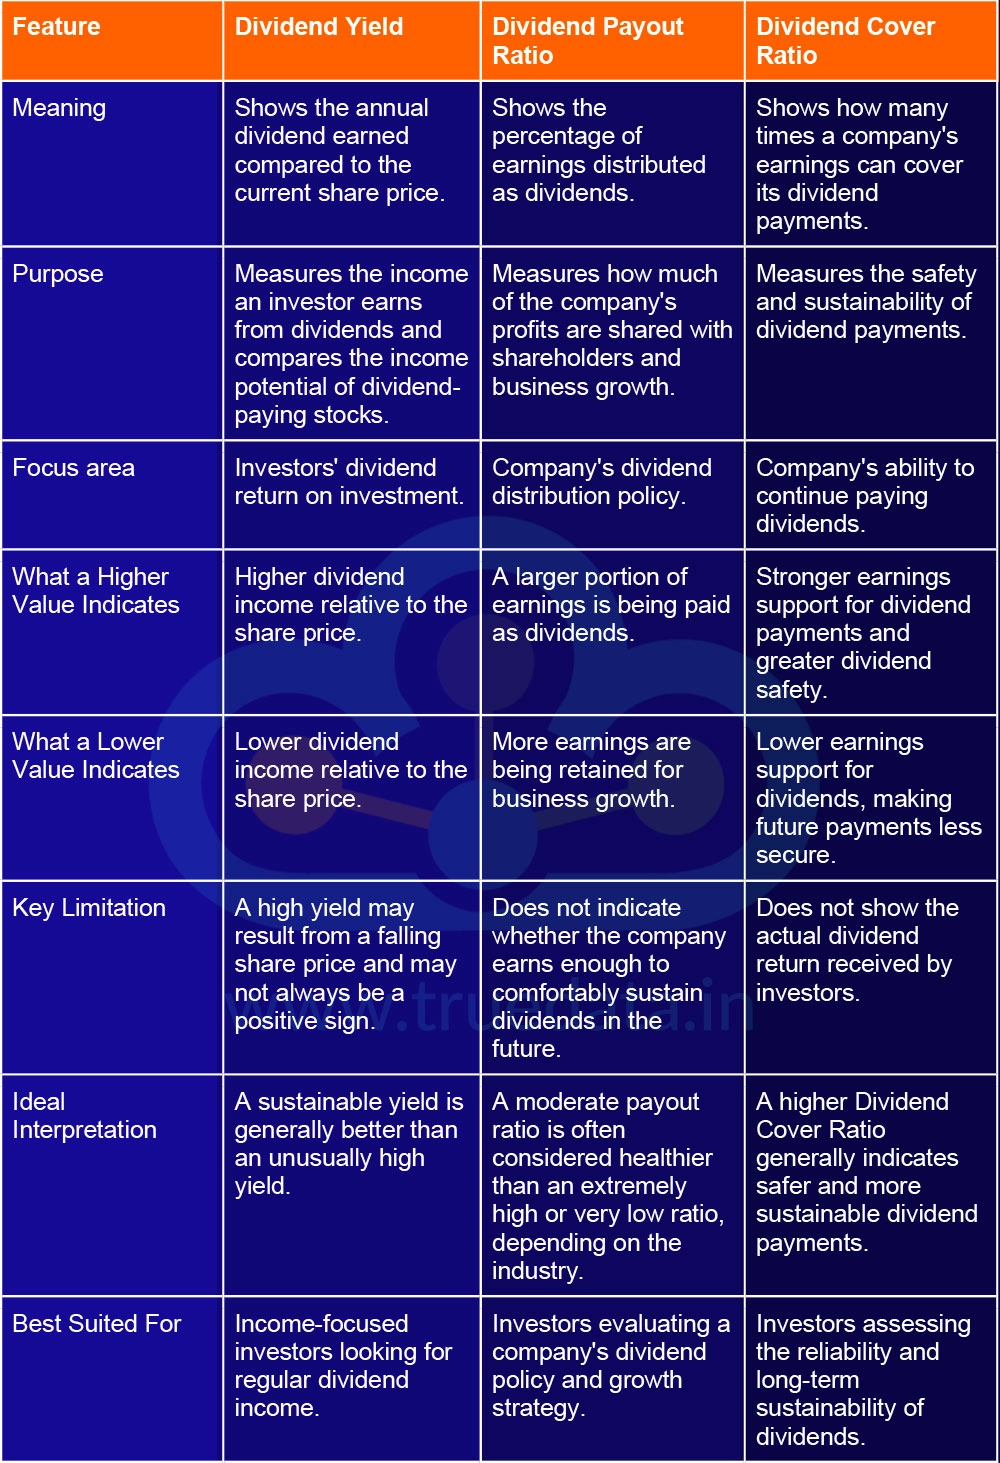
What are the Differences Between Dividend Yield, Dividend Payout Ratio and Dividend Cover Ratio?

Dividend Yield, Dividend Payout Ratio, and Dividend Cover Ratio are important dividend analysis ratios and complement each other in the overall analysis of stocks. The key differences between these ratios are explained below.

What are the Differences Between Dividend Yield, Dividend Payout Ratio and Dividend Cover Ratio

Feature

Dividend Yield

Dividend Payout Ratio

Dividend Cover Ratio

Meaning

Shows the annual dividend earned compared to the current share price.

Shows the percentage of earnings distributed as dividends.

Shows how many times a company's earnings can cover its dividend payments.

Purpose

Measures the income an investor earns from dividends and compares the income potential of dividend-paying stocks.

Measures how much of the company's profits are shared with shareholders and business growth.

Measures the safety and sustainability of dividend payments.

Focus area

Investors' dividend return on investment.

Company's dividend distribution policy.

Company's ability to continue paying dividends.

What a Higher Value Indicates

Higher dividend income relative to the share price.

A larger portion of earnings is being paid as dividends.

Stronger earnings support for dividend payments and greater dividend safety.

What a Lower Value Indicates

Lower dividend income relative to the share price.

More earnings are being retained for business growth.

Lower earnings support for dividends, making future payments less secure.

Key Limitation

A high yield may result from a falling share price and may not always be a positive sign.

Does not indicate whether the company earns enough to comfortably sustain dividends in the future.

Does not show the actual dividend return received by investors.

Ideal Interpretation

A sustainable yield is generally better than an unusually high yield.

A moderate payout ratio is often considered healthier than an extremely high or very low ratio, depending on the industry.

A higher Dividend Cover Ratio generally indicates safer and more sustainable dividend payments.

Best Suited For

Income-focused investors looking for regular dividend income.

Investors evaluating a company's dividend policy and growth strategy.

Investors assessing the reliability and long-term sustainability of dividends.

How to Use the Three Ratios Together?

how-to-use-the-three-ratio-together

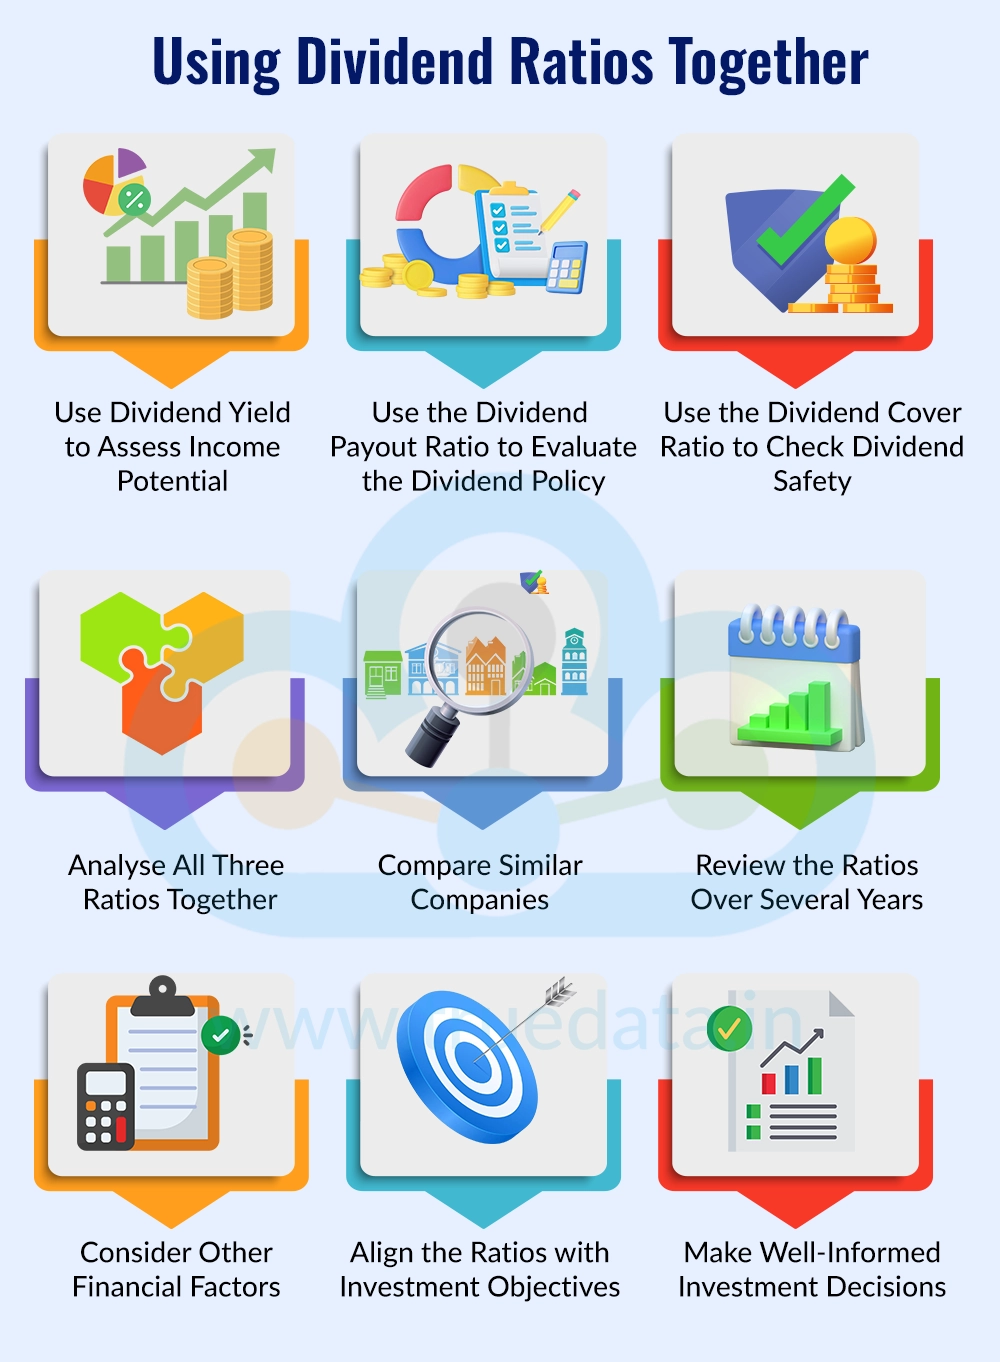
While we have analysed the meaning and differences between the three ratios, let us now focus on how to use them together for fundamental analysis of stocks. 

  • Use Dividend Yield to Assess Income Potential - Investors should begin by looking at the Dividend Yield to understand how much annual dividend income a stock offers compared to its current market price. This helps identify stocks that may provide regular income. However, Dividend Yield alone should not be the basis for making an investment decision.

  • Use the Dividend Payout Ratio to Evaluate the Dividend Policy - The next step is to analyse the Dividend Payout Ratio. This ratio shows what percentage of the company's earnings is being distributed as dividends. A reasonable payout ratio indicates that the company is rewarding shareholders while retaining enough profits to support future growth and business operations.

  • Use the Dividend Cover Ratio to Check Dividend Safety - After evaluating the Dividend Yield and Dividend Payout Ratio, an investor should examine the Dividend Cover Ratio. This ratio indicates whether the company's earnings are sufficient to comfortably cover its dividend payments. A higher Dividend Cover Ratio generally suggests that the dividends are more sustainable.

  • Analyse All Three Ratios Together - Each dividend ratio provides a different perspective. Dividend Yield measures the income received by investors, the Dividend Payout Ratio explains how much profit is distributed as dividends, and the Dividend Cover Ratio indicates how secure those dividend payments are. Analysing all three together provides a more complete understanding of a company's dividend policy.

  • Compare Similar Companies - These ratios should be compared among companies operating in the same industry. Since different sectors have different dividend policies and capital requirements, industry-wise comparisons provide more meaningful insights.

  • Review the Ratios Over Several Years - Instead of relying on one year's data, investors should examine these ratios over multiple years. Consistent Dividend Yield, Dividend Payout Ratio, and Dividend Cover Ratio often indicate stable earnings, disciplined financial management, and a reliable dividend policy.

  • Consider Other Financial Factors - The three dividend ratios should be used along with other financial measures such as earnings growth, cash flows, debt levels, profitability, and return on equity (ROE). This helps investors gain a more comprehensive understanding of the company's overall financial health.

  • Align the Ratios with Investment Objectives - An income-focused investor may prefer companies with a sustainable Dividend Yield, a reasonable Dividend Payout Ratio, and a healthy Dividend Cover Ratio. Growth-focused investors may be comfortable with a lower Dividend Yield and Dividend Payout Ratio if the company is reinvesting its earnings to achieve higher long-term growth.

  • Make Well-Informed Investment Decisions - No single dividend ratio can determine whether a stock is a good investment. By using Dividend Yield, Dividend Payout Ratio, and Dividend Cover Ratio together, investors can better evaluate a company's dividend income, dividend sustainability, and financial strength, leading to more informed investment decisions.

Conclusion

Dividend-paying stocks can be a valuable addition to an investment portfolio, but evaluating them requires more than simply looking at the dividend amount. Dividend Yield helps investors understand the income they may earn, the Dividend Payout Ratio shows how much of the company's earnings are distributed as dividends, and the Dividend Cover Ratio indicates whether those dividends are supported by sufficient profits. Using all three ratios together and analysing them alongside other financial factors such as earnings growth, cash flows, debt levels, and overall business performance can help investors make more informed decisions and choose dividend stocks that offer both regular income and long-term financial stability.

This is yet another addition to our series on understanding dividends and financial ratios. Let us know your thoughts on the topic or if you need further information on the same and we will address them soon. 

Till then, Happy Reading!


Read More: BVPS vs EPS vs Price-to-Book Ratio - Key Differences Explained

Frequently Asked Questions

Neither ratio is more important on its own as they measure different aspects of dividends. Dividend Yield shows the income an investor receives, while the Dividend Payout Ratio shows whether the company can sustainably pay those dividends, so both should be analysed together.

Yes. A company with a low Dividend Yield can still be a good investment if it is reinvesting its profits to grow the business, which may lead to higher earnings and share price appreciation over the long term.

Investors should analyse all three dividend ratios together because each one provides different information. Dividend Yield shows dividend income, Dividend Payout Ratio shows how much profit is distributed, and Dividend Cover Ratio shows whether the dividend is sustainable. Together, they provide a more complete picture of a company's dividend quality and financial strength.

There is no single best dividend ratio for long-term investors. They should use Dividend Yield, Dividend Payout Ratio, and Dividend Cover Ratio together to evaluate a company's dividend income, sustainability, and financial strength before investing.

Yes. A company can have a high Dividend Yield and a low Dividend Cover if it pays high dividends despite having weak earnings, which may indicate that the dividend is difficult to sustain over the long term.
Marisha Bhatt

Marisha Bhatt is a financial content writer @TrueData.
She writes with the sole aim of simplifying complex financial concepts and jargon while attempting to clarify technical and fundamental analysis concepts of the stock markets. The ultimate goal is to spread vital knowledge and benefit the maximum audience. Her Chartered Accountant background acts as the knowledge base to help clarify crucial concepts and create a sound investment portfolio.

0 Comments

Related Articles

SEE ALL
Corporate Data
Corporate Data
Investing Smarter: The Power of Corporate Data and Market Sentiment Analysis

Thestock market never stands still, and prices swing constantly with every new h...

Corporate Data
Corporate Data
Understanding Quarterly vs Annual Corporate Data

Corporate data is more than just the numbers of a company. They can show what is...

Corporate Data
Corporate Data
Key Corporate Data Every Investor Must Track Before Investing

Investing is not just about numbers on a screen. It is about understanding the s...