
Investing in stocks is one of the most effective ways to build long-term wealth. To make the right choices, investors often rely on key fundamental analysis metrics, and one of the most important among them is Earnings Per Share (EPS). We have discussed the meaning and importance of EPS in detail in our earlier blog. However, most analysts and seasoned investors focus on trailing EPS rather than basic EPS. Curious to know why? Dive into this blog to understand what trailing EPS is and how it can help you make smarter, more confident investment decisions.

Earnings Per Share (EPS) means the profit earned by a company for each share of its stock. It shows how much money a company makes for every share held by investors and is an important measure of profitability. EPS TTM refers to the Earnings Per Share - Trailing Twelve Months. This means the EPS is calculated based on the company’s actual earnings from the last 12 months, or the most recent four quarters. In simple terms, it indicates the profit per share the company made over the past year. EPS TTM provides a realistic picture of a company’s recent financial performance, unlike projected or forward EPS, which is based on future estimates. Investors often use EPS TTM to compare companies within the same sector or to calculate the Price-to-Earnings (P/E Ratio), which helps decide whether a stock is undervalued or overvalued. As it is based on real, historical data, EPS TTM is considered one of the most reliable indicators for judging a company’s profitability and consistency in performance.

Earnings Per Share (EPS) tells you how much profit a company earns for each of its outstanding shares. It helps investors understand how profitable a company is on a per-share basis. The formula to calculate EPS is explained below.
EPS = (Net Profit - Preferred Dividends) / Number of Outstanding Shares
Where,
Net Profit = Total profit after tax as shown in the company’s income statement.
Preferred Dividends = Dividends paid to preference shareholders before equity shareholders.
Outstanding Shares = Total number of outstanding equity shares currently held by shareholders of the company.
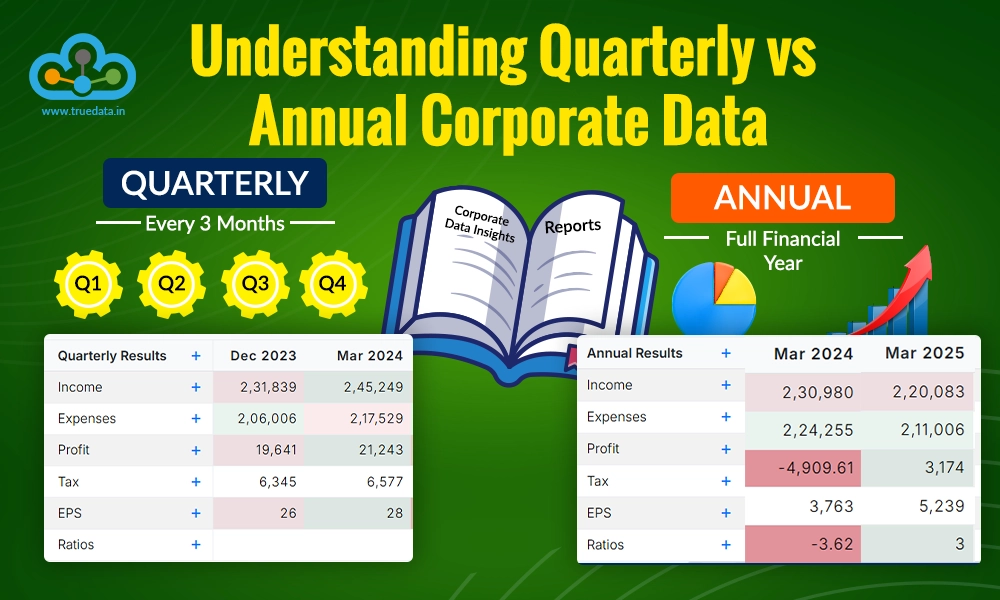
This calculation represents the basic EPS, which is usually calculated on an annual basis. Trailing Twelve Months EPS, on the other hand, considers EPS reported per quarter for the previous twelve months.
The calculation of EPS TTM is calculated using the same formula, but the data considered is for each quarter as reported in the quarterly statements.
Let us understand the calculation of EPS TTM using a simple example.
Consider Company ABC, which has the following data. Earnings reported for Q1, Q2, Q3 and Q4 of FY 23-24 are Rs. 12 crores, Rs. 14 crores, Rs. 10 crores and Rs. 16 crores, respectively. The preference dividend to be paid to preference shareholders is Rs. 1 crore per quarter. The company has 2 crore outstanding shares. The EPS TTM for company ABC is calculated as follows,
The EPS TTM for Company ABC = EPS Q1+ EPS Q2+ EPS Q3+ EPS Q4 = Rs. 24 per share.

EPS TTM is often regarded as a reliable measure of a company’s performance and its growth trajectory. The importance of using EPS TTM for fundamental analysis of a company is explained below.
EPS TTM shows how much profit a company has earned per share during the past 12 months. Since it is calculated using the company’s actual reported profits, it provides a real and updated picture of the company’s recent financial performance. This helps investors assess how well the company has performed over time, instead of relying on forecasts or assumptions about the future.
EPS TTM enables investors to compare different companies within the same industry on a level playing field, allowing them to make informed decisions. Because it covers the same 12-month period for all companies, the comparison is consistent and meaningful. For instance, if two banks or IT firms are being compared, the one with a higher trailing EPS is likely to have better profit performance per share over the last year.
One of the primary applications of EPS TTM is in calculating the Price-to-Earnings (P/E) ratio, a common method for valuing stocks in India. The formula for calculating the P/E Ratio is,
P/E Ratio = Current Share Price / EPS (TTM)
Using trailing EPS ensures that the valuation is based on real, historical data rather than on estimated future earnings. This helps investors understand whether a company’s stock price is reasonable, undervalued, or overvalued based on its recent performance.
A steady or growing EPS TTM indicates that the company has been consistently profitable over the trailing 12 months. This consistency reflects good management practices, strong demand for the company’s products or services, and overall business health. On the other hand, a declining EPS TTM could signal potential challenges in profitability or market performance.
Companies that maintain a rising EPS TTM often attract more investor confidence. It reassures shareholders that the company is capable of generating profits regularly and efficiently managing its operations. In India’s growing stock market, a strong EPS TTM track record is often viewed as a sign of reliability and long-term potential.
EPS TTM is a straightforward and reliable metric for evaluating stocks. It enables them to assess a company’s recent performance, compare it with that of its peers, and make informed investment decisions. Since it focuses on actual earnings, it reduces the risk of being misled by overly optimistic projections or one-time gains.

Earnings Per Share (EPS) tells how much profit a company earns for each share it has issued. However, depending on the time period used for calculation, the meaning and use of EPS can differ. The common types are EPS TTM and Annual EPS. Each provides a slightly different view of a company’s earnings performance.

While the EPS TTM is a useful and widely used metric, it also has several limitations that investors should be aware of. It shows past performance, but may not always reflect the full picture of a company’s current or future earnings potential.
It Reflects Past Performance, Not the Future - EPS TTM is calculated using the company’s earnings for the past 12 months. This means it only shows what has already happened, not what is going to happen. If the company’s financial position, market conditions, or business outlook have changed recently, the EPS TTM may not give an accurate idea of its future profitability.
It Does Not Consider Recent Changes - EPS TTM includes data from the last four quarters, even if some of those results are quite old. If the company’s earnings have recently improved or declined sharply, the older quarters can dilute the impact of these changes, giving an outdated picture of performance.
It May Be Affected by One-Time Events - Sometimes, a company’s profits or losses in a particular quarter are influenced by one-time items such as asset sales, legal settlements, or extraordinary expenses. Such events can distort the EPS TTM, making it look unusually high or low, even though they may not reflect the company’s regular business performance.
It Ignores Future Growth Potential - Investors often make decisions based on how a company is expected to grow in the future. However, EPS TTM does not include any future projections or expected profit improvements. As a result, it might undervalue fast-growing companies or overvalue those that are slowing down.
It May Not Be Comparable Across Sectors - Different industries have different earning patterns. For example, seasonal businesses such as agriculture and tourism may experience uneven quarterly profits, whereas others like IT or banking may have steady earnings. In such cases, comparing companies only by their EPS TTM can be unfair or inaccurate.
It Can Be Misleading During Economic Changes - When the economy or industry environment changes, for example, during a slowdown or recovery, the EPS TTM might not capture the current business reality. A company that suffered losses earlier but is now improving may still show a weak trailing EPS, which can mislead investors who rely only on this figure.
It Ignores Share Dilution or Buybacks - If a company issues new shares or buys back shares, the number of outstanding shares changes. EPS TTM may not immediately reflect these changes, which can affect the accuracy of the per-share earnings figure.
EPS TTM is a key measure of the company’s financial performance, providing strategic insights into the company’s earnings. It gives a reliable view of a company’s recent performance. However, it should not be used in isolation. Investors should also consider other factors, such as forward EPS, revenue growth, industry trends, and management guidance, to make a well-rounded investment decision.
This article is an extension of our previous discussion on EPS. It helps in understanding this fundamental concept in a better light and thereby in better company analysis. Let us know your thoughts on this topic, or if you require additional information, and we will address it soon.
Till then, Happy Reading!
Read More: Understanding Profit and Loss Statement with an Example
Marisha Bhatt is a financial content writer @TrueData.
She writes with the sole aim of simplifying complex financial concepts and jargon while attempting to clarify technical and fundamental analysis concepts of the stock markets. The ultimate goal is to spread vital knowledge and benefit the maximum audience. Her Chartered Accountant background acts as the knowledge base to help clarify crucial concepts and create a sound investment portfolio.
Good post.. how to calculate annual eps growth rate for year over year
Thank you for appreciating our work! To calculate annual EPS growth year over year, you can subtract last year’s EPS from the current year’s EPS, divide the result by last year’s EPS, and multiply by 100 to get the percentage growth. We hope this addresses your query. Thank you for reaching us. Stay tuned for more interesting content on TrueData!
Informative. thanks for sharing this
Glad you like our work! Keep reading and engaging with TrueData for more informative content!
good article
Thank you for appreciating our work! Watch this space for more interesting content!
GOOD
Glad you like our work! Stay tuned for more interesting content on TrueData!
EPS TTM not always possible correct mam
Yes, that can be correct in certain cases. EPS TTM may not always be available or meaningful, especially for newly listed companies or firms with irregular or negative earnings.
Love your articles
Thank you so much for the love and encouragement! We are really glad you enjoy our articles and truly appreciate your support!
Good post
Thanks a lot! Glad you found it useful, appreciate you reading and sharing your feedback.
good article
Thank you! Glad you liked the article, appreciate your support and encouragement.
Good blog
Thank you, glad you like our post!
Excellent Blog
Thanks a lot ! Glad you liked it.

Thestock market never stands still, and prices swing constantly with every new h...
Corporate data is more than just the numbers of a company. They can show what is...

Investing is not just about numbers on a screen. It is about understanding the s...