The profit and loss statement is a vital part of the financial statements of a company, as it provides a snapshot of the income and expenses of the company during the target period. This enables users to understand the overall profitability of the company and its ability to grow and meet its future plans. We have seen a detailed analysis of the revenue or the income side of this statement in our previous blog. Let us now focus on the remaining components of this statement and understand them in a better light.
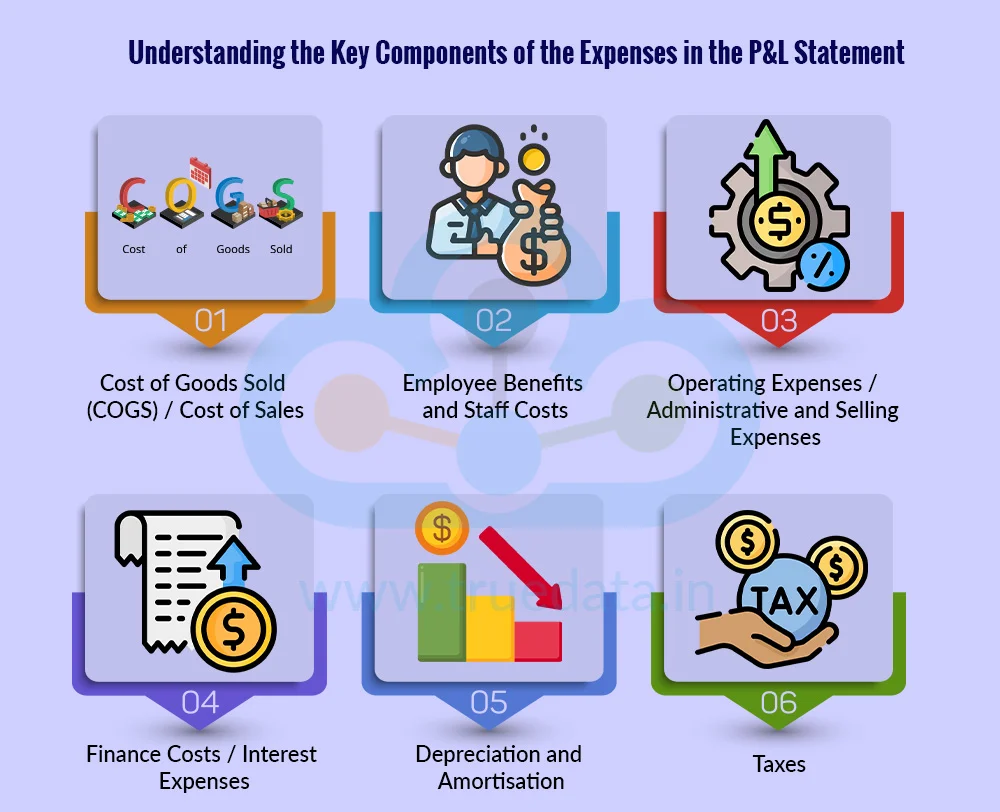
The expense side of the P&L statement shows all the costs a company incurs to run its business. After deducting these expenses from revenue, we arrive at different levels of profit, which indicate the company’s financial health. Understanding each component helps investors see where money is spent, how efficiently the company operates, and how profits are generated.
COGS is the cost directly linked to producing goods or delivering services. It includes raw materials, labour, and manufacturing overheads for a product-based company, or project-specific costs for a service company. Managing COGS efficiently is critical because it directly affects gross profit. A lower COGS relative to revenue means higher gross profit margins, showing the company is producing or delivering services efficiently. Investors should monitor trends in COGS to assess operational efficiency and pricing power.
This includes salaries, wages, bonuses, provident fund contributions, gratuity, and other employee-related expenses. Employees are essential for running operations. Rising staff costs are acceptable if they are accompanied by higher productivity or revenue growth. If employee costs grow faster than revenue, profitability may be under pressure. Investors should evaluate whether the company is balancing talent costs with performance.
These are costs incurred to run day-to-day business operations, excluding COGS. Examples of these expenses include rent, utilities, office expenses, marketing, travel, and depreciation of fixed assets. Operating expenses directly affect operating profit. Keeping these expenses under control while increasing sales indicates strong management efficiency. Investors should watch if expenses are growing in line with revenue, as uncontrolled growth can reduce profits.
These are the costs for borrowing money, including interest on loans, bonds, and other credit facilities. In other words, they are the costs paid to the short-term and long-term lenders to meet the financing needs. High finance costs have a direct impact on the profit before tax (PBT). Companies with large borrowings need to ensure they can service debt without hurting profitability. Investors can assess whether the company’s leverage is sustainable by comparing interest costs to earnings.
Depreciation is the cost of the usual wear and tear of assets that is reduced from their original cost and spread over the useful life of the asset. Amortisation is similar in nature and is applied to intangible assets (like patents, software, or goodwill). These are non-cash expenses, which means the company does not pay cash but reduces reported profit for accounting purposes. Investors should consider depreciation when evaluating cash flow, as a company may be generating strong cash even if net profit is lower.
Every company in India is treated as a separate legal entity and is liable to pay taxes under the corporate tax structure as prescribed under the Income Tax Act. The current corporate tax rate in India is 25% for domestic companies (effective from AY 2024-25) and 35% for foreign companies. These taxes are paid on the taxable profits of the company and also have a direct impact on the net profits. Investors track tax trends to understand the company’s effective tax rate and after-tax profitability.
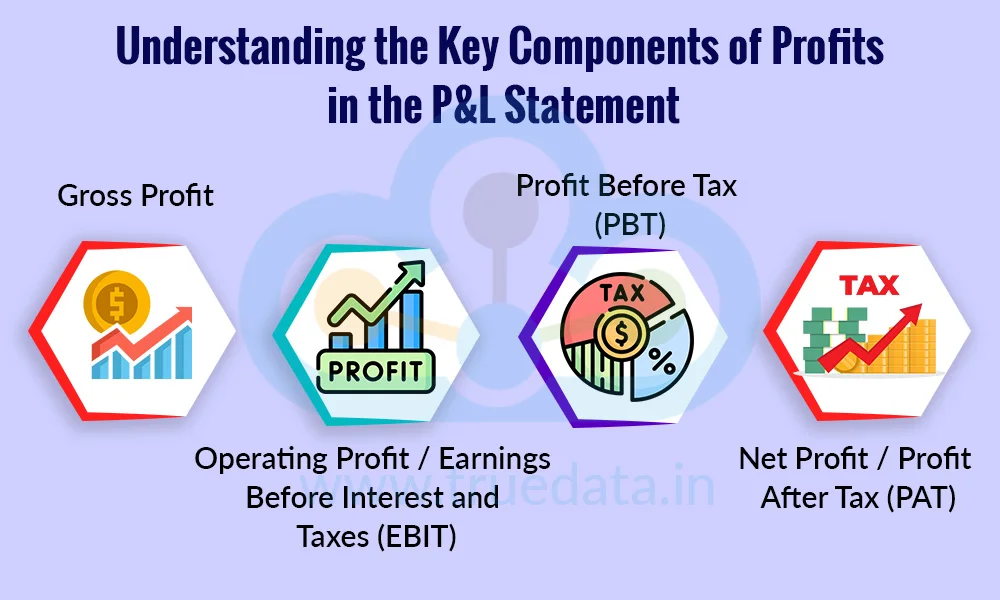
Profit in the P&L statement shows the money left after all expenses are deducted from revenue. It is reported in multiple levels, each providing a different perspective on the company’s financial performance. Understanding these levels helps investors analyse how efficiently the company is operating, how it manages costs, and how much value it creates for shareholders.
Gross profit is calculated as Revenue minus Cost of Goods Sold (COGS). COGS includes the direct costs of producing goods or delivering services, such as raw materials, labour, and production overheads. Gross profit reflects how efficiently a company is converting sales into profit before considering other operating costs. A higher gross profit margin indicates strong pricing power and operational efficiency, meaning the company can produce or deliver its goods/services at a lower cost relative to revenue. Investors often compare gross profit margins across quarters and with industry peers to judge core business performance.
Operating profit, also called EBIT, is gross profit minus operating expenses, which include administrative costs, selling expenses, and other day-to-day operational costs. Operating profit shows how profitable the company’s core business operations are, ignoring the effects of financing and taxes. A growing EBIT indicates that the company is managing its operating costs efficiently while increasing revenue. Investors use EBIT to assess the company’s ability to generate profits from its main business before external factors like loans or taxation impact the results.
PBT is calculated as operating profit minus finance costs (like interest on loans) plus or minus any other income (such as investment income or one-time gains). PBT shows the company’s total profitability before tax obligations, reflecting the combined impact of operations, financing, and other non-core activities. PBT is an important aspect to understand how financing decisions or side income affect profitability. It also helps compare companies with different tax rates or capital structures.
Net profit, or PAT, is the profit remaining after deducting taxes from PBT. It represents the actual earnings available to shareholders. PAT is the most important measure of a company’s profitability. Consistent growth in PAT signals a healthy, sustainable business. Investors often use PAT to calculate financial ratios like Earnings Per Share (EPS), return on equity, and dividend payout potential. PAT also reflects how efficiently the company manages costs, financing, and taxes to deliver value to shareholders.
.jpg)
Earnings Per Share (EPS) is a key measure of a company’s profitability that shows how much profit is earned for each share held by investors. It is calculated by dividing the Net Profit (PAT) by the weighted average outstanding shares. However, it is important to consider the true net profit available to equity shareholders. Hence, the preference dividend to be paid to the preference shareholders (whether outstanding or paid) has to be deducted from the net profits. Also, the weighted average number of outstanding shares is considered to account for any changes in the number of shares during the period, giving a fair measure of earnings per share.
EPS = Net Profit - Preferred Dividend / Weighted Average Number of Outstanding Shares
EPS gives investors a clear idea of the earnings generated per share, making it easier to compare profitability across companies of different sizes or to track performance over time. A rising EPS usually indicates that the company is increasing its profitability and creating more value for shareholders. Conversely, a declining EPS may signal reduced profits or an increase in the number of shares without a proportional increase in earnings.
The increase and decrease in expenses, profits and earnings can provide significant insights to investors and other stakeholders of the company. The interpretation of this increase and decrease is explained hereunder.
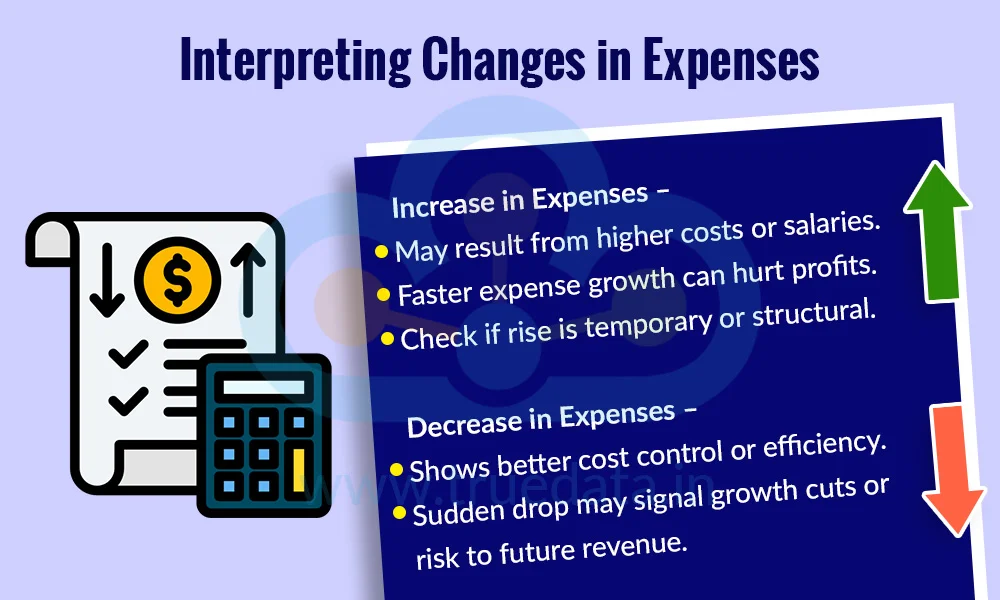
Increase in Expenses -
It could be due to higher raw material costs, staff salaries, or operating costs.
If expenses grow faster than revenue, profitability may be under pressure.
Investors should check if the increase is temporary, seasonal, or structural.
Decrease in Expenses -
It may indicate better cost management or operational efficiency.
A sudden drop might also come from reduced investment in growth or staff cuts, which could affect future revenue.
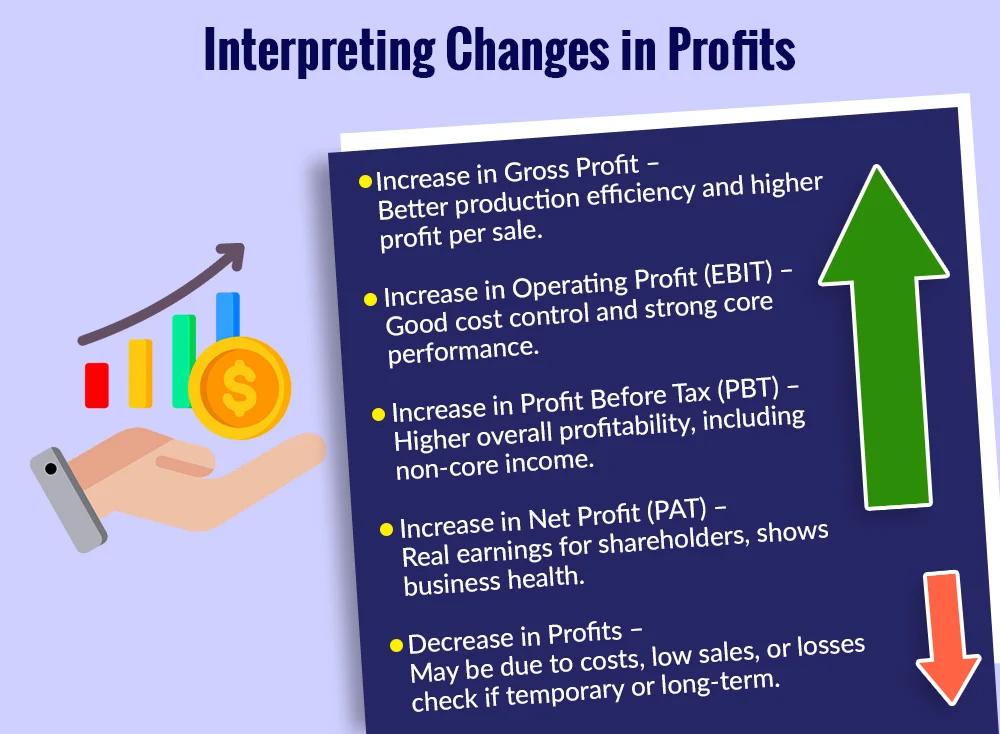
Increase in Gross Profit -
Shows better efficiency in producing goods or delivering services.
A higher gross profit margin means the company is generating more money from each unit of sale.
Increase in Operating Profit (EBIT) -
Indicates that the company is controlling operating costs while growing revenue.
Shows strong core business performance.
Increase in Profit Before Tax (PBT) -
Reflects overall profitability, including non-core income and financing effects.
Rising PBT indicates the company is earning well from both operations and investments.
Increase in Net Profit / PAT -
Shows real earnings available to shareholders.
Consistent PAT growth signals a healthy, sustainable business.
Decrease in any profit level -
Could result from higher costs, lower sales, increased interest, or one-time losses.
Investors should analyse the reason to decide whether it is temporary or a long-term concern.
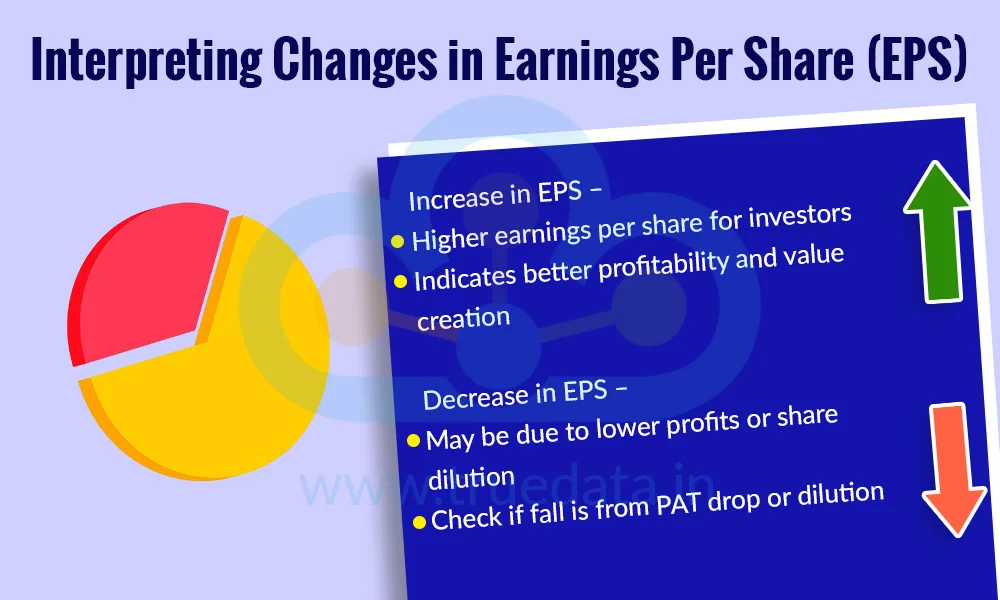
Increase in EPS -
Shows shareholders are earning more per share.
Indicates improving profitability and value creation for investors.
Decrease in EPS -
It could be due to falling profits or the issuance of new shares, leading to dilution.
Investors should check if the decrease is from lower PAT or share dilution.
Profit and loss statement, like any other financial statement of the company, has to comply with the provisions of SEBI, Companies Act 2013 and relevant accounting standards with respect to its preparation and presentation. We have reviewed the reporting requirements for the revenue side of the profit and loss statement. Let us now focus on the reporting laws for either component of this statement.
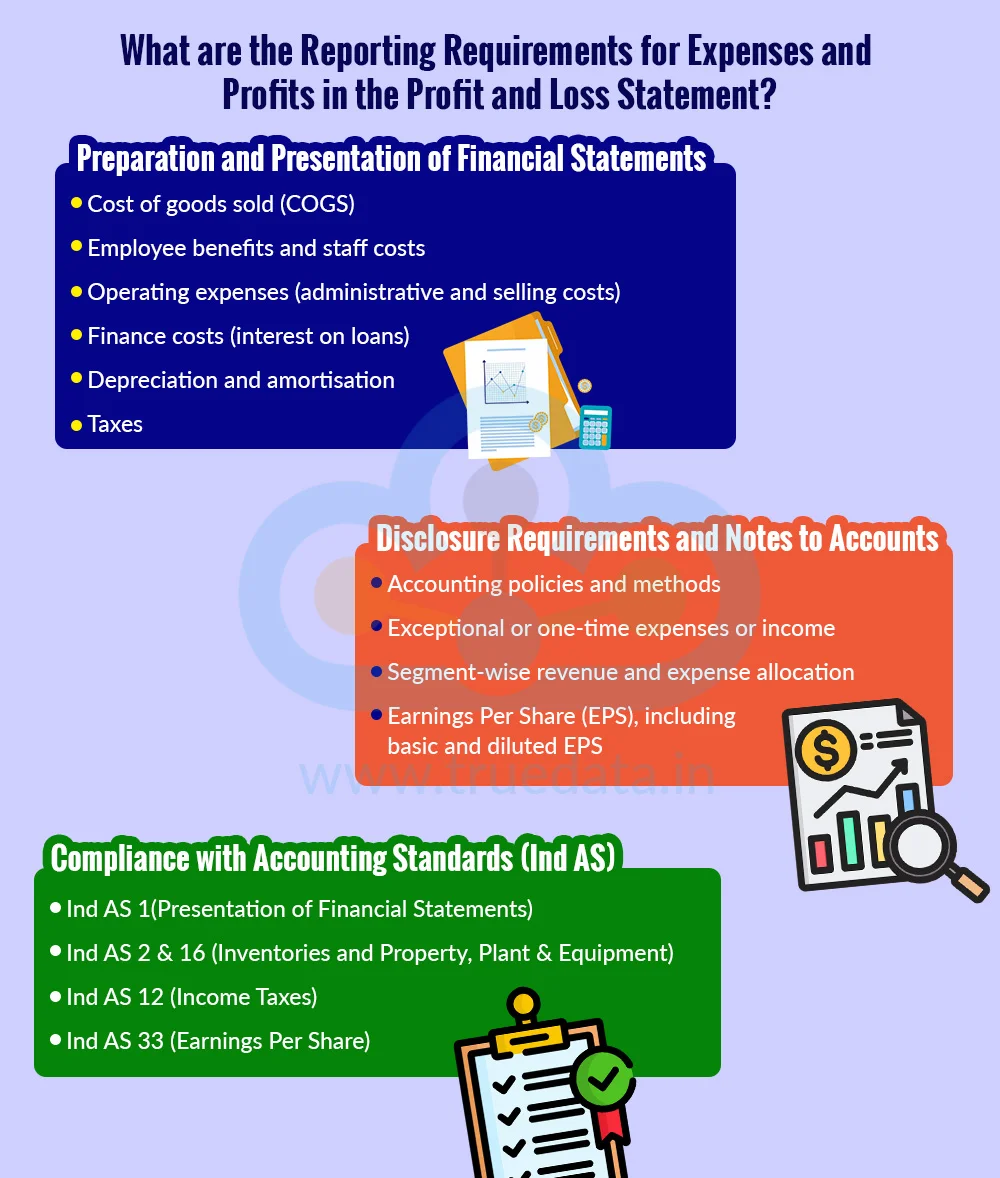
Companies must prepare financial statements, including the P&L, that give a true and fair view of the company’s financial performance. Expenses must be clearly classified under major categories as per the reporting norms under the Companies Act 2013.
Cost of goods sold (COGS)
Employee benefits and staff costs
Operating expenses (administrative and selling costs)
Finance costs (interest on loans)
Depreciation and amortisation
Taxes
Profits must be presented at multiple levels, like Gross Profit, Operating Profit/EBIT, Profit Before Tax (PBT), and Net Profit/Profit After Tax (PAT).
Companies must provide detailed notes to accounts, explaining,
Accounting policies and methods
Exceptional or one-time expenses or income
Segment-wise revenue and expense allocation
Earnings Per Share (EPS), including basic and diluted EPS
Any significant changes in expenses or profits, such as restructuring costs or unusual gains, must be disclosed in management commentary or investor communications.
Ind AS 1(Presentation of Financial Statements) - Classify expenses either by nature (salaries, depreciation) or function (cost of sales, administrative).
Ind AS 2 & 16 (Inventories and Property, Plant & Equipment) - Ensure correct recognition of COGS, depreciation, and amortisation.
Ind AS 12 (Income Taxes) - Ensure proper recognition and disclosure of tax expenses.
Ind AS 33 (Earnings Per Share) - Requires disclosure of basic and diluted EPS based on PAT.
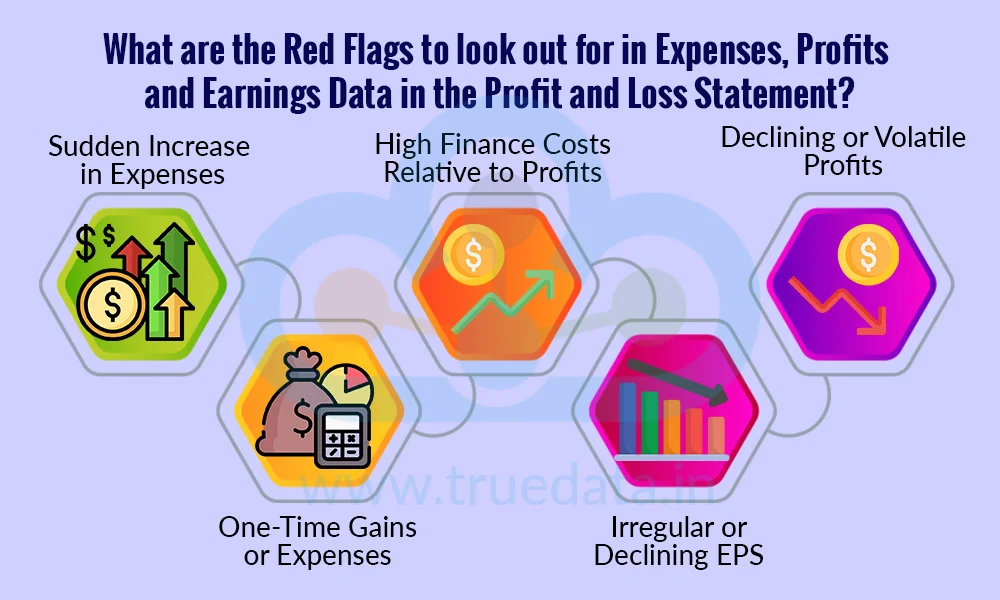
Investors can get deeper insights into the profitability of the company through a thorough analysis of the profit and loss statement. However, this statement can also provide information about any red flags that can indicate potential drawbacks or errors in the company. Some of these red flags include,
Sudden Increase in Expenses - Investors should be cautious if a company reports a sharp rise in expenses without a corresponding increase in revenue. This could indicate inefficient operations, higher raw material costs, rising salaries, or uncontrolled overheads, which may put pressure on profitability.
High Finance Costs Relative to Profits - If interest expenses are rising faster than profits, it may indicate that the company is heavily leveraged. High finance costs can reduce net profit and may raise concerns about the company’s ability to service debt sustainably.
Declining or Volatile Profits - A significant drop or large fluctuations in gross, operating, or net profit may signal operational problems, loss of market share, or mismanagement of costs. Investors should examine whether these changes are temporary or long-term and whether they stem from the core business or one-time items.
One-Time Gains or Expenses - Frequent reliance on exceptional income (like asset sales or government incentives) to boost profits may mask weaknesses in core operations. Conversely, one-time expenses may temporarily reduce profits but do not reflect ongoing operational efficiency.
Irregular or Declining EPS - A declining EPS or a large difference between basic and diluted EPS may indicate profit dilution due to new shares, convertible securities, or declining net profit. Investors should check whether EPS trends reflect real profitability or accounting adjustments.
The expenses, profits, and EPS section of the Profit and Loss statement provides investors with a clear picture of how a company manages its costs, generates earnings, and delivers value to shareholders. By carefully analysing these sections, investors can identify efficiency, profitability trends, and potential red flags, enabling informed investment decisions and long-term financial assessment.
This article is an extension of our series on understanding the P&L statement in a better light. Stay tuned for further analysis of the profit and loss statement using an example.
Till then, Happy Reading!
Read More: How to Spot Financial Fraud and Accounting Manipulation from Financial Statements?

Thestock market never stands still, and prices swing constantly with every new h...

Net profits in the P&L statement are usually a sign of a healthy company. Ho...
Theprofit and loss statement is the second part of the company's financial state...