
When we talk about common ratios for analysing a company, the most common name that comes to mind is the P/E ratio. However, other important ratios like the PB ratio are also important parameters for analysing the company at the micro and macro levels. So, what is a better parameter, and what is the difference between the two? Read on to know all about these ratios and the key differences between them.
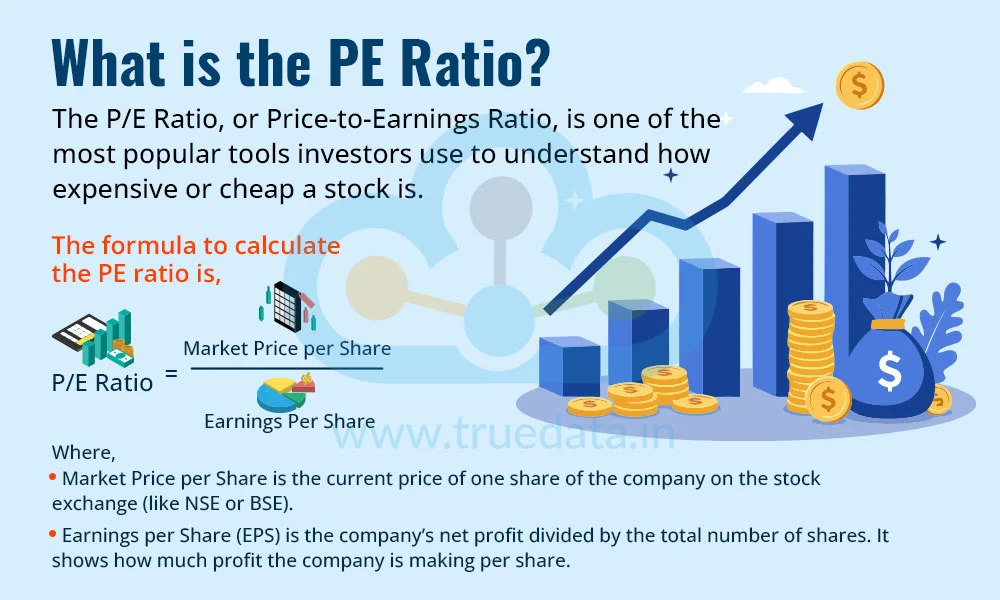
The P/E ratio, or Price-to-Earnings Ratio, is one of the most popular tools investors use to understand how expensive or cheap a stock is. It tells how much investors are willing to pay for Re.1 of a company’s earnings. It helps investors know whether a stock is overvalued, undervalued, or fairly valued compared to its earnings.
To put it simply, if a stock has a P/E ratio of 20, it means investors are ready to pay Rs. 20 for every Re. 1 the company earns in profit each year. This ratio is useful for comparing companies in the same sector or industry, or for understanding how expensive a stock is compared to its own past performance.
The formula to calculate the PE ratio is,
P/E Ratio = Market Price per Share / Earnings Per Share
Where,
Market Price per Share is the current price of one share of the company on the stock exchange (like NSE or BSE).
Earnings Per Share (EPS) is the company’s net profit divided by the total number of shares. It shows how much profit the company is making per share.
Let us understand the calculation of the P/E ratio using a small example.

Consider ABC Ltd., listed on the NSE with the following data,
The current market price of one share of ABC Ltd. is Rs. 200.
The earnings per share (EPS) of ABC Ltd. for the past 12 months are Rs. 10.
The PE ratio for ABC Ltd. will be calculated as follows,
P/E Ratio = Market Price per Share / Earnings Per Share
PE Ratio = 200/10 = 20
Interpretation,
This means that investors are willing to pay Rs. 20 for every Re. 1 of earnings that ABC Ltd. makes. In other words, the market has priced this stock 20 times its annual earnings.
P/E ratio is an important analysis tool that provides valuable insights for investors and companies alike. The uses of the P/E Ratio can be explained as hereunder.

Compare with Industry Average - Investors can use the PE ratio to compare a company with its peers in the same industry. For example, an auto company with a P/E ratio of 25 and the industry average of 15 implies that the said company may be overvalued, or it could mean it is expected to grow faster.
Check Against Historical PE - Investors can check the company’s PE over the past 5–10 years. If it is much higher now than usual, the stock might be overvalued. If it is lower, it might be a bargain if the business is still strong.
Evaluate Growth Potential - A higher PE ratio is not always bad. Sometimes, companies with high growth potential (like in the tech sector) have high P/Es because investors expect strong future profits. However, investors should always check if the growth is realistic.
Use with Other Ratios - Investors should not make decisions using only the PE ratio. It is advisable to combine it with other ratios like PEG Ratio (Price/Earnings to Growth), Debt-to-Equity, and Return on Equity (ROE) for a fuller picture.

Understand Market Perception - Companies can use the PE ratio to see how the market values them. A high PE might show that investors trust the company’s future growth. A low PE might mean the market has concerns.
Benchmark Against Peers - Management can compare its PE with that of competitors. If it is much lower, they may investigate whether there are image issues, a lack of visibility, or financial weaknesses to fix.
Guide Investor Communication - Companies with high PE ratios should focus on delivering strong earnings and keeping promises. If they fall short, stock prices may drop quickly because expectations were high.
Valuation in Fundraising - When raising money from investors or issuing new shares, companies with a higher PE ratio can often command better valuations. It helps in negotiations with institutional investors.
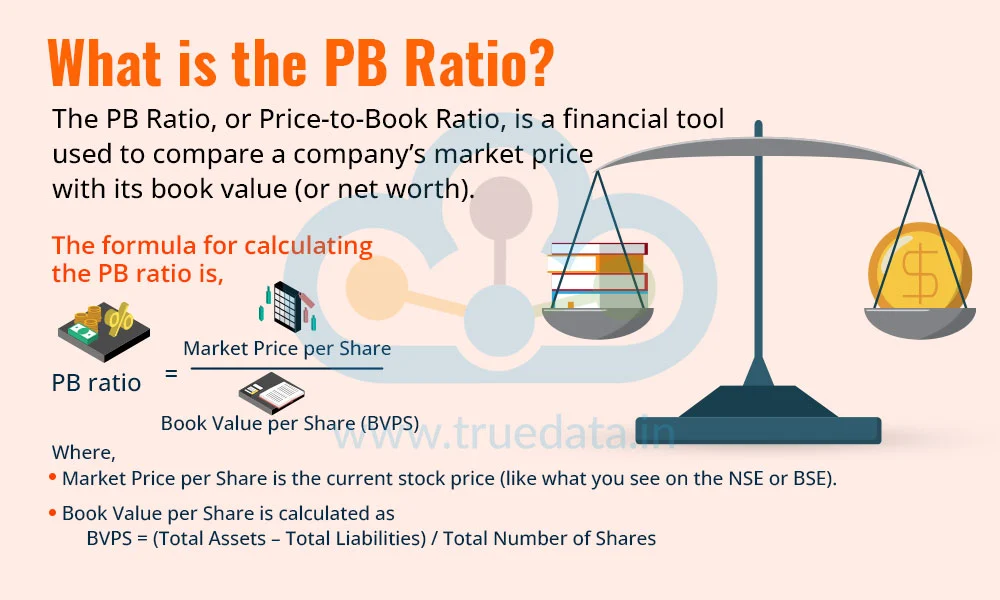
The PB Ratio, or Price-to-Book Ratio, is a financial tool used to compare a company’s market price with its book value (or net worth). It tells how much investors are paying for each rupee of a company’s net assets. A PB ratio of 1 means the market is valuing the company exactly at its book value. Similarly, when the P/B ratio is more than 1, the stock is trading above its book value (investors expect growth or future profits), while a P/B ratio lower than 1 implies that the stock is trading below its book value (it might be undervalued or in trouble).
This ratio is especially useful for analysing financial companies like banks and NBFCs, and also for companies with a lot of physical assets (like real estate or manufacturing).
The formula for calculating the PB ratio is,
PB ratio = Market Price per Share / Book Value per Share (BVPS)
Where,
Market Price per Share is the current stock price (like what you see on the NSE or BSE).
Book Value per Share is calculated as
BVPS = (Total Assets – Total Liabilities) / Total Number of Shares
Let us understand the calculation of the P/B ratio using a simple example.
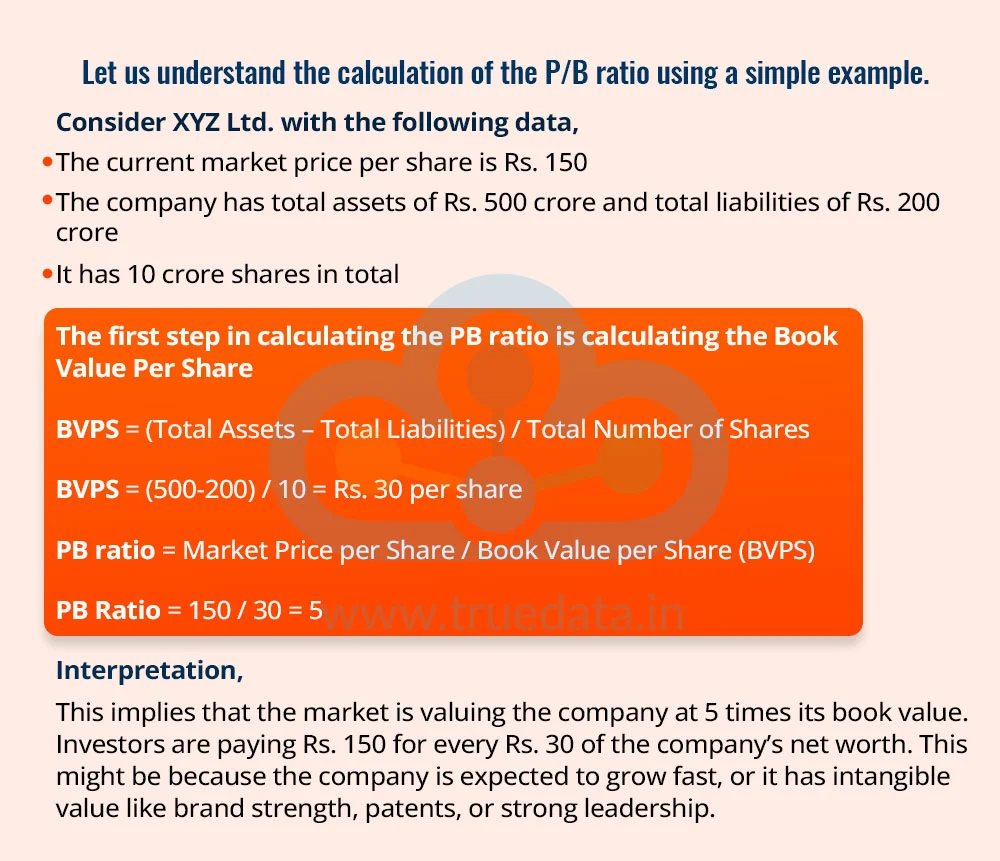
Consider XYZ Ltd. with the following data,
The current market price per share is Rs. 150
The company has total assets of Rs. 500 crore and total liabilities of Rs. 200 crore
It has 10 crore shares in total
The first step in calculating the PB ratio is calculating the Book Value Per Share
BVPS = (Total Assets – Total Liabilities) / Total Number of Shares
BVPS = (500-200) / 10 = Rs. 30 per share
PB ratio = Market Price per Share / Book Value per Share (BVPS)
PB Ratio = 150 / 30 = 5
Interpretation,
This implies that the market is valuing the company at 5 times its book value. Investors are paying Rs. 150 for every Rs. 30 of the company’s net worth. This might be because the company is expected to grow fast, or it has intangible value like brand strength, patents, or strong leadership.
The P/B Ratio helps compare the valuations of companies and their relative position in the industry as well as among their peers. The uses of the PB ratio in making informed decisions are explained below.
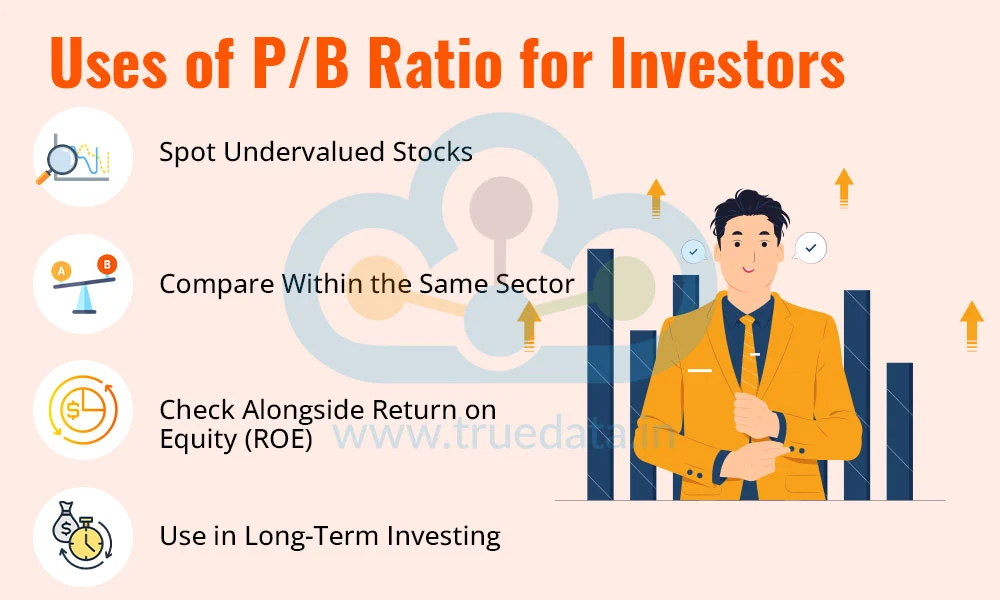
Spot Undervalued Stocks - If the PB ratio is below 1, it might mean the stock is trading for less than the value of its assets. This can be a sign of an undervalued stock, especially if the company has stable earnings and no major problems. But always check the reason for the low PB ratio.
Compare Within the Same Sector - Different industries have different ideal PB ratios. For example, banks and NBFCs are often judged by the PB ratio more than the PE ratio. So, when you compare, do it within the same sector. A PB of 1.5 might be high for a PSU bank, but normal for a private bank.
Check Alongside Return on Equity (ROE) - Use the PB ratio along with ROE. If a company has a high ROE and a low PB, it could be a strong investment. This means the company is giving good returns on its net worth and still looks undervalued.
Use in Long-Term Investing - The PB ratio helps long-term investors find companies with strong balance sheets. It is especially useful in bear markets or uncertain times when investors want to focus on real assets and book value.

Understand Market Valuation - Companies can use the P/B ratio to see how the market values their net assets. A high PB ratio often means investors have high expectations for growth or brand value. A low PB could mean the company needs to build more trust or improve performance.
Benchmark Against Peers - By comparing the PB ratio with industry competitors, management can identify how well they are positioned. If a similar company has a much higher P/B ratio, it may be worth looking into their business model or investor communication strategies.
Improve Financial Strength - Companies with consistently low PB ratios may need to focus on improving their balance sheet, reducing debt, increasing assets, or showing better use of equity.
Investor Relations Tool - Companies can use the PB ratio to guide investor presentations and build confidence. A stable or improving PB ratio shows that the company is growing in value and managing its capital well.
Now that we have seen the meaning of the two vital ratios, let us focus on the core differences between them.
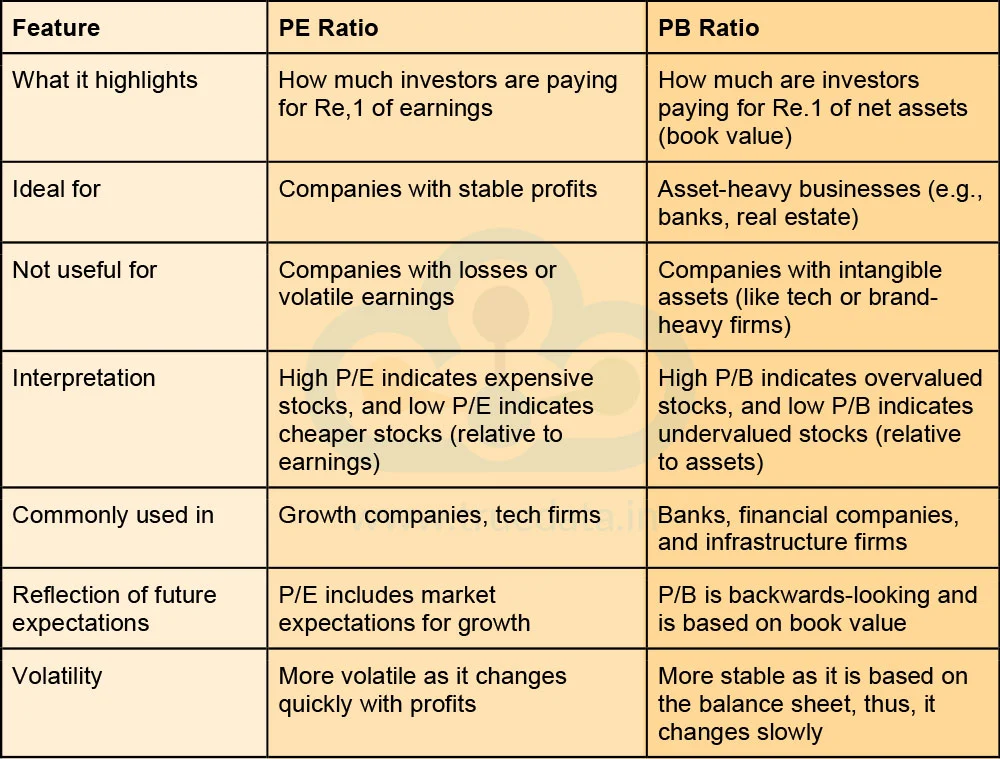

The relevance of the P/E or P/B ratio depends on the type of company being analysed. The P/E (Price to Earnings) ratio is more commonly used and considered more relevant when evaluating companies that have stable and consistent profits. This includes sectors like IT, FMCG, and pharmaceuticals, where companies are valued based on their ability to generate earnings. However, for companies that are asset-heavy, such as those in the banking, financial services, and infrastructure sectors, the P/B (Price to Book) ratio is more useful. This ratio compares the market price of a stock with the company’s book value (its net assets), making it helpful in judging whether the stock is trading above or below the actual value of its assets.
Thus, the P/E ratio is more relevant for profit-driven businesses, while the P/B ratio is better suited for businesses with large physical or financial assets. Understanding this fine difference and the relevance of each ratio helps investors make better decisions based on the nature of the company.
The PE Ratio and the PB ratios are important pillars of ratio analysis and the fundamental analysis of a company. While the P/E ratio reflects future growth expectations, the P/B ratio focuses more on the company’s current financial strength. Thus, these ratios provide valuable insights for making informed decisions and course correction of the portfolio, if needed.
This article talks about the vital ratios in the fundamental analysis of companies and their uses. We hope this information irons out these key concepts and their uses to help you make informed decisions. Let us know your thoughts on this topic or if you need further information on the same.
Till then, Happy Reading!
Read More: Piotroski Score - What is it and how to use it for stock selection?

Thestock market never stands still, and prices swing constantly with every new h...

One of the facts of stock market investing is having fundamental analysis as mor...
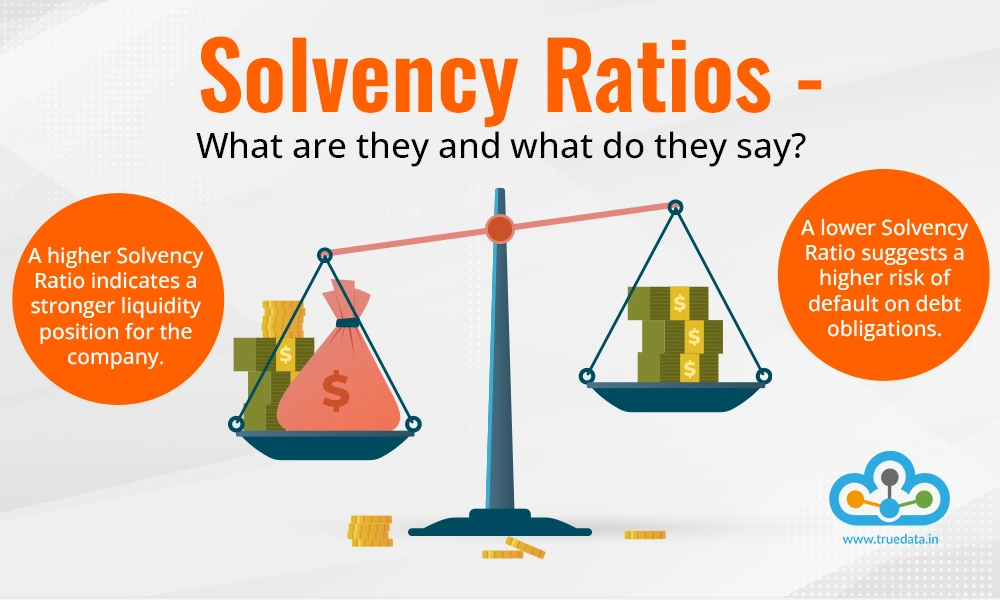
While the profitability of a company is one of its prime objectives, staying afl...