Have you ever wondered why some companies report strong profits but still face cash shortages, while others with modest profits continue to grow steadily? The answer often lies in looking beyond a single financial metric. To truly understand a company's financial health, investors need to examine both its profitability and its ability to generate cash from its core operations. This is where the Operating Profit Margin and the Operating Cash Flow Ratio become valuable tools. But what do these ratios tell you, how are they different, and which one deserves more attention? Get answers to these questions and more in this blog where we explore these two important ratios and how to use them for making sound investment decisions.

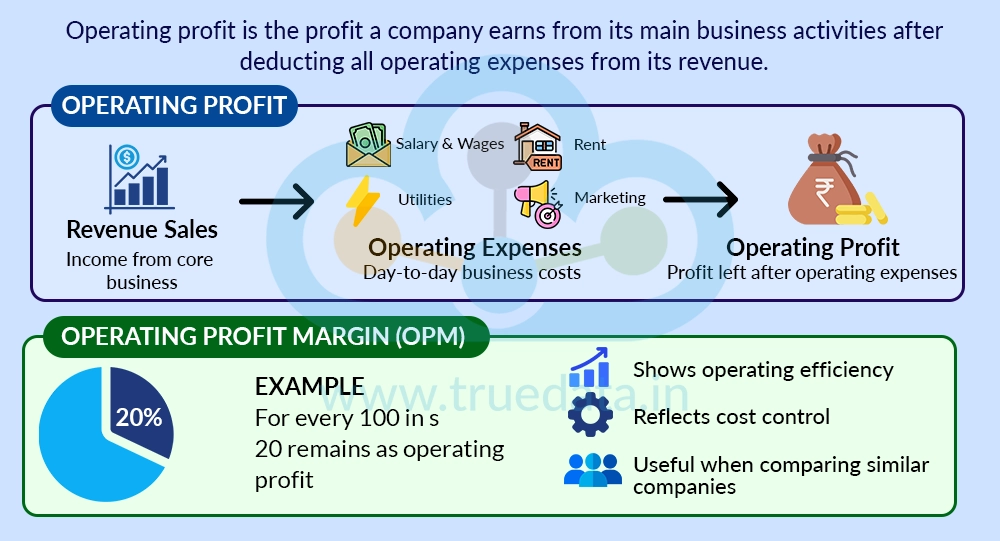
Operating profit is the profit a company earns from its main business activities after deducting all operating expenses from its revenue. These expenses include the cost of producing goods or providing services, employee salaries, rent, utilities, marketing expenses, and other day-to-day business costs. However, operating profit does not include interest expenses, taxes, or one-time gains and losses. Since it focuses only on the company's core operations, operating profit helps investors understand how efficiently the business is being managed, regardless of how it is financed or taxed.
Operating Profit Margin (OPM), on the other hand, is a financial ratio that shows the percentage of a company's revenue that is available as operating profit after covering all operating expenses. Thus, it indicates how efficiently a company converts its sales into operating profit. For example, if a company has an operating profit margin of 20%, it indicates that it earns Rs. 20 as operating profit for every Rs. 100 of revenue generated from its core business. A consistently high or improving operating profit margin generally suggests that the company has good cost control and pricing power. However, investors should compare a company's operating profit margin with its past performance and with other companies in the same industry, as operating margins can vary significantly across different sectors.
The calculation of the Operating Profit Margin involves two simple steps, i.e., calculating the company's operating profit (subtracting all operating costs from its revenue) and then calculating the Operating Profit Margin, which shows the percentage of revenue that remains as operating profit after covering the company's day-to-day operating expenses.
Step 1 - Calculate Operating Profit

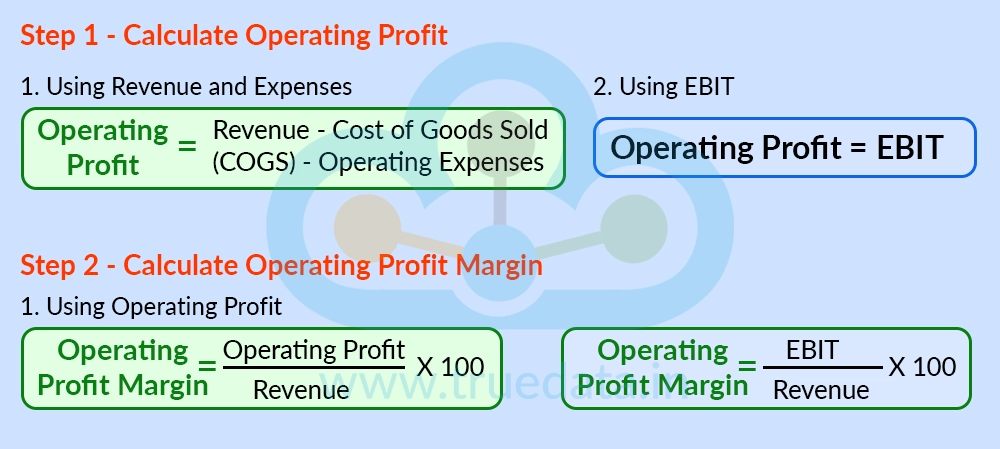
Operating profit represents the profit earned from a company's core business activities before deducting interest and taxes. It is calculated by subtracting the Cost of Goods Sold (COGS) and all operating expenses from the company's total revenue. The formula to calculate Operating Profit is,
Using Revenue and Expenses
Operating Profit = Revenue - Cost of Goods Sold (COGS) - Operating Expenses
or
Operating Profit = Revenue - Total Operating Costs
Using EBIT
Since EBIT (Earnings Before Interest and Taxes) represents operating profit for most companies, operating profit can also be calculated as,
Operating Profit = EBIT
In most financial statements, Operating Profit and EBIT are the same. However, in some cases, companies may classify certain one-time or non-operating items differently. Therefore, investors should always check the company's financial statements and notes to accounts.
Step 2 - Calculate Operating Profit Margin
After calculating the operating profit, the Operating Profit Margin is determined by dividing the operating profit by the company's total revenue and multiplying the result by 100.
Using Operating Profit
Operating Profit Margin = (Operating Profit / Revenue) * 100
Using EBIT
Since operating profit is generally equal to EBIT, the ratio can also be calculated as,
Operating Profit Margin = (EBIT / Revenue) * 100
Both formulas produce the same result when EBIT represents the company's operating profit.
Understanding the Calculation of Operating Profit Margin Using an Example
Consider Company Z Ltd., which reports the following financial data
Revenue = Rs. 1,000 crore
Cost of Goods Sold (COGS) = Rs. 600 crore
Operating Expenses (salaries, rent, marketing, utilities, etc.) = Rs. 200 crore
The calculation of operating profit and operating profit margin is shown below.
Operating Profit = 1,000 - 600 - 200 = Rs. 200 crore
Alternatively, if the company's income statement reports EBIT = Rs. 200 crore, then,
Operating Profit = EBIT = Rs. 200 crore
Thus, the company generated an operating profit of Rs. 200 crore from its core business operations before accounting for interest expenses and taxes.
Calculating the Operating Profit Margin for Z Ltd.
Operating Profit (or EBIT) = Rs. 200 crore
Revenue = Rs. 1,000 crore
Operating Profit Margin = (200 / 1,000) * 100 = 0.20 × 100 = 20%
Thus, the company retains Rs. 20 as operating profit for every Rs. 100 of revenue after covering all its operating expenses. A higher operating profit margin generally indicates that the company is managing its operating costs efficiently and earning a larger profit from its core business activities.

The importance of operating profit margin and its use in understanding a company’s fundamentals are explained below.
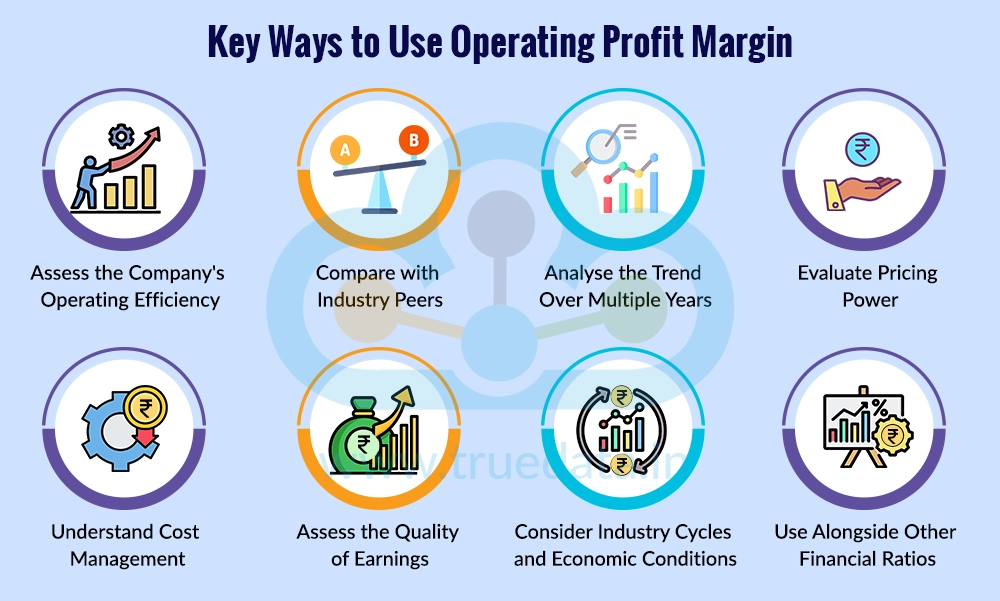
One of the most important uses of the Operating Profit Margin is to evaluate how efficiently a company runs its core business. A higher operating profit margin generally indicates that the company is able to control its production costs and operating expenses while generating healthy revenue. On the other hand, a consistently low operating profit margin may suggest rising costs, inefficient operations, or weak pricing power. Investors should look for companies that maintain healthy operating margins over time, as this often reflects strong business management.
Operating profit margins vary significantly across industries. For example, software and pharmaceutical companies often enjoy higher operating margins than retail or airline companies because their business models and cost structures are different. Therefore, investors should compare a company's operating profit margin only with other companies in the same industry. If a company consistently reports a higher operating margin than its competitors, it may have advantages such as better cost management, stronger brand value, superior products, or greater operational efficiency.
Instead of focusing on a single year's operating profit margin, investors should examine how the ratio has changed over the last five to ten years. A stable or gradually improving operating margin indicates that the company has been able to grow its business while keeping costs under control. However, if the operating margin keeps declining over several years, it may indicate increasing competition, rising input costs, pricing pressure, or weakening operational performance. Therefore, studying long-term trends helps investors identify whether the company's profitability is improving or deteriorating.
Companies with strong brands, unique products, or loyal customers often have greater pricing power. Such companies can increase the prices of their products or services without losing a significant number of customers, helping them maintain healthy operating profit margins even during periods of rising costs. A consistently high operating margin can therefore indicate that the company has a competitive advantage and is less affected by inflation or fluctuations in raw material prices.
Operating Profit Margin also helps investors understand the efficiency of a company to manage its day-to-day expenses. Despite growing revenue, excessive spending on employee costs, marketing, administration, or production can reduce operating profits. A company that consistently controls its operating costs while expanding its business is generally in a stronger financial position than one whose expenses are increasing faster than its revenue.
A company may report high net profit due to one-time gains such as selling assets, investment income, or tax benefits. However, these gains do not reflect the company's regular business performance. Operating Profit Margin focuses only on profits generated from the company's core operations, making it a more reliable indicator of the sustainability and quality of its earnings. Investors should prefer companies whose operating margins remain healthy without relying on non-operating income.
Operating profit margins can fluctuate due to changes in the business environment. Rising raw material prices, inflation, economic slowdowns, or weak consumer demand may temporarily reduce operating margins even for fundamentally strong companies. Therefore, investors should consider industry trends and broader economic conditions before drawing conclusions. If margins decline across the entire industry, the issue may be external rather than company-specific.
Operating Profit Margin should never be analysed in isolation. Investors should combine it with other financial ratios such as the Operating Cash Flow Ratio, Net Profit Margin, Return on Equity (ROE), Return on Capital Employed (ROCE), Debt-to-Equity Ratio, and Interest Coverage Ratio. Looking at multiple ratios together provides a more complete understanding of the company's profitability, cash generation, operational efficiency, and financial strength, leading to better-informed investment decisions.

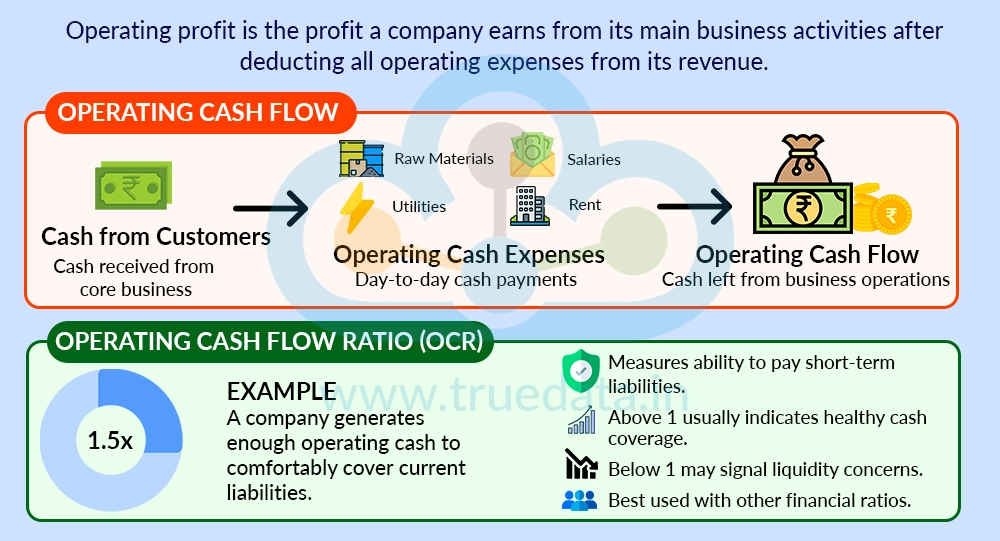
Operating Cash Flow (OCF) is the actual cash a company generates from its core business operations during a specific period. It includes cash received from customers and cash paid for expenses such as raw materials, employee salaries, rent, utilities, and other day-to-day business activities. Unlike profit, which is calculated using accounting rules and includes non-cash items such as depreciation and amortisation, operating cash flow focuses only on the actual movement of cash. This makes it an important measure of a company's ability to generate enough cash to run its business, pay suppliers and employees, invest in growth, repay debt, and distribute dividends without depending heavily on external financing.
The Operating Cash Flow Ratio (OCFR) is a financial ratio that measures whether a company generates enough cash from its operating activities to meet its short-term liabilities. It shows how comfortably a company can pay its current obligations using the cash generated from its core business, without relying on borrowing or selling assets. A ratio greater than 1 generally indicates that the company generates sufficient operating cash to cover its current liabilities, while a ratio below 1 may suggest potential liquidity concerns if the situation continues over a long period. Investors should not rely on this ratio alone but should analyse it along with other financial metrics, such as the Current Ratio, Operating Profit Margin, Free Cash Flow, and Debt-to-Equity Ratio, to gain a more complete understanding of a company's financial health.
The calculation of the Operating Cash Flow Ratio is a two-step process, i.e., calculating the company's Operating Cash Flow and Operating Cash Flow Ratio. This ratio indicates the ability of the business to generate sufficient cash from its operations to meet its short-term obligations.

Step 1 - Calculate Operating Cash Flow (OCF)
Operating Cash Flow represents the net cash generated from a company's core business activities during a financial period. It measures the actual cash inflows and outflows related to normal business operations, excluding investing and financing activities.
There are two commonly used methods to calculate Operating Cash Flow.
Indirect Method (Most Common)
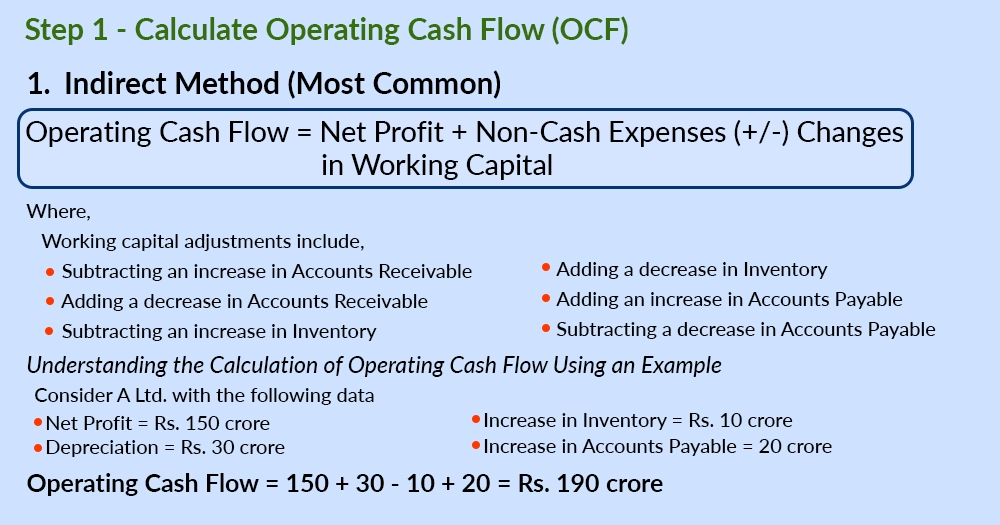
Most companies report operating cash flow using the indirect method, which starts with net profit and adjusts it for non-cash items and changes in working capital. The formula to calculate operating cash flow is
Operating Cash Flow = Net Profit + Non-Cash Expenses (+/-) Changes in Working Capital
Where,
Working Capital adjustments include,
Subtracting an increase in Accounts Receivable
Adding a decrease in Accounts Receivable
Subtracting an increase in Inventory
Adding a decrease in Inventory
Adding an increase in Accounts Payable
Subtracting a decrease in Accounts Payable
Understanding the Calculation of Operating Cash Flow Using an Example
Consider A Ltd. with the following data
Net Profit = Rs. 150 crore
Depreciation = Rs. 30 crore
Increase in Inventory = Rs. 10 crore
Increase in Accounts Payable = 20 crore
Operating Cash Flow = 150 + 30 - 10 + 20 = Rs. 190 crore
Thus, the company generated Rs. 190 crore in actual cash from its core business operations during the year.
Direct Method

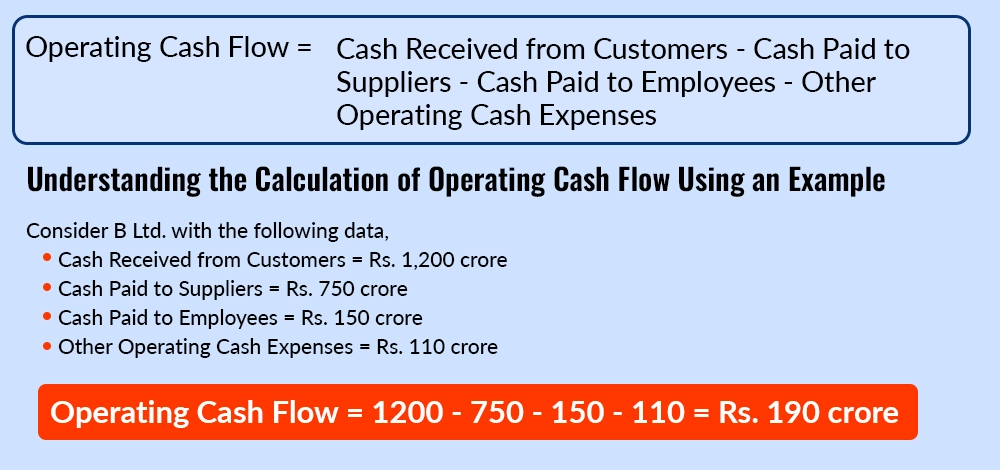
Under the direct method, Operating Cash Flow is calculated by adding all cash received from operating activities and subtracting all cash paid for operating expenses. The formula to calculate operating cash flow is,
Operating Cash Flow = Cash Received from Customers - Cash Paid to Suppliers - Cash Paid to Employees - Other Operating Cash Expenses
Although this method provides a clearer picture of actual cash inflows and outflows, it is less commonly used by companies in their financial reporting.
Understanding the Calculation of Operating Cash Flow Using an Example
Consider B Ltd. with the following data,
Cash Received from Customers = Rs. 1,200 crore
Cash Paid to Suppliers = Rs. 750 crore
Cash Paid to Employees = Rs. 150 crore
Other Operating Cash Expenses = Rs. 110 crore
Operating Cash Flow = 1200 - 750 - 150 - 110 = Rs. 190 crore
The result is the same, but the calculation begins with actual cash transactions instead of net profit.
Step 2 - Calculate Operating Cash Flow Ratio

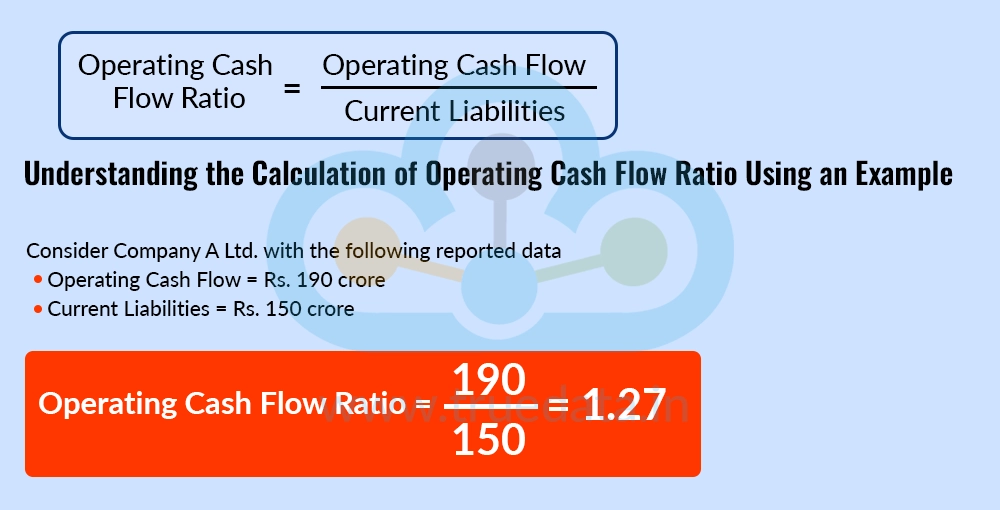
After calculating the Operating Cash Flow, the Operating Cash Flow Ratio is determined by dividing Operating Cash Flow by Current Liabilities. The formula to calculate the operating cash flow ratio is,
Operating Cash Flow Ratio = Operating Cash Flow / Current Liabilities
This ratio indicates how many times a company's operating cash flow can cover its short-term liabilities.
Alternative Approach
Some investors and financial analysts do not calculate Operating Cash Flow manually. Instead, they use the ‘Net Cash from Operating Activities’ (also called ‘Cash Flow from Operating Activities’) reported directly in the company's Cash Flow Statement. The formula to calculate the operating cash flow ratio in this case is,
Operating Cash Flow Ratio = Net Cash from Operating Activities / Current Liabilities
Understanding the Calculation of Operating Cash Flow Ratio Using an Example
Consider Company A Ltd. with the following reported data
Operating Cash Flow = Rs. 190 crore
Current Liabilities = Rs. 150 crore
Operating Cash Flow Ratio = 190 / 150 = 1.27
Thus, the company generates Rs. 1.27 of operating cash flow for every Rs. 1 of current liabilities. Since the ratio is greater than 1, it indicates that the company generates sufficient cash from its core operations to meet its short-term financial obligations.
The interpretation of the operating cash flow ratio is explained below.

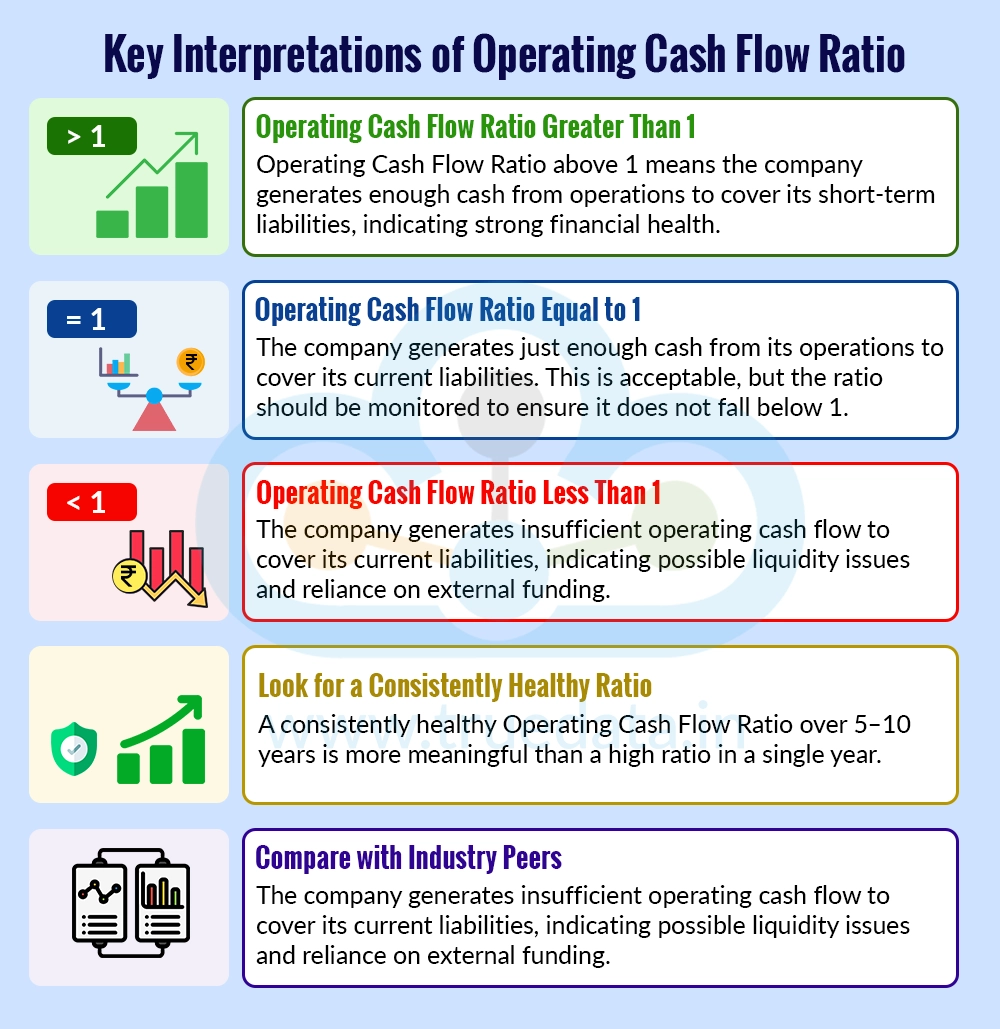
Operating Cash Flow Ratio Greater Than 1 - An Operating Cash Flow Ratio above 1 generally indicates that the company generates enough cash from its core business operations to comfortably meet its short-term liabilities. This is usually considered a positive sign because the business does not have to rely heavily on borrowing or selling assets to pay its current obligations.
Operating Cash Flow Ratio Equal to 1 - A ratio of 1 means the company's operating cash flow is exactly equal to its current liabilities. In simple words, the company generates just enough cash from its operations to cover its short-term obligations. While this is generally acceptable, investors should monitor the ratio over time to ensure it does not decline.
Operating Cash Flow Ratio Less Than 1 - A ratio below 1 indicates that the company is not generating sufficient operating cash flow to fully cover its current liabilities. This could mean the business may need to depend on external funding, additional borrowing, or the sale of assets to meet its short-term financial commitments. If this situation continues for several years, it may indicate liquidity concerns.
Look for a Consistently Healthy Ratio - A consistently healthy Operating Cash Flow Ratio over several years (5-10 years) is generally more meaningful than a high ratio in a single year. A steadily improving ratio may indicate stronger cash generation and better liquidity management, while a consistently declining ratio may point to weakening operational performance or increasing short-term financial pressure. Stable cash generation reflects a company's ability to manage its operations efficiently and maintain financial strength even during changing market conditions.
Compare with Industry Peers - The ideal Operating Cash Flow Ratio can vary across industries because different businesses have different working capital requirements. For example, manufacturing companies often require higher inventory levels than software companies. Therefore, investors should compare this ratio with companies operating in the same industry instead of businesses from different sectors.
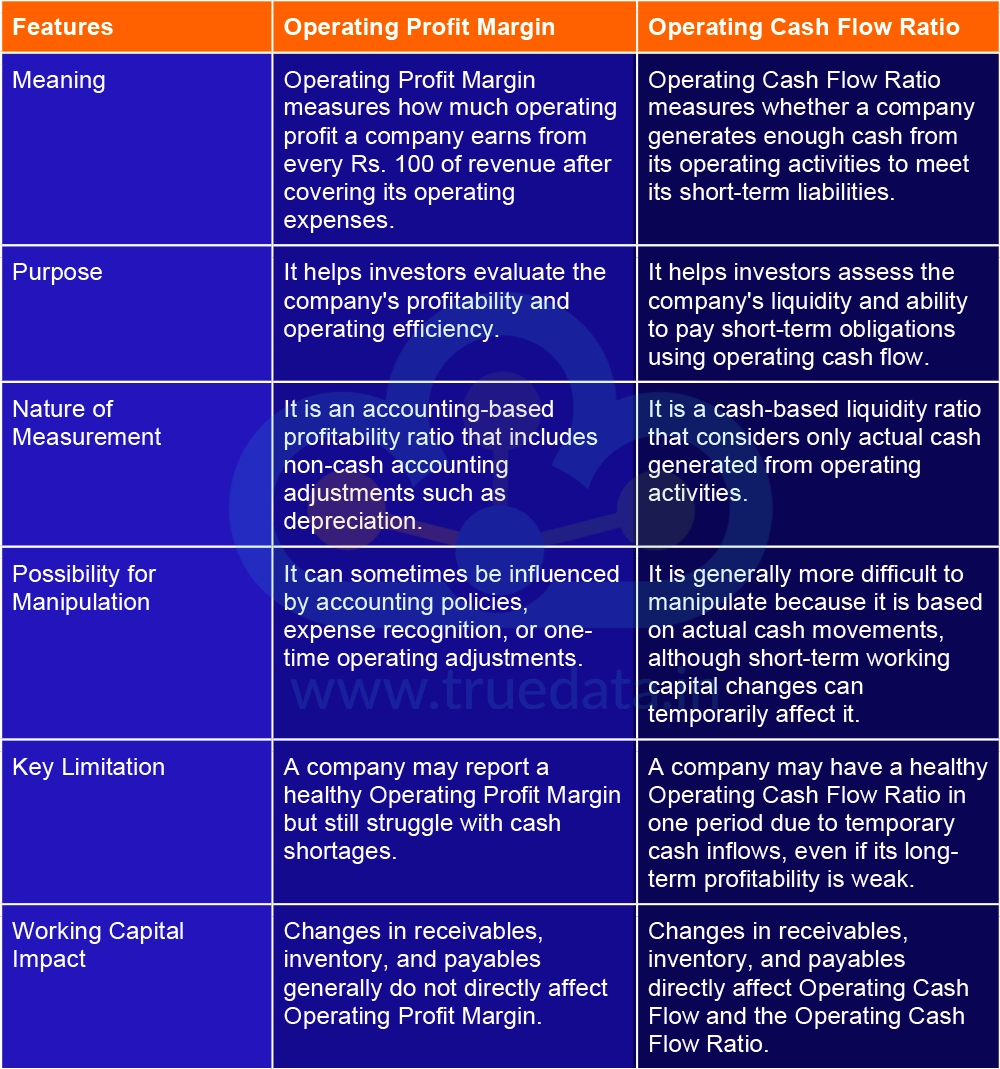
Operating profit margin and operating cash flow margin are two important pillars of fundamental analysis. However, they have a few key differences which are highlighted below.

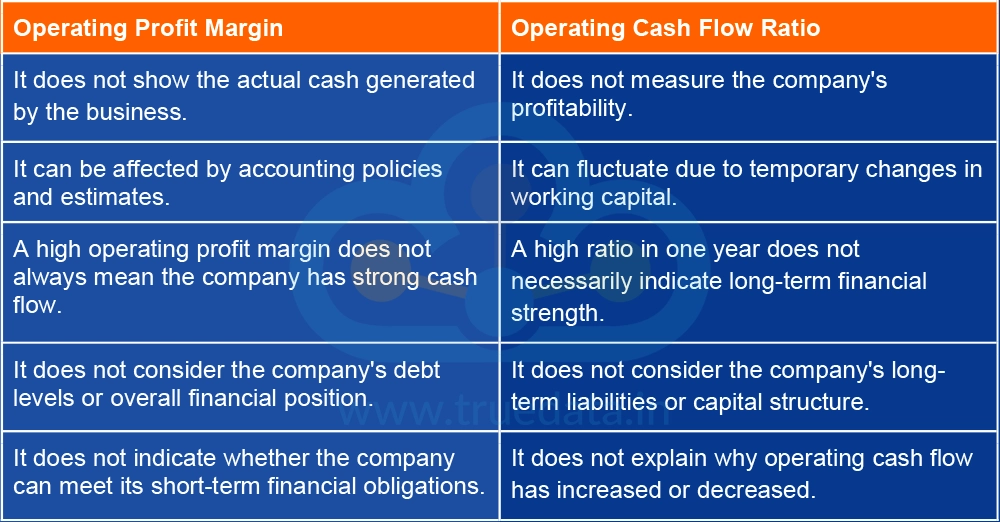
Although these ratios are a crucial part of evaluating a company’s financial performance, they come with a few limitations. These limitations include,


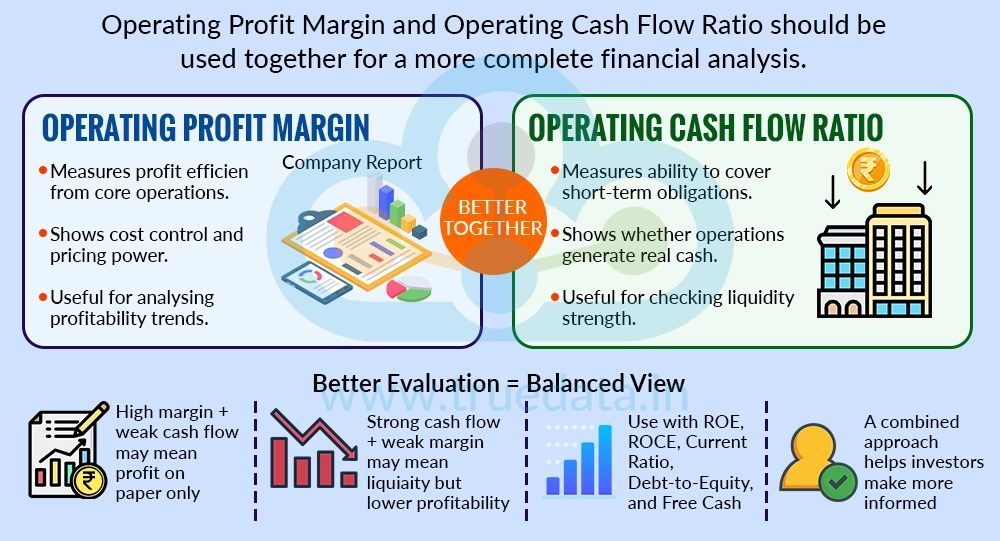
There is no single ratio that is better than the other, as the Operating Profit Margin and the Operating Cash Flow Ratio measure different aspects of a company's financial health. Operating Profit Margin helps investors understand how efficiently a company earns profits from its core business operations, while the Operating Cash Flow Ratio shows whether the company generates enough cash from those operations to meet its short-term financial obligations.
A company with a high operating profit margin but a weak operating cash flow ratio may be profitable on paper but could still face cash shortages due to delayed customer payments or high inventory levels. On the other hand, a company with strong operating cash flow but weak operating margins may have healthy liquidity but may struggle to sustain its profitability over the long term. Therefore, investors should use both ratios together rather than relying on either one alone. Furthermore, analysing these ratios alongside other financial metrics such as Return on Equity (ROE), Return on Capital Employed (ROCE), Current Ratio, Debt-to-Equity Ratio, and Free Cash Flow can provide a more complete picture of a company's profitability, cash generation, liquidity, and overall financial strength. This balanced approach helps investors make more informed and confident investment decisions.
The Operating Profit Margin and the Operating Cash Flow Ratio are both valuable tools for evaluating a company's financial health, but they serve different purposes and should not be used in isolation. Investors should analyse them together, along with other financial ratios and the company's long-term performance, to gain a more complete understanding of its profitability, liquidity, and overall financial strength. A company that consistently reports healthy operating margins and strong operating cash flow is generally better positioned for sustainable growth and long-term value creation.
This article takes a deep dive into understanding two important financial ratios. Let us know your thoughts on this topic, or if you need further information on the same, and we will address it soon.
Till then, Happy Reading!
Read More: Fixed Charge Coverage Ratio
Thestock market never stands still, and prices swing constantly with every new h...
Corporate data is more than just the numbers of a company. They can show what is...
Investing is not just about numbers on a screen. It is about understanding the s...