Corporate Data

BVPS vs EPS vs Price-to-Book Ratio - Key Differences Explained

Marisha Bhatt · 06 Aug 2026 · 11 mins read · 0 Comments

bvps-vs-eps-vs-price-to-book-ratio-key-differences-explained

Ever wondered why one investor talks about EPS, another prefers BVPS, while someone else focuses on the Price-to-Book (P/B) Ratio? Although these metrics are often used together, they answer different questions about a company's profitability, financial strength, and valuation. So how should investors use them, and what do they reveal when viewed together? Dive into this blog to understand their differences and how using them together can help investors look beyond the stock price and make more informed investment decisions.

What are BVPS, EPS, and the Price-to-Book Ratio?

what-are-bvps-eps-and-the-price-to-book-ratio

Before comparing BVPS, EPS, and the Price-to-Book (P/B) Ratio, it is important to understand what each metric measures. While all three are used to evaluate a company, they focus on different aspects of its financial performance and valuation. 

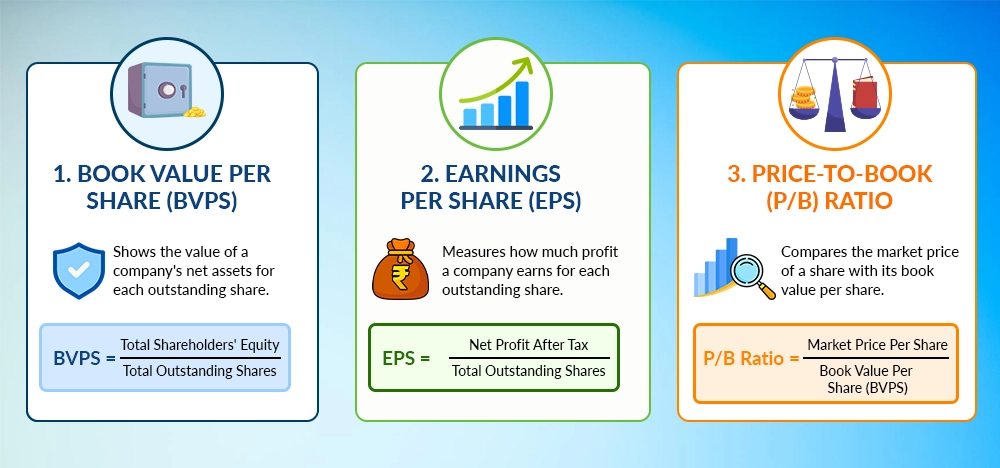
  • Book Value Per Share (BVPS) - Book Value Per Share (BVPS) shows the value of a company's net assets that belong to each outstanding share. It indicates the worth of each share based on the company's assets after paying off all its debts. Investors often use BVPS to understand a company's financial strength.

  • Earnings Per Share (EPS) - Earnings Per Share EPS) measures how much profit a company earns for each outstanding share. A higher EPS generally indicates that the company is generating more profit for its shareholders. Investors use EPS to assess a company's profitability and compare it with similar companies.

  • Price-to-Book (P/B) Ratio - The Price-to-Book ratio (P/B Ratio) compares a company's current share price with its book value per share (BVPS). It helps investors understand whether a stock is trading above or below the value of its net assets. A lower P/B ratio may indicate an undervalued stock, while a higher ratio may suggest that investors expect strong future growth. However, it should always be analysed along with other financial metrics.

What are the Key Differences Between BVPS, EPS, and Price-to-Book Ratio?

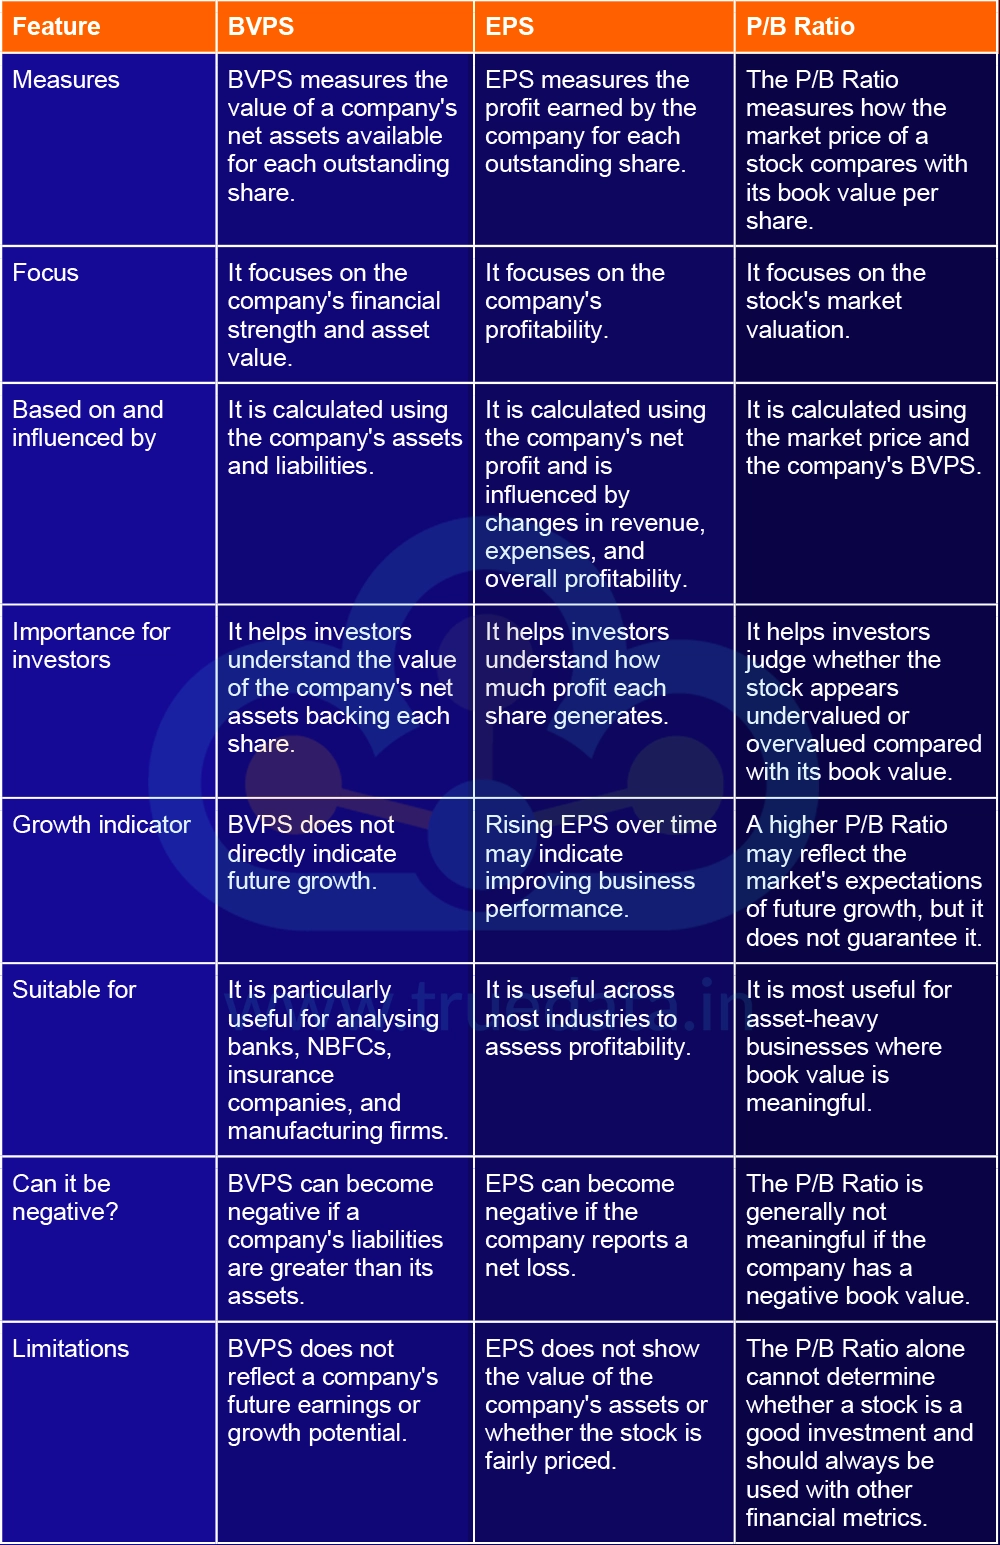
Although BVPS, EPS, and the Price-to-Book (P/B) Ratio are all important metrics, they serve different purposes. Understanding these differences can help you analyse a company's financial health, profitability, and market valuation more effectively.

What are the Key Differences Between BVPS, EPS, and Price-to-Book Ratio

Feature

BVPS

EPS

P/B Ratio

Measures

BVPS measures the value of a company's net assets available for each outstanding share.

EPS measures the profit earned by the company for each outstanding share.

The P/B Ratio measures how the market price of a stock compares with its book value per share.

Focus

It focuses on the company's financial strength and asset value.

It focuses on the company's profitability.

It focuses on the stock's market valuation.

Based on and influenced by

It is calculated using the company's assets and liabilities.

It is calculated using the company's net profit and is influenced by changes in revenue, expenses, and overall profitability.

It is calculated using the market price and the company's BVPS.

Importance for investors

It helps investors understand the value of the company's net assets backing each share.

It helps investors understand how much profit each share generates.

It helps investors judge whether the stock appears undervalued or overvalued compared with its book value.

Growth indicator

BVPS does not directly indicate future growth.

Rising EPS over time may indicate improving business performance.

A higher P/B Ratio may reflect the market's expectations of future growth, but it does not guarantee it.

Suitable for

It is particularly useful for analysing banks, NBFCs, insurance companies, and manufacturing firms.

It is useful across most industries to assess profitability.

It is most useful for asset-heavy businesses where book value is meaningful.

Can it be negative?

BVPS can become negative if a company's liabilities are greater than its assets.

EPS can become negative if the company reports a net loss.

The P/B Ratio is generally not meaningful if the company has a negative book value.

Limitations

BVPS does not reflect a company's future earnings or growth potential.

EPS does not show the value of the company's assets or whether the stock is fairly priced.

The P/B Ratio alone cannot determine whether a stock is a good investment and should always be used with other financial metrics.

How to Use BVPS, EPS, and the Price-to-Book Ratio Together?

How to Use BVPS, EPS, and the Price-to-Book Ratio Together

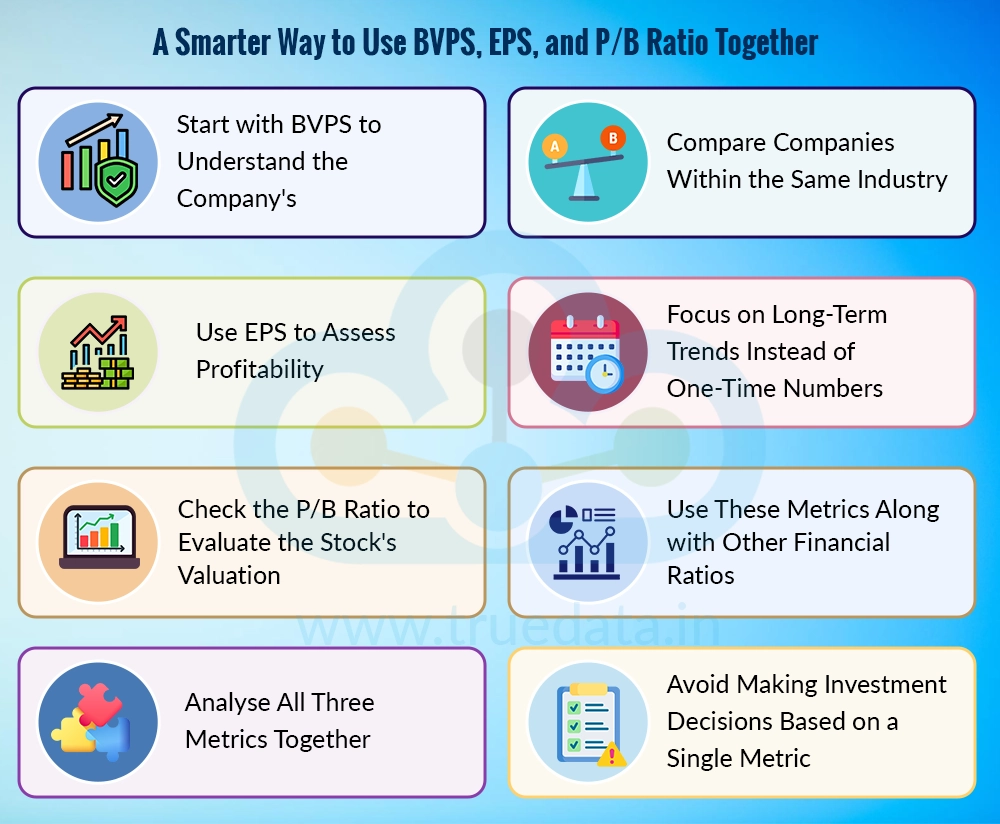
No single financial metric can provide a complete picture of a company's performance. Book Value Per Share (BVPS), Earnings Per Share (EPS), and the Price-to-Book (P/B) Ratio each measure a different aspect of a business. When analysed together, they help investors evaluate the core company fundamentals and its financial viability more effectively.

  • Start with BVPS to Understand the Company's Financial Strength - The first step is to examine the Book Value Per Share (BVPS). This metric shows the value of the company's net assets available for each outstanding share after all liabilities have been paid. A consistently rising BVPS generally indicates that the company is strengthening its balance sheet and creating value for shareholders over time. BVPS is particularly useful when analysing asset-heavy sectors where the value of assets plays an important role.

  • Use EPS to Assess Profitability - After evaluating the company's financial strength, investors should analyse its Earnings Per Share (EPS). EPS indicates how much profit the company earns for each outstanding share. A company with steadily increasing EPS usually demonstrates improving profitability and efficient business operations. However, investors should avoid relying on a single year's EPS. Instead, analysing the trend over several years provides a better understanding of whether the company's earnings are consistently growing.

  • Check the P/B Ratio to Evaluate the Stock's Valuation - Once the company's asset value and profitability have been assessed, investors can use the Price-to-Book (P/B) Ratio to understand how the market is valuing the stock. This ratio compares the current market price of the share with its book value. A lower P/B ratio may indicate that the stock is trading close to or below its asset value, while a higher ratio may suggest that the market expects stronger future growth. However, the P/B ratio should always be compared with similar companies in the same industry, as valuation levels vary across sectors.

  • Analyse All Three Metrics Together - The real strength of these metrics lies in using them together rather than individually. For example, a company with a strong BVPS, consistently growing EPS, and a reasonable P/B ratio may indicate a financially sound business that is fairly valued. On the other hand, if a company has a high EPS but an extremely high P/B ratio, much of its future growth may already be reflected in the share price. Similarly, a company with a low P/B ratio but declining BVPS and EPS may appear inexpensive, but its weak financial performance could explain the lower valuation.

  • Compare Companies Within the Same Industry - These metrics provide more meaningful insights when companies from the same industry are compared. For example, comparing the BVPS, EPS, and P/B ratio of two private sector banks is far more useful than comparing a bank with an IT company. Since industries differ in their business models, profitability, and asset requirements, comparisons should always be made among similar businesses.

  • Focus on Long-Term Trends Instead of One-Time Numbers - Rather than relying on a single year's financial data, investors should study how BVPS, EPS, and the P/B ratio have changed over several years. A company that consistently improves its BVPS and EPS while maintaining a reasonable valuation often demonstrates stable business growth. Looking at long-term trends helps investors avoid making decisions based on temporary market movements or one-time financial events.

  • Use These Metrics Along with Other Financial Ratios - Although BVPS, EPS, and the P/B ratio are valuable tools, they should not be used in isolation. Investors should also consider other important financial metrics such as Return on Equity (ROE), Price-to-Earnings (P/E) Ratio, Debt-to-Equity ratio, Operating Cash Flow, and Net Profit Margin. Combining multiple financial indicators provides a more complete understanding of the company's financial health, growth potential, and valuation.

  • Avoid Making Investment Decisions Based on a Single Metric - Every financial metric has its strengths and limitations. A company may have a high EPS but carry excessive debt, or it may have a low P/B ratio because its business prospects have weakened. Similarly, a high BVPS does not automatically guarantee strong future earnings. Therefore, investors should consider all three metrics together, along with the company's business model, industry conditions, management quality, and future growth prospects before making an investment decision. This balanced approach can lead to more informed and well-researched investment decisions.

What are the Limitations of BVPS, EPS, and the Price-to-Book Ratio?

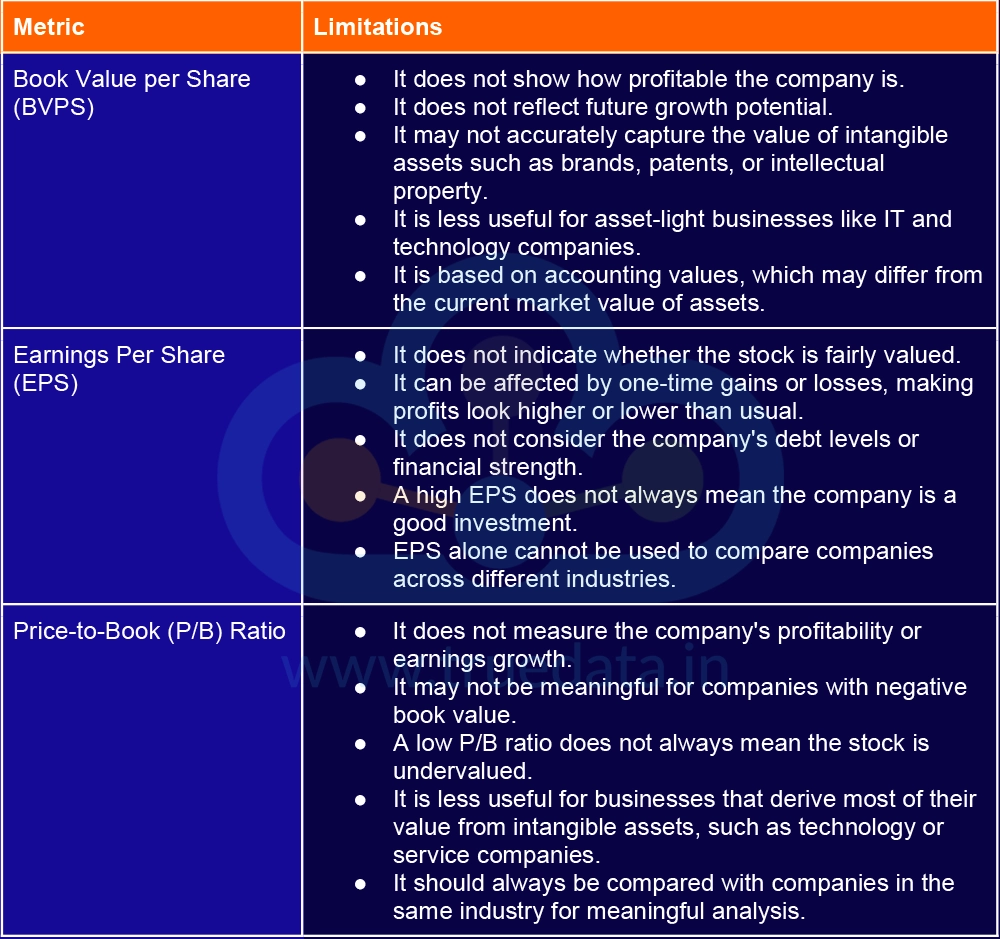
Although BVPS, EPS, and the Price-to-Book (P/B) Ratio are useful financial metrics, each has certain limitations. Investors should understand these drawbacks and use these metrics along with other financial ratios and qualitative factors before making investment decisions.

What are the Limitations of BVPS, EPS, and the Price-to-Book Ratio

Metric

Limitations

Book Value per Share (BVPS)

  • It does not show how profitable the company is.

  • It does not reflect future growth potential.

  • It may not accurately capture the value of intangible assets such as brands, patents, or intellectual property.

  • It is less useful for asset-light businesses like IT and technology companies.

  • It is based on accounting values, which may differ from the current market value of assets.

Earnings Per Share (EPS)

  • It does not indicate whether the stock is fairly valued.

  • It can be affected by one-time gains or losses, making profits look higher or lower than usual.

  • It does not consider the company's debt levels or financial strength.

  • A high EPS does not always mean the company is a good investment.

  • EPS alone cannot be used to compare companies across different industries.

Price-to-Book (P/B) Ratio

  • It does not measure the company's profitability or earnings growth.

  • It may not be meaningful for companies with negative book value.

  • A low P/B ratio does not always mean the stock is undervalued.

  • It is less useful for businesses that derive most of their value from intangible assets, such as technology or service companies.

  • It should always be compared with companies in the same industry for meaningful analysis.

What are the Common Mistakes to Avoid When Using These Valuation Metrics?

What are the Common Mistakes to Avoid When Using These Valuation Metrics

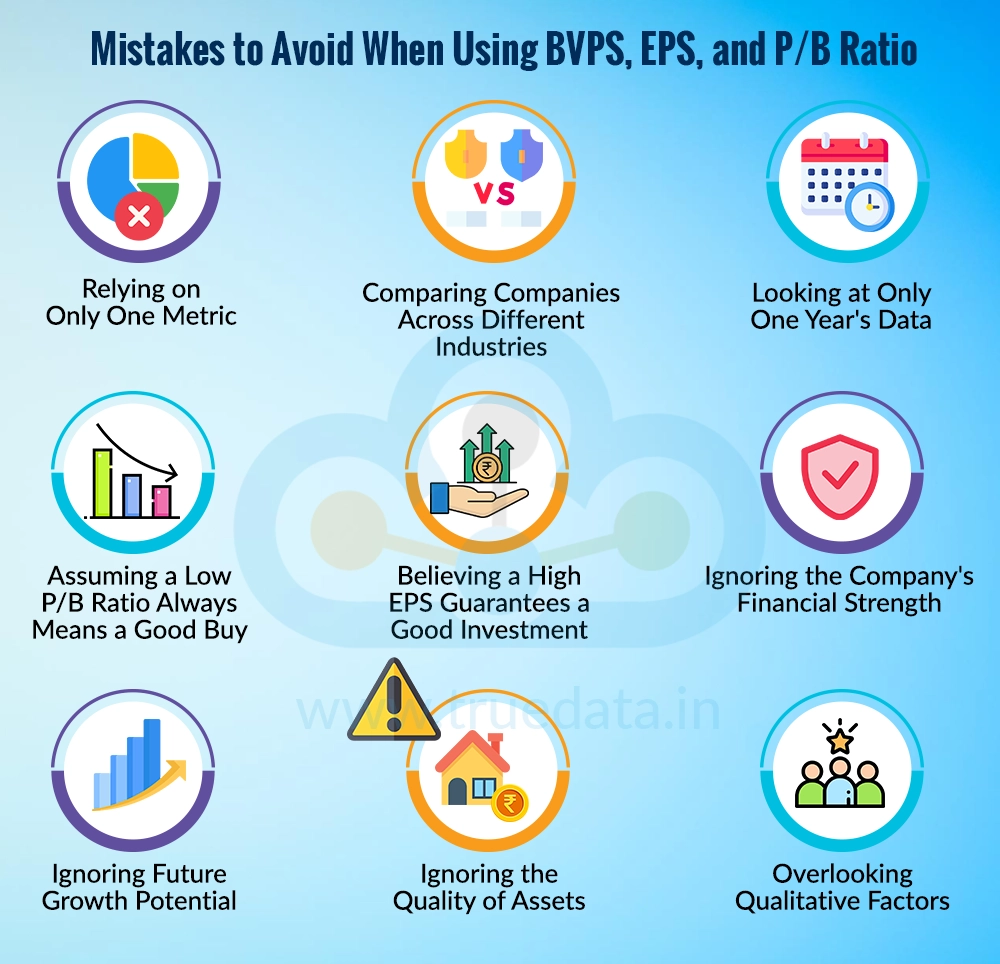
While Book Value Per Share (BVPS), Earnings Per Share (EPS), and the Price-to-Book (P/B) Ratio are valuable tools, they should be used carefully. Avoiding the following common mistakes can help investors make better-informed investment decisions.

  • Relying on Only One Metric - Investors should avoid making investment decisions based on just one metric. BVPS, EPS, and the P/B Ratio each provide different insights, so they work best when analysed together. Furthermore, they should be used along with other fundamental analysis metrics for accurate analysis.  

  • Comparing Companies Across Different Industries - These metrics are most useful when comparing companies within the same industry. Comparing a bank with an IT company, for example, may lead to misleading conclusions because their business models and financial structures are very different.

  • Looking at Only One Year's Data - Investors should not rely on a single year's financial numbers. Analysing the trend in BVPS, EPS, and the P/B Ratio over several years provides a better understanding of a company's long-term performance.

  • Assuming a Low P/B Ratio Always Means a Good Buy - A low P/B Ratio does not automatically mean that a stock is undervalued. Sometimes, the market assigns a lower valuation because the company's financial performance or future growth prospects have weakened.

  • Believing a High EPS Guarantees a Good Investment - A high EPS is generally positive, but it does not guarantee that a company is a good investment. Investors should also evaluate the company's debt, cash flows, valuation, and business fundamentals.

  • Ignoring the Company's Financial Strength - Strong earnings alone are not enough. Investors should also examine the company's balance sheet, debt levels, and asset quality to understand its overall financial health.

  • Ignoring Future Growth Potential - These metrics mainly reflect current or historical financial performance. Investors should also consider the company's future growth plans, competitive position, and industry outlook before investing.

  • Ignoring the Quality of Assets - A high BVPS may not always be meaningful if the company's assets are outdated, overvalued, or unable to generate sufficient returns. Investors should assess the quality of the assets, not just their value.

  • Overlooking Qualitative Factors - Financial ratios tell only part of the story. Investors should also evaluate the company's management quality, corporate governance, competitive advantages, and industry trends before making investment decisions.

Conclusion

BVPS, EPS, and the Price-to-Book (P/B) Ratio are three important metrics that help investors understand a company from different angles. While BVPS reflects financial strength, EPS measures profitability, and the P/B Ratio indicates how the market values the company. Since no single metric tells the complete story, investors should analyse them together and support their findings with other financial ratios, industry comparisons, and the company's future growth prospects. Taking this well-rounded approach can lead to more confident and informed investment decisions.

This article combines three important fundamental analysis metrics for deeper analysis and understanding of the financial position of a company. Let us know your thoughts on the topic or if you need further information on the same, and we will address it soon. 

Till then, Happy Reading!


Read More: Profit After Tax (CAGR) 

Frequently Asked Questions

A share buyback reduces the number of outstanding shares, which can increase BVPS if the impact on shareholders' equity is proportionally smaller. It can also affect the P/B Ratio, depending on how the share price and book value change after the buyback.

Yes, a company can have a high EPS but a low BVPS. This may happen if the company generates strong profits but has a relatively small asset base or lower shareholders' equity.

Investors should compare BVPS, EPS, and the P/B Ratio together because each metric highlights a different aspect of a company, i.e., its financial strength, profitability, and market valuation. Using all three provides a more complete picture and helps investors make better-informed investment decisions.

The Price-to-Book (P/B) Ratio is commonly used to identify potentially undervalued stocks, especially in asset-heavy sectors such as banks and NBFCs. However, it should always be analysed along with BVPS, EPS, and other financial metrics before making an investment decision.

Yes, a company can have a high P/B Ratio but a low EPS if investors expect strong future growth despite its current low profitability. However, investors should analyse the reasons behind this valuation before investing.

Neither metric is better on its own. BVPS shows the company's asset value, while the P/B Ratio helps investors judge whether the stock is trading at a reasonable price relative to that value, so value investors should use both together.
Marisha Bhatt

Marisha Bhatt is a financial content writer @TrueData.

She writes with the sole aim of simplifying complex financial concepts and jargon while attempting to clarify technical and fundamental analysis concepts of the stock markets. The ultimate goal is to spread vital knowledge and benefit the maximum audience. Her Chartered Accountant background acts as the knowledge base to help clarify crucial concepts and create a sound investment portfolio.

0 Comments

Related Articles

SEE ALL
Corporate Data
Corporate Data
Investing Smarter: The Power of Corporate Data and Market Sentiment Analysis

Thestock market never stands still, and prices swing constantly with every new h...

Corporate Data
Corporate Data
Book Value Per Share - What is it and Why is it Important?

When looking at the stock price, can you decide if it is a good deal or not? The...

Corporate Data
Corporate Data
Understanding Quarterly vs Annual Corporate Data

Corporate data is more than just the numbers of a company. They can show what is...