When analysing stocks, many investors naturally look at a company’s profits. But a single year’s profit figure does not tell the whole story. A company may report strong profits today, but has it been growing its earnings consistently over the years? This is where PAT CAGR (Profit After Tax Compound Annual Growth Rate) becomes an important metric. It helps investors understand how steadily a company has grown its profits over a specific period. So, how do you calculate this PAT CAGR, and how is it relevant? Read on to know all about the PAT CAGR and its importance in decision-making.

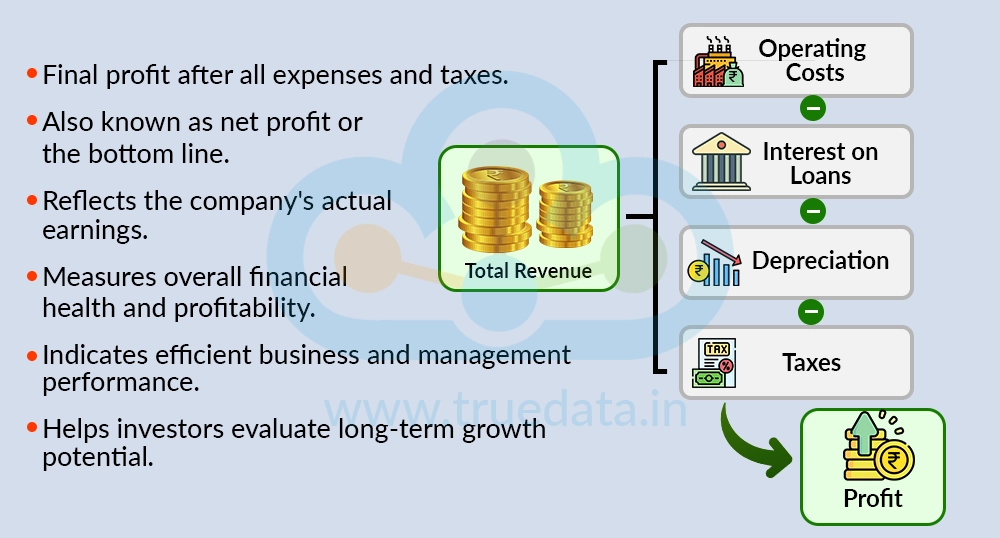
Profit After Tax (PAT) is the final profit a company earns after paying all its expenses, including operating costs, interest on loans, depreciation, and taxes. It is often referred to as the company's net profit or the ‘bottom line’ as it represents the amount left over after every business expense has been deducted from total revenue. PAT shows the actual earnings generated by the company during a financial year or quarter and is an important indicator of its financial health and profitability. Investors closely track PAT because consistent growth in net profit often reflects strong business performance, efficient management, and the potential to create long-term shareholder value. A company may have high sales, but if its PAT is low or declining, it could indicate rising costs or operational challenges. Therefore, PAT helps investors assess how effectively a company converts its revenue into real profits.

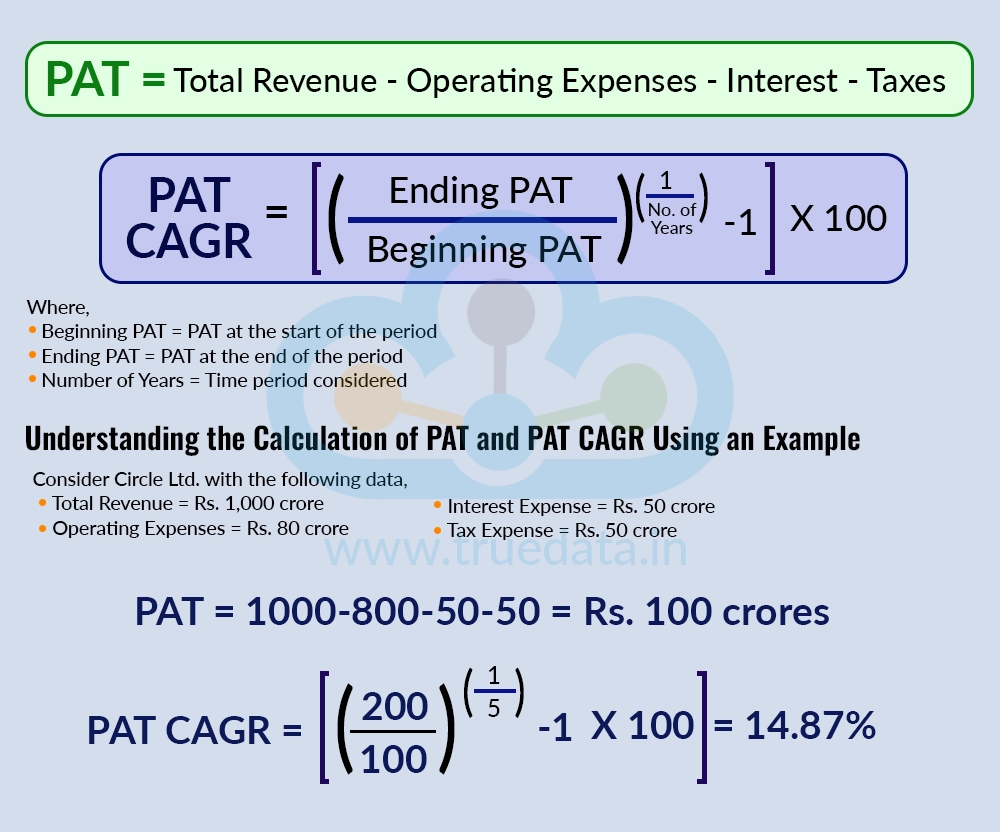
Profit After Tax (PAT) is calculated by subtracting all expenses, interest, and taxes from a company's total revenue. The formula for calculating PAT is shown below.
PAT = Total Revenue - Operating Expenses - Interest - Taxes
PAT CAGR (Profit After Tax Compound Annual Growth Rate), on the other hand, measures the average annual growth rate of a company's profits over a specific period. It helps investors understand how consistently a company's earnings have grown over time, thereby helping them compare companies within the same industry and make informed investment decisions. The formula to calculate the PAT CAGR is shown below.
PAT CAGR = [(Ending PAT / Beginning PAT)^(1 / Number of Years) - 1] * 100
Where,
Beginning PAT = PAT at the start of the period
Ending PAT = PAT at the end of the period
Number of Years = Time period considered
Understanding the Calculation of PAT and PAT CAGR Using an Example
Consider Circle Ltd. with the following data,
Total Revenue = Rs. 1,000 crore
Operating Expenses = Rs. 80 crore
Interest Expense = Rs. 50 crore
Tax Expense = Rs. 50 crore
PAT = Total Revenue - Operating Expenses - Interest - Taxes
PAT = 1000-800-50-50 = Rs. 100 crores
If the profit of this company increased from Rs. 100 crores to Rs. 200 crores in 5 years, the PAT CAGR for Circle Ltd. in this period is calculated as follows.
PAT CAGR = [(Ending PAT / Beginning PAT)^(1 / Number of Years) - 1] * 100
PAT CAGR = [(200 / 100)^(⅕) - 1] *100 = 14.87%
Thus, the company's profits grew at an average rate of 14.87% per year over the five-year period.

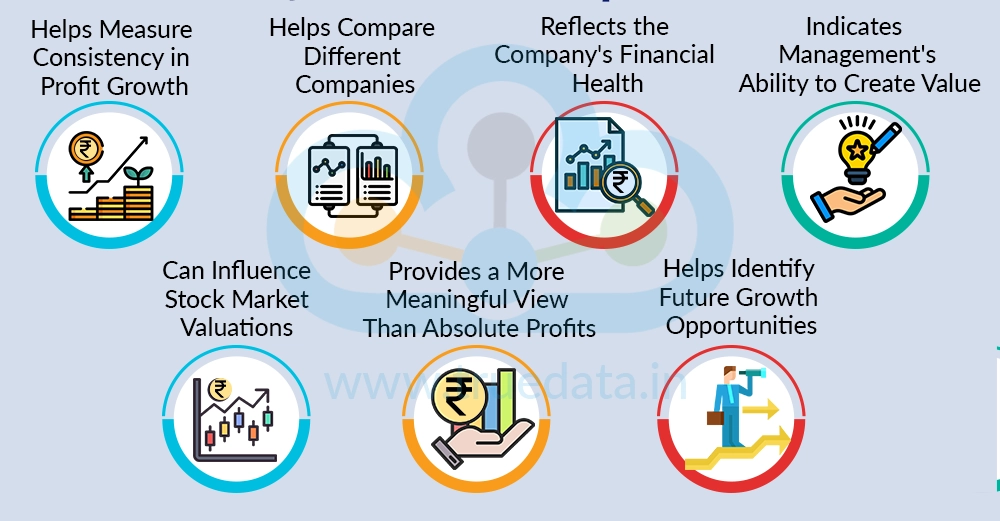
PAT CAGR is an important metric because it helps investors look beyond a company's current profits and understand how its earnings have grown over time. A company that consistently increases its profits year after year is often better positioned to create long-term value for shareholders. Since stock prices tend to follow earnings growth over the long run, PAT CAGR can provide useful insights into a company's financial strength and future potential. The importance of PAT CAGR is explained below.
A company's profit in a single year can be influenced by temporary factors such as one-time gains, cost savings, or favourable market conditions. PAT CAGR smooths out these short-term fluctuations and shows the average annual growth in profits over a longer period. This helps investors identify businesses that have delivered steady earnings growth rather than relying on occasional spikes in profitability.
PAT CAGR makes it easier to compare the profit growth of companies across the same industry. For example, if two companies have similar profits today, the one with a higher PAT CAGR over the last five years may have demonstrated stronger growth and better business execution. This can help investors identify companies with superior growth potential.
Growing profits consistently over many years often reflect effective leadership and sound business strategies. A strong PAT CAGR may suggest that the management team is making good decisions regarding expansion, product development, cost control, and capital allocation. Investors often view sustained profit growth as a sign of competent management.
Consistent growth in PAT often indicates that a company is managing its operations efficiently, controlling costs, and generating sustainable earnings. A healthy PAT CAGR can signal that the business has a strong foundation and is capable of growing even in changing market conditions. Investors can use this information to assess the overall quality of a company.
Investors and analysts often assign higher valuations to companies that have demonstrated consistent earnings growth. A strong PAT CAGR can improve investor confidence and attract greater market interest, which may positively influence a company's stock price over time. While profit growth alone does not guarantee returns, it is one of the key factors that the market considers when valuing a business.
Large companies often report higher profits simply because of their size. PAT CAGR focuses on the rate of growth rather than the absolute profit amount, giving investors a better understanding of how quickly a company's earnings are expanding. This allows for a more meaningful assessment of growth potential, especially when comparing companies of different sizes.
A company with a healthy PAT CAGR may be benefiting from factors such as increasing demand, market expansion, strong competitive advantages, or efficient operations. Analysing PAT CAGR can help investors identify businesses that are successfully growing and may continue to perform well in the future or in the face of adverse market or economic conditions. However, it is important to evaluate whether such growth is sustainable before making investment decisions.

Both PAT CAGR and Revenue CAGR are important metrics that help investors evaluate a company's growth story. While Revenue CAGR shows how quickly a company is growing its sales, PAT CAGR reveals whether that growth is translating into higher profits. Looking at both metrics together can provide valuable insights into a company's financial health, business quality, and long-term investment potential. The key parameters to focus on for deeper analysis include,
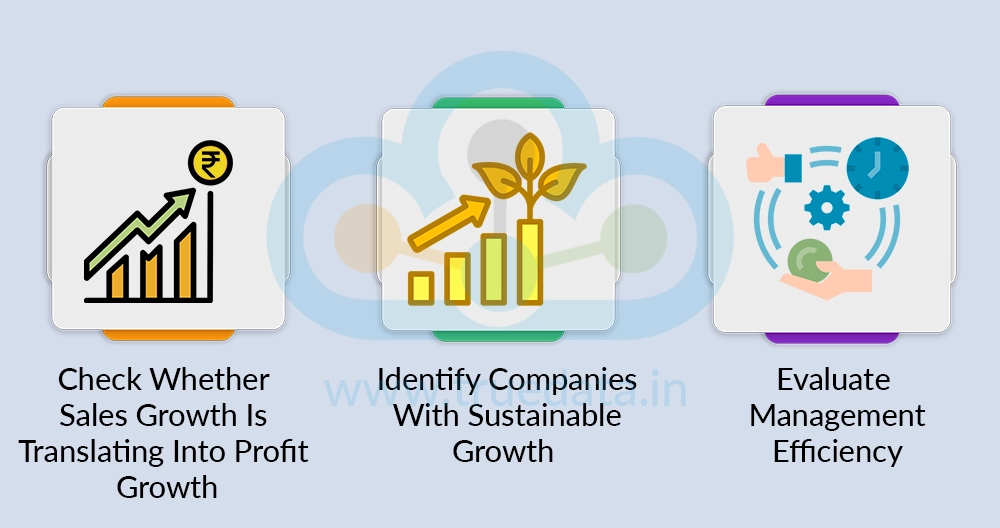
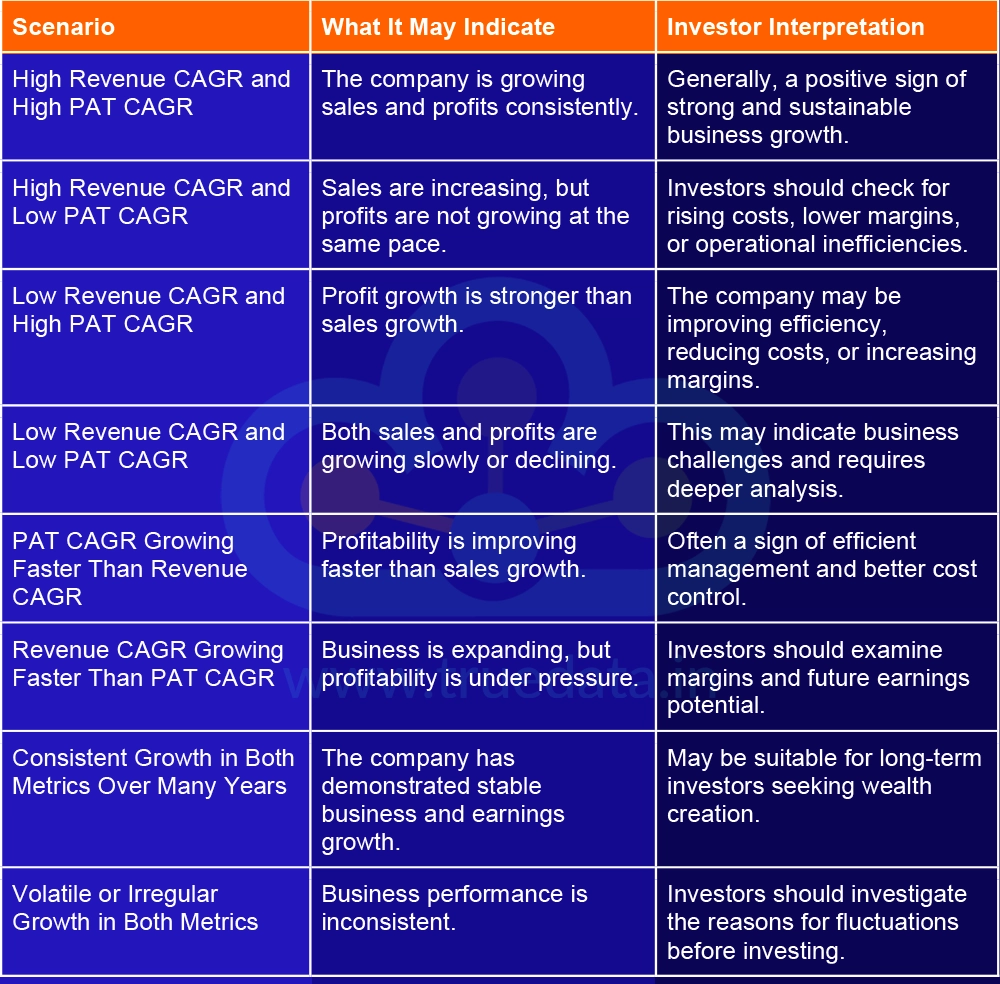
Check Whether Sales Growth Is Translating Into Profit Growth - A company may report strong revenue growth, but that does not automatically mean it is becoming more profitable. Rising costs, higher interest expenses, or lower margins can reduce profits even when sales are increasing. When analysing a stock, investors should compare Revenue CAGR with PAT CAGR. If both are growing steadily, it may indicate that the company is expanding its business while also managing costs effectively. This is generally a positive sign for long-term investors.
Identify Companies With Sustainable Growth - Companies that consistently grow both their revenue and profits over several years often have strong business models and competitive advantages. Such businesses may be better positioned to withstand economic slowdowns and changing market conditions. A healthy Revenue CAGR supported by a strong PAT CAGR can indicate that growth is sustainable rather than temporary. Investors can use these metrics to identify companies that have demonstrated consistent performance over time.
Evaluate Management Efficiency - Management plays a key role in converting sales into profits. If a company's Revenue CAGR is high but PAT CAGR remains low, it could suggest that expenses are rising too quickly or that the company is struggling to improve profitability. On the other hand, if PAT CAGR grows faster than Revenue CAGR, it may indicate that management is improving operational efficiency, controlling costs, and enhancing profit margins. This can be a sign of effective leadership and sound business strategies.
Interpreting PAT CAGR and Revenue CAGR for Investment Decisions


After analysing PAT CAGR in detail, it is clear that it is an important metric in fundamental analysis. However, investors should also consider the limitations of PAT CAGR for an accurate analysis of a company.
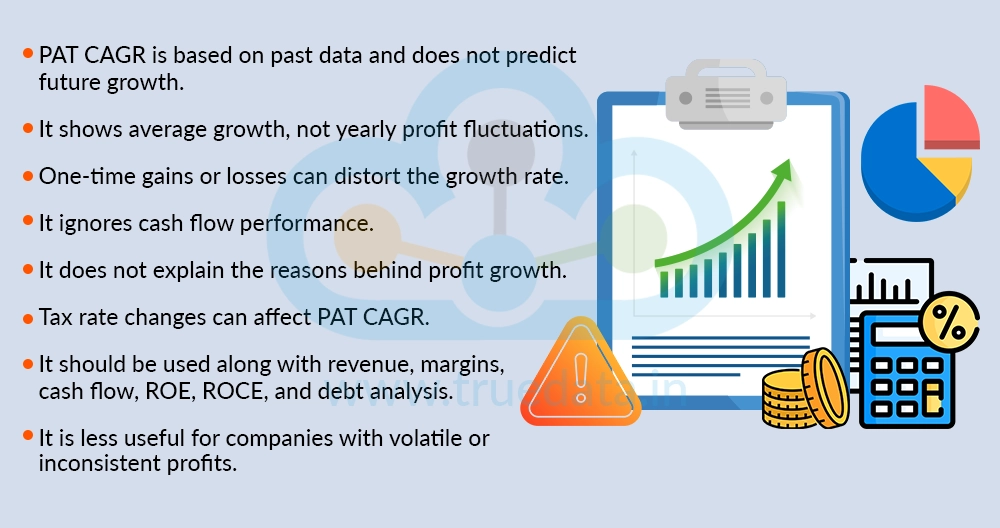
PAT CAGR is based on historical data, so it does not guarantee future profit growth.
It does not show yearly fluctuations in profits, as it only provides an average growth rate over a period.
One-time gains or losses can distort PAT CAGR, making the growth rate appear higher or lower than it actually is.
PAT CAGR does not consider cash flows, so a company may show profit growth while facing cash flow issues.
It does not reveal the reasons behind profit growth, such as higher sales, cost reductions, or tax benefits.
Changes in tax rates can affect PAT CAGR, even if the company's core business performance remains unchanged.
PAT CAGR should not be used in isolation, and investors should also analyse revenue growth, margins, cash flows, ROE, ROCE, and debt levels.
It may not be useful for companies with volatile or inconsistent profits, as the average growth rate can hide underlying business challenges.
PAT CAGR is a useful metric that helps investors understand how consistently a company has grown its profits over time. Unlike a single year's profit figure, it provides a broader view of a company's earnings growth and financial strength. While a strong PAT CAGR can indicate a healthy and growing business, it should not be analysed in isolation. Investors should also consider several other factors such as revenue growth, cash flows, debt levels, and return ratios before making investment decisions.
This article is yet another addition to our series on fundamental analysis and understanding the profitability of a company in a better light. Let us know your thoughts on the topic or if you need further information on the same, and we will address it soon.
Till then, Happy Reading!
Read More: Return on Investment (ROI) - What it is and How to Calculate it?
Thestock market never stands still, and prices swing constantly with every new h...
Debt and equity together form the total capital of a company. However, when anal...
Corporate data is more than just the numbers of a company. They can show what is...