When you invest in a company, you probably look at its profits, revenue growth, and future potential. But have you ever wondered how to tell if a company is financially strong enough to survive tough times? Or whether it could be heading towards financial distress despite reporting good numbers? This is where the Altman Z Score can help. It is a powerful financial metric that gives investors an early indication of a company's financial stability and the risk of bankruptcy. Read on to understand the meaning of the Altman Z Score, its calculation, and why it deserves a place in every investor's fundamental analysis toolkit.

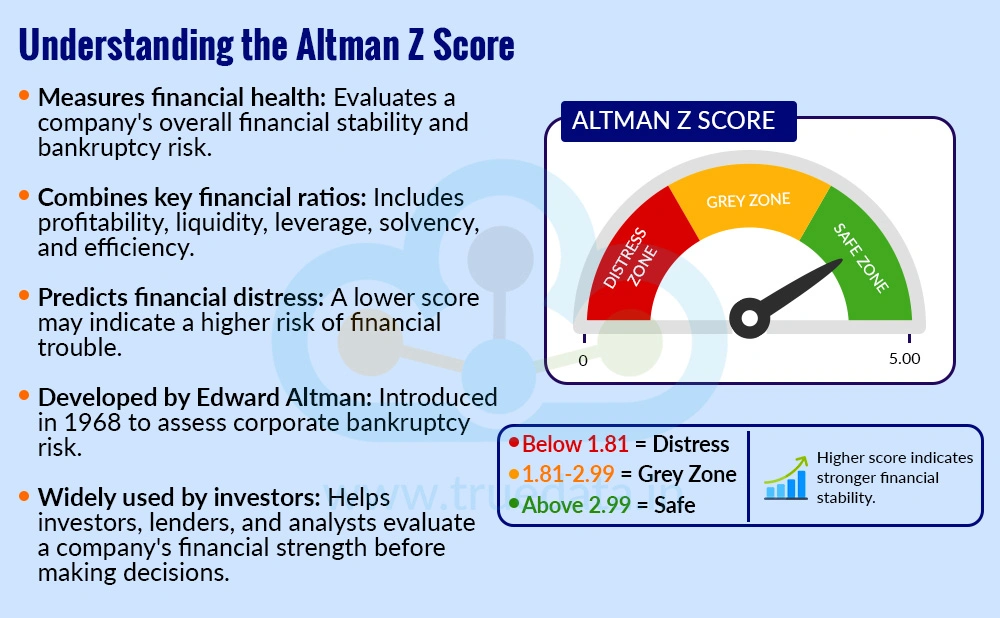
The Altman Z Score is a financial ratio used to measure a company's financial health and estimate the likelihood of it facing financial distress or bankruptcy. It combines several important financial ratios, such as profitability, liquidity, solvency, leverage, and operating efficiency, into a single score. A higher Altman Z Score generally indicates that a company is financially stable, while a lower score may suggest that it is under financial stress and could face difficulties if its financial position does not improve. Investors often use this metric as part of their fundamental analysis to identify potential risks before investing in a company's shares.
The Altman Z Score was developed in 1968 by Edward I. Altman, an American finance professor at New York University. He created this model after studying the financial statements of companies that had gone bankrupt and comparing them with financially healthy businesses. He developed a formula that could predict the probability of corporate bankruptcy with reasonable accuracy by analysing common financial patterns. Although it was originally designed for manufacturing companies, newer versions of the Altman Z Score have since been developed for private companies, non-manufacturing businesses, and firms operating in different industries. Today, it remains one of the most widely used tools by investors, lenders, analysts, and financial institutions to assess a company's financial strength before making investment or lending decisions.
The Altman Z Score is calculated using five financial ratios that measure different aspects of a company's financial health, such as liquidity, profitability, leverage, and efficiency. The formula to calculate the Altman Z Score was originally used for publicly listed manufacturing companies. However, as the model gained widespread acceptance among analysts, investors, and credit rating professionals around the world, the need to develop revised and adapted versions of the original model for private and non-manufacturing companies arose.
The different versions of the Altman Z Score are explained below.
This is the original formula developed in 1968 and used specifically for manufacturing companies. This formula is best suited to evaluate companies belonging to the steel, cement, auto, and chemical sectors.
Altman Z Score = 1.2(X₁) + 1.4(X₂) + 3.3(X₃) + 0.6(X₄) + 1.0(X₅)
Where:
X₁ = Working Capital / Total Assets
X₂ = Retained Earnings / Total Assets
X₃ = EBIT / Total Assets
X₄ = Market Value of Equity / Total Liabilities
X₅ = Sales / Total Assets
Understanding the Formula Using Example
Consider Square Ltd. with the following data.

Calculating the Altman Z Score for Square Limited.

Step 1 - Calculating the Working Capital
Working Capital = Current Assets - Current Liabilities
Working Capital = 800-500 = Rs. 300 crores
Step 2 - Calculating X₁
X₁ = Working Capital / Total Assets
X₁ = 300/2000 = 0.15
Step 3 - Calculating X₂
X₂ = Retained Earnings / Total Assets
X₂ = 600/2000 = 0.30
Step 4 - Calculating X₃
X₃ = EBIT / Total Assets
X₃ = 250/2000 = 0.125
Step 5 - Calculating X₄
X₄ = Market Value of Equity / Total Liabilities
X₄ = 2400 / 1200 = 2
Step 6 - Calculating X₅
X₅ = Sales / Total Assets
X₅ = 3000/2000 = 1.5
Step 7 - Calculating Altman Z Score
Altman Z Score = 1.2(X₁) + 1.4(X₂) + 3.3(X₃) + 0.6(X₄) + 1.0(X₅)
Altman Z Score = 1.2(0.18) + 1.4(0.30) + 3.3(0.125) + 0.6(2) + 1(1.5) = 3.7125 ≈ 3.71
Interpretation -
An Altman Z Score of 3.71 indicates that Square Ltd. is in a financially healthy position and has a low probability of financial distress or bankruptcy according to the Altman Z Score model.
In 1983, Edward Altman introduced the Altman Z' Score to overcome a key limitation of the original model, which relied on the market value of equity, a measure that is not available for private companies. Thus, to make the model suitable for privately held businesses, he replaced the market value of equity with the book value of equity from the balance sheet and recalibrated the formula with new coefficients. This made the Altman Z' Score a more practical and reliable tool for assessing the financial health of private manufacturing companies. This formula is best suited for evaluating unlisted firms and SME IPOs.
The formula for the Altman Z’ Score (Z Prime Score) in this case is,
Altman Z’ Score = 0.717(X₁) + 0.847(X₂) + 3.107(X₃) + 0.420(X₄) + 0.998(X₅)
Where,
X₁ = Working Capital / Total Assets
X₂ = Retained Earnings / Total Assets
X₃ = EBIT / Total Assets
X₄ = Book Value of Equity / Total Liabilities
X₅ = Sales / Total Assets
Understanding the Formula Using Example
Consider Triangle Limited with the following data.

Calculating the Altman Z’ Score for Triangle Limited.

Step 1 - Calculating the Working Capital
Working Capital = Current Assets - Current Liabilities
Working Capital = 500-350 = Rs. 150 crores
Step 2 - Calculating X₁
X₁ = Working Capital / Total Assets
X₁ = 150/1200 = 0.125
Step 3 - Calculating X₂
X₂ = Retained Earnings / Total Assets
X₂ = 300/1200 = 0.25
Step 4 - Calculating X₃
X₃ = EBIT / Total Assets
X₃ = 180/1200 = 0.15
Step 5 - Calculating X₄
X₄ = Book Value of Equity / Total Liabilities
X₄ = 700/500 = 1.40
Step 6 - Calculating X₅
X₅ = Sales / Total Assets
X₅ = 1800/1200 = 1.5
Step 7 - Calculating Altman Z Score
Altman Z’ Score = 0.717(X₁) + 0.847(X₂) + 3.107(X₃) + 0.420(X₄) + 0.998(X₅)
Altman Z’ Score = 0.717(0.125) + 0.847(0.25) + 3.107(0.15) + 0.420(1.40) + 0.998(1.5) = 2.85.
Interpretation -
A Z' Score of 2.85 places the company in the Grey Zone. While the business is not showing clear signs of financial distress, investors should analyse its debt, profitability, cash flow, and future growth before making an investment decision.
Edward Altman introduced the Altman Z'' Score in 1995 to make the model more suitable for non-manufacturing and service-based businesses. Unlike manufacturing companies, businesses such as IT firms, consulting companies, financial services providers, and other service organisations typically have fewer physical assets but can still generate high revenue. As a result, the X₅ (Sales / Total Assets) ratio used in the original formula can give an overly positive picture of their financial health. To address this, Altman removed the X₅ ratio from the formula, recalibrated the remaining four variables with new weights, and replaced the market value of equity with the book value of equity. This made the Altman Z'' Score a more reliable tool for evaluating both listed and unlisted non-manufacturing companies. This formula is best suited for evaluating IT, FMCG, retail, and healthcare sectors.
The formula for the Altman Z” Score in this case is,
Altman Z” Score = 6.56(X₁) + 3.26(X₂) + 6.72(X₃) + 1.05(X₄)
Where,
X₁ = Working Capital / Total Assets
X₂ = Retained Earnings / Total Assets
X₃ = EBIT / Total Assets
X₄ = Book Value of Equity / Total Liabilities
Understanding the Formula Using Example
Consider Rectangle Limited with the following data.

Calculating the Altman Z” Score for Rectangle Limited.

Step 1 - Calculating the Working Capital
Working Capital = Current Assets - Current Liabilities
Working Capital = 900-500 = Rs. 400 crores
Step 2 - Calculating X₁
X₁ = Working Capital / Total Assets
X₁ = 400/2000 = 0.20
Step 3 - Calculating X₂
X₂ = Retained Earnings / Total Assets
X₂ = 700/2000 = 0.35
Step 4 - Calculating X₃
X₃ = EBIT / Total Assets
X₃ = 320/2000 = 0.16
Step 5 - Calculating X₄
X₄ = Book Value of Equity / Total Liabilities
X₄ = 1500/800= 1.875
Step 6 - Calculating Altman Z Score
Altman Z” Score = 6.56(X₁) + 3.26(X₂) + 6.72(X₃) + 1.05(X₄)
Altman Z” Score = 6.56(0.20) + 3.26(0.35) + 6.72(0.16) + 1.05(1.875) = 5.50.
Interpretation -
A Z” Score of 5.50 places the company comfortably in the Safe Zone. It suggests that the company has a strong financial position, healthy profitability, manageable liabilities, and a low probability of financial distress based on the Altman Z'' model.
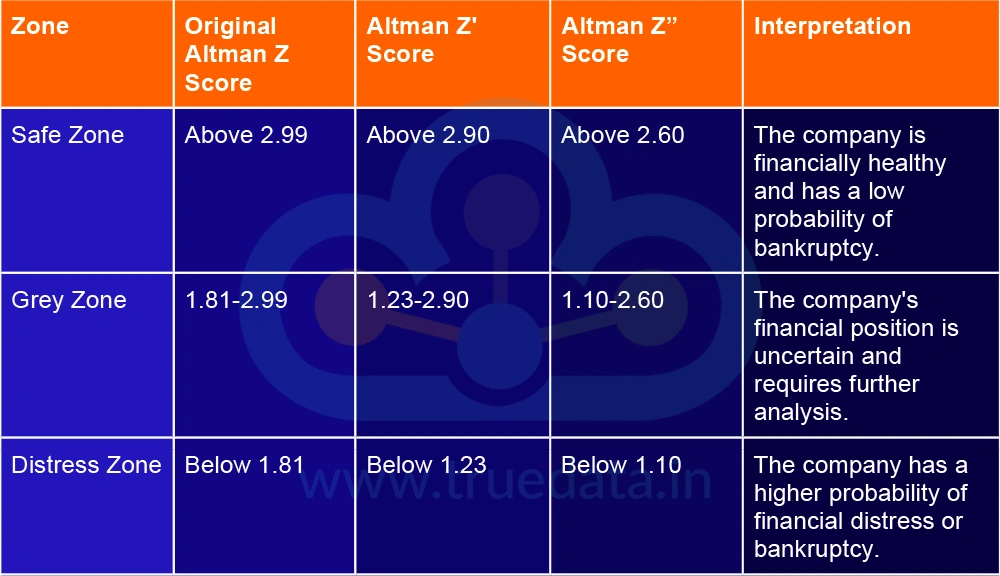
After calculating the Altman Z Score, the next step is to understand what the score indicates about a company's financial health. In general, a higher score suggests stronger financial stability and a lower risk of financial distress, while a lower score indicates a higher probability of financial difficulties. Since there are three versions of the Altman Z Score, investors should use the interpretation that matches the type of company being analysed.

Safe Zone - A company with a score above 2.99 is generally considered financially strong. This usually indicates,
Good liquidity to meet short-term obligations.
Healthy profitability.
Manageable debt levels.
Efficient use of assets to generate revenue.
Strong overall financial stability.
Grey Zone - A score in this range suggests that the company's financial health is uncertain. Investors should check the following,
Review profitability and cash flow trends.
Assess debt repayment ability.
Analyse recent financial results.
Compare the company with industry peers before making an investment decision.
Distress Zone - A score below 1.81 indicates a higher level of financial risk. This may result from,
High debt.
Weak profitability.
Poor cash flow.
Difficulty meeting financial obligations.
Inefficient use of assets.
While a high Altman Z Score is a positive sign, investors should always use it alongside other financial ratios, management quality, industry outlook, and future growth prospects before making an investment decision.

The Altman Z Score is an important fundamental analysis tool because it helps investors evaluate a company's financial strength and identify potential warning signs before investing. Rather than focusing only on profits or revenue growth, it gives a broader view of the company's overall financial health. The importance of this metric is explained below.
Helps Assess Financial Stability - The Altman Z Score gives an overall picture of a company's financial health by combining key financial ratios into a single score. This makes it easier for investors to judge whether a company is financially stable or showing signs of financial weakness.
Identifies the Risk of Financial Distress - One of the biggest advantages of the Altman Z Score is that it can indicate whether a company may face financial distress in the future. A low score acts as an early warning sign, allowing investors to investigate the company's financial position more carefully before making an investment decision.
Supports Better Investment Decisions - Instead of relying only on revenue growth or profits, investors can use the Altman Z Score to understand whether the company's financial foundation is strong. This helps in selecting companies that are not only growing but are also financially healthy.
Combines Multiple Financial Ratios into One Score - The Altman Z Score considers several important aspects of a business, including liquidity, profitability, leverage, solvency, and operating efficiency. By combining these factors into a single metric, it provides a more comprehensive assessment of a company's financial condition than relying on one ratio alone.
Helps Compare Companies - Investors can use the Altman Z Score to compare companies operating in the same industry. When analysing similar businesses, the company with the stronger Z Score generally has a more stable financial position, although other financial metrics should also be considered.
Useful for Long-Term Investors - Long-term investors often look for companies with strong financial fundamentals. The Altman Z Score helps identify businesses that are financially resilient and better positioned to withstand economic slowdowns or industry challenges over time.
Assists in Credit and Lending Decisions - The Altman Z Score is not only useful for investors but also for banks, financial institutions, and lenders. It helps them evaluate a company's ability to meet its financial obligations before approving loans or extending credit.
Encourages Comprehensive Fundamental Analysis - The Altman Z Score should not be viewed as a standalone investment tool. Instead, it works best when used alongside other fundamental analysis measures such as ROE, ROCE, P/E Ratio, P/B Ratio, cash flow analysis, debt ratios, and earnings growth. Together, these metrics provide a more complete understanding of a company's financial health and future prospects.
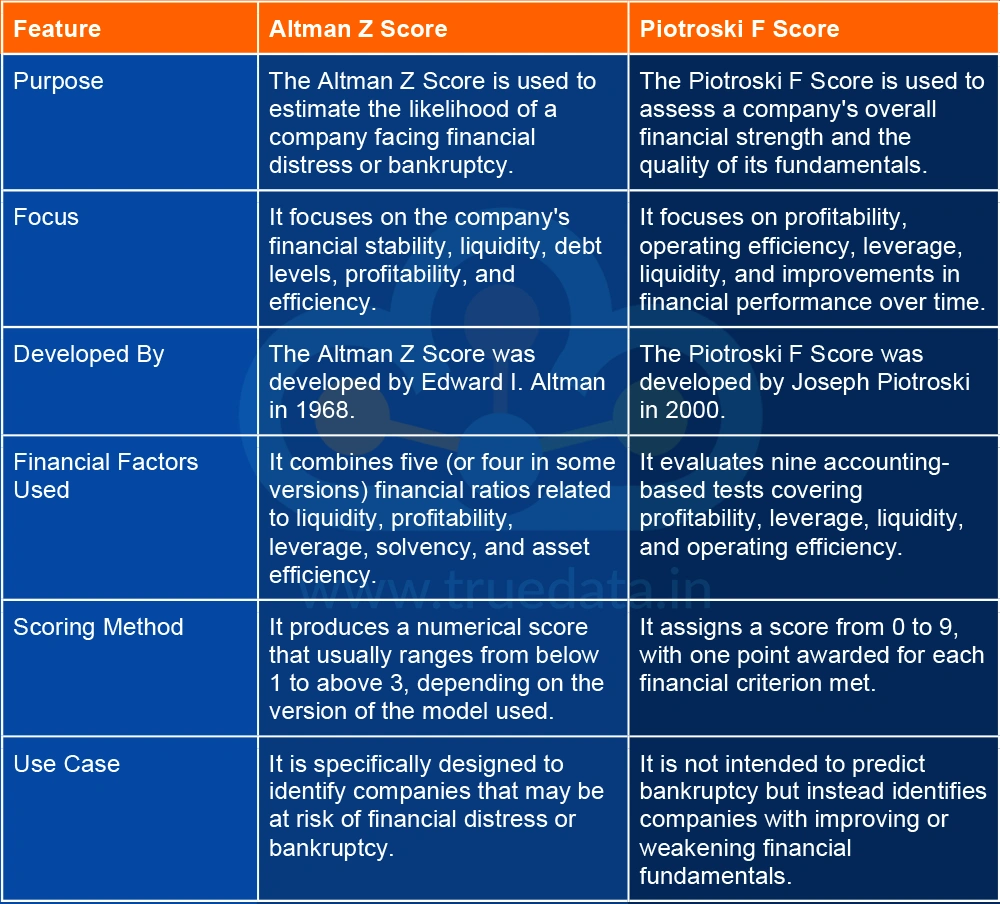
Both the Altman Z Score and the Piotroski F Score are popular tools used in fundamental analysis, but they serve different purposes. The Altman Z Score mainly measures a company's financial stability and bankruptcy risk, while the Piotroski F Score evaluates its overall financial strength and operational performance. Understanding the differences between the two can help investors use them more effectively.


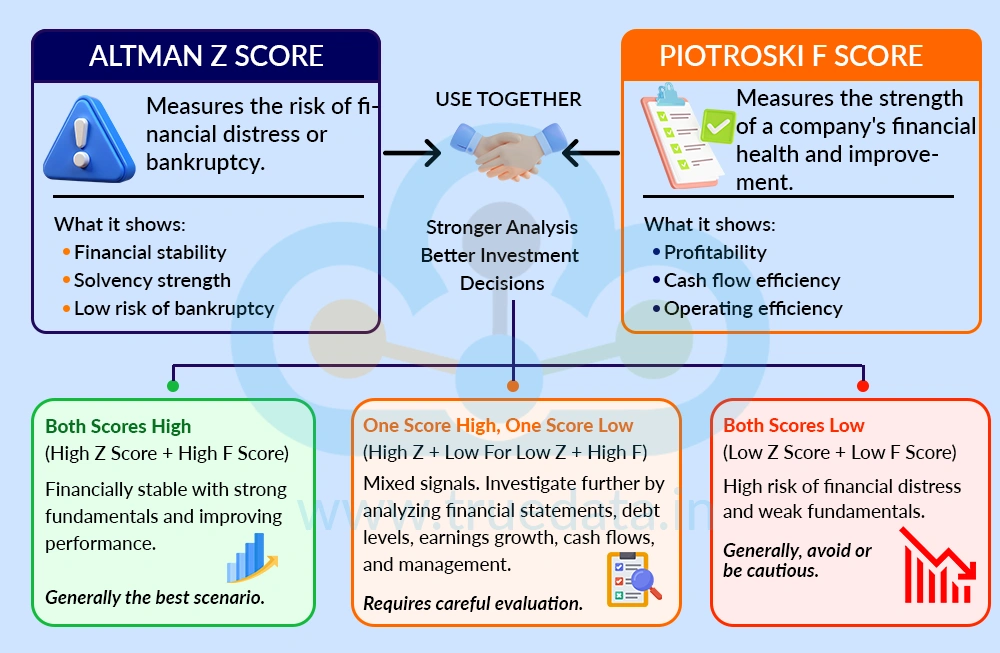
Investors can use the Altman Z Score and the Piotroski F Score together to get a more complete view of a company's financial health before investing. The Altman Z Score helps assess whether a company is financially stable and has a low risk of financial distress or bankruptcy, while the Piotroski F Score indicates whether the company's profitability, cash flow, operating efficiency, and overall financial performance are improving. A company with a high Altman Z Score and a high Piotroski F Score is generally considered financially stronger and fundamentally healthier than one with low scores on both metrics. However, if one score is strong and the other is weak, investors should investigate the reasons by reviewing the company’s financial statements, debt levels, earnings growth, cash flows, and management performance. By combining these two metrics with other fundamental analysis tools such as the P/E Ratio, P/B Ratio, ROE, ROCE, and industry analysis, investors can make more informed investment decisions and reduce the risk of selecting financially weak companies.
The Altman Z Score is a valuable fundamental analysis tool that helps investors assess a company's financial health and estimate its risk of financial distress. By analysing factors such as liquidity, profitability, debt, and asset efficiency, it provides an early indication of whether a company is financially stable. However, it should not be used in isolation. Investors should combine the Altman Z Score with other financial ratios, cash flow analysis, valuation metrics, and industry research to make well-informed investment decisions. Using a comprehensive approach can help investors identify fundamentally strong companies and build a more resilient long-term investment portfolio.
This article focuses on yet another financial score and its place in fundamental company analysis. Let us know your thoughts on the topic or if you need further information, and we will address it soon.
Till then, Happy Reading!
Read More: Narrative vs Numbers - When Stories Drive Stock Prices More Than Fundamentals
Thestock market never stands still, and prices swing constantly with every new h...
Corporate data is more than just the numbers of a company. They can show what is...
Investing is not just about numbers on a screen. It is about understanding the s...