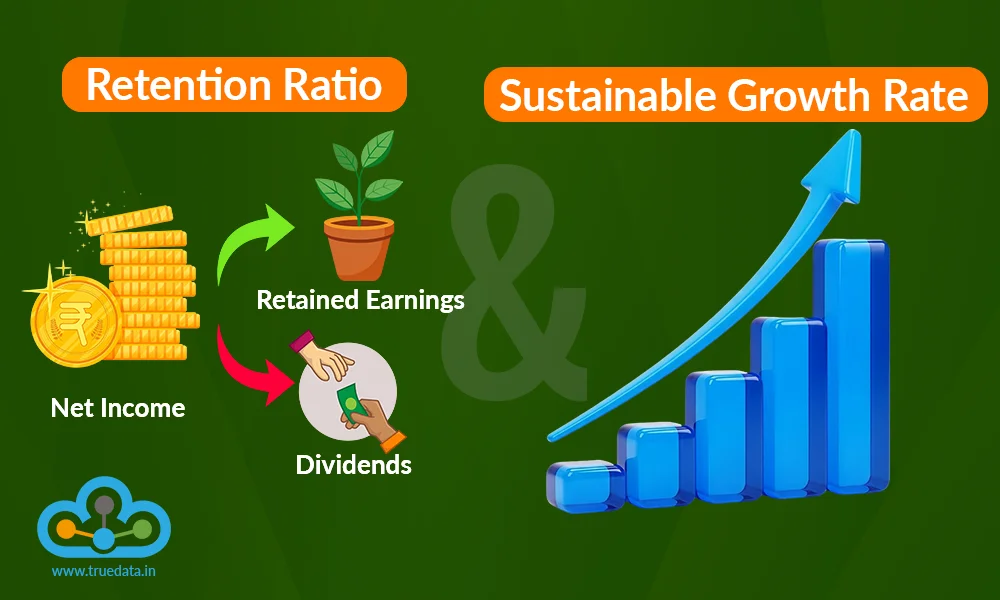
A company that consistently earns profits has greater flexibility to fund its growth, strengthen its finances, and reward shareholders. However, it must carefully decide how much of its profit to retain in the business and how much to distribute to investors as dividends. Retaining too little may limit future growth, while retaining too much without putting the funds to productive use can reduce their value to shareholders. So, how does a company strike the right balance? This is where the Retention Ratio and Sustainable Growth Rate (SGR) become useful. Check out this blog where we discuss the meaning of retention ratio and sustainable growth rate and their importance for a business.

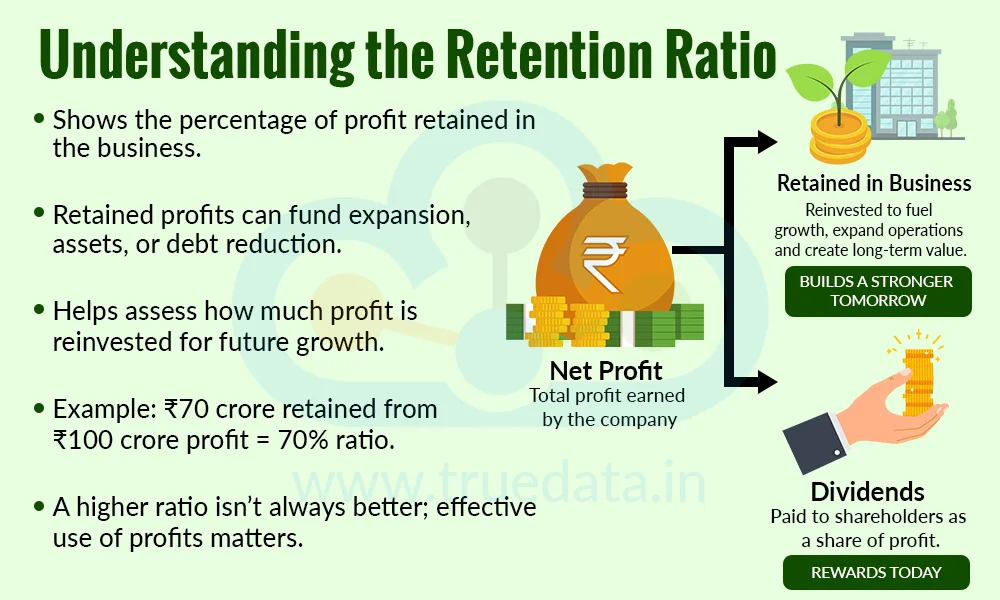
The Retention Ratio is a financial ratio that shows the percentage of a company’s net profit that it keeps in the business instead of paying out to shareholders as dividends. The retained portion can be used for purposes such as expanding operations, buying new assets, reducing debt, funding research and development, or meeting future working capital needs. For investors, the Retention Ratio can provide an idea of how much profit a company is reinvesting to support its future growth. For example, if a company earns Rs. 100 crore in net profit and pays Rs. 30 crore as dividends, it retains Rs. 70 crore, giving it a Retention Ratio of 70%. A higher ratio does not automatically mean a company is better, as investors should also consider whether the company can use its retained profits effectively to generate sustainable growth and returns.
The Retention Ratio can be calculated using the company’s net profit and the dividends it pays to shareholders. It tells investors how much of the profit is retained in the business after paying dividends.
The formulas for calculating the Retention Ratio are explained below.
Formula 1 - Using Net Income and Dividends

The most common formula to calculate the retention ratio uses the net income and dividends. This formula is explained below.
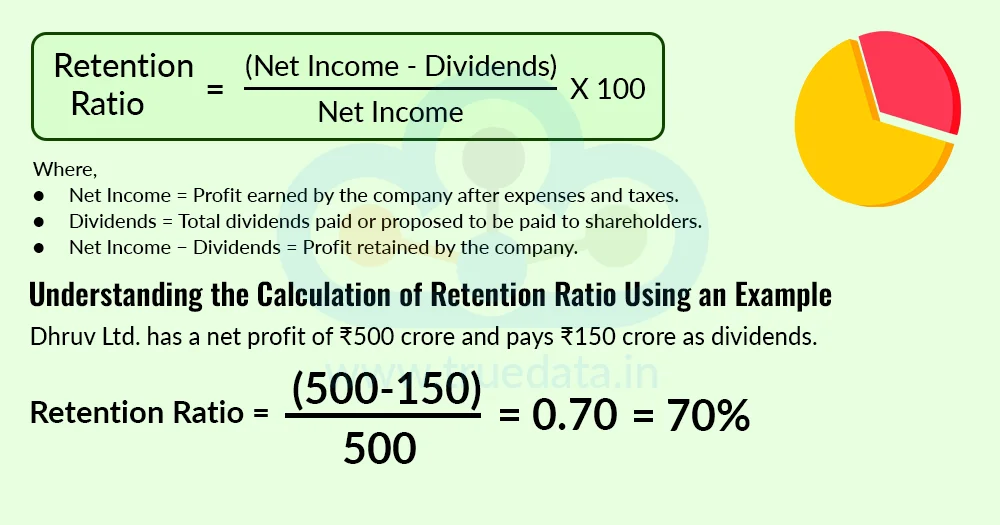
Retention Ratio = (Net Income - Dividends) / Net Income * 100
Where,
Net Income = Profit earned by the company after expenses and taxes.
Dividends = Total dividends paid or proposed to be paid to shareholders.
Net Income − Dividends = Profit retained by the company.
Understanding the Calculation of Retention Ratio Using an Example
Consider Dhruv Ltd. with a net profit of Rs. 500 crores and dividends paid to the tune of Rs. 150 crores. The Retention Ratio for Dhruv Ltd. is calculated as under.
Retention Ratio = (Net Income - Dividends) / Net Income * 100
Retention Ratio = (500-150)/500*100 = 0.70 = 70%
This means the company retains 70% of its profit in the business and distributes the remaining 30% as dividends.
Formula 2 - Using Dividend Payout Ratio

The Retention Ratio can also be calculated using the Dividend Payout Ratio. The formula for calculating the retention ratio is,
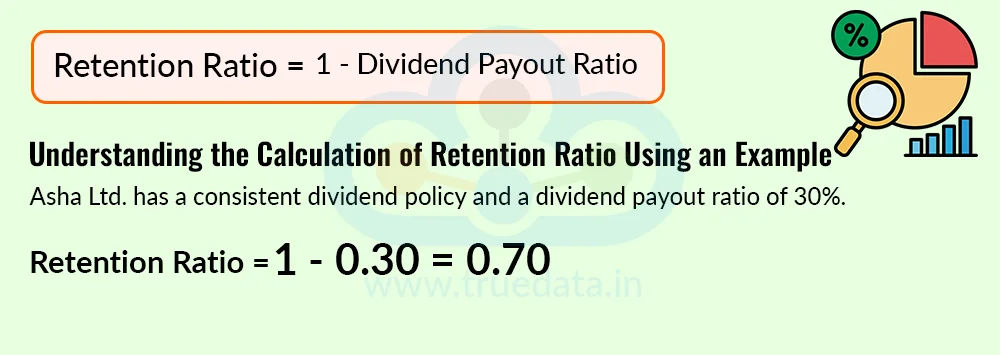
Retention Ratio = 1 - Dividend Payout Ratio
Understanding the Calculation of Retention Ratio Using an Example
Asha Ltd. has a consistent dividend policy and a dividend payout ratio of 30%. The retention ratio for this company is explained below.
Retention Ratio = 1 - Dividend Payout Ratio
Retention Ratio = 1 - 0.30 = 0.70
Investors should also check the company's financial statements and dividend announcements to understand whether the figures represent dividends actually paid, declared, or proposed.
Investors can use the Retention Ratio to understand how much of a company’s profit is being kept for future business needs. The interpretation of the retention ratio is explained below.

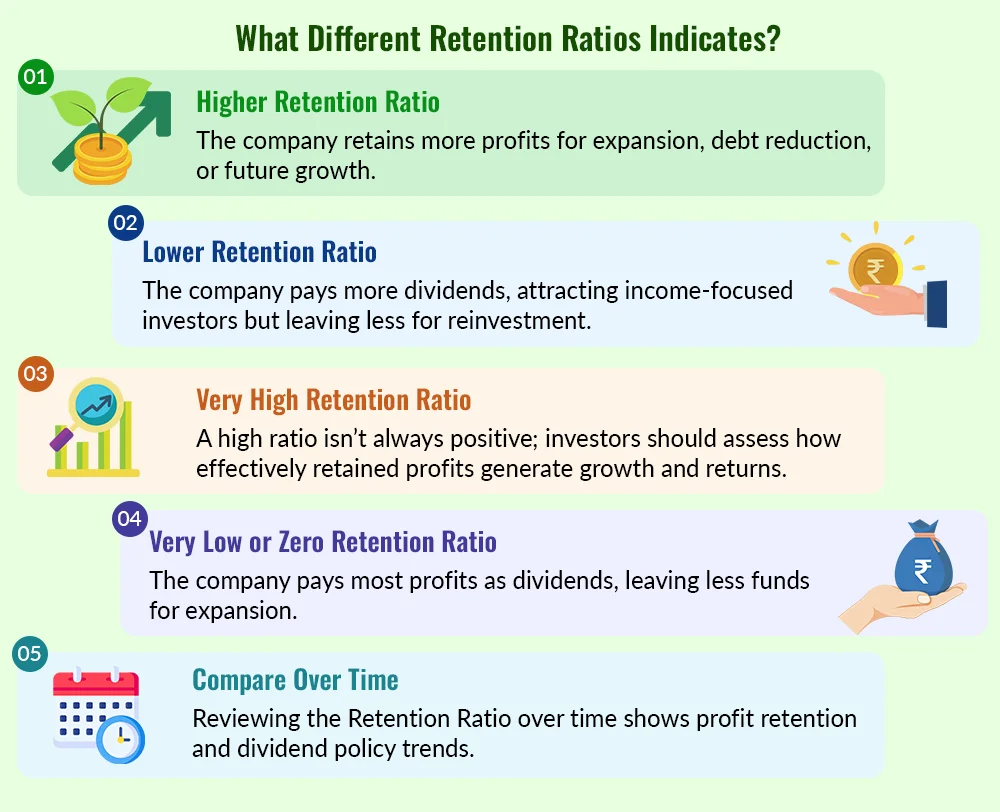
Higher Retention Ratio - The company is keeping a larger share of its profits in the business. This may indicate that it is focusing on expansion, reducing debt, or funding future growth.
Lower Retention Ratio - The company is distributing a larger portion of its profits as dividends. This may appeal to investors looking for regular dividend income, but it also means less profit is available for reinvestment.
Very High Retention Ratio - A high ratio is not automatically positive. Investors should check whether the company is using the retained profits effectively to generate growth and returns.
Very Low or Zero Retention Ratio - This may indicate that the company distributes most or all of its profits as dividends. While this can benefit shareholders seeking income, the company may have less internally generated funds for expansion.
Compare Over Time - Looking at the Retention Ratio over several years can help investors understand whether the company is consistently retaining and reinvesting its profits or frequently changing its dividend policy.

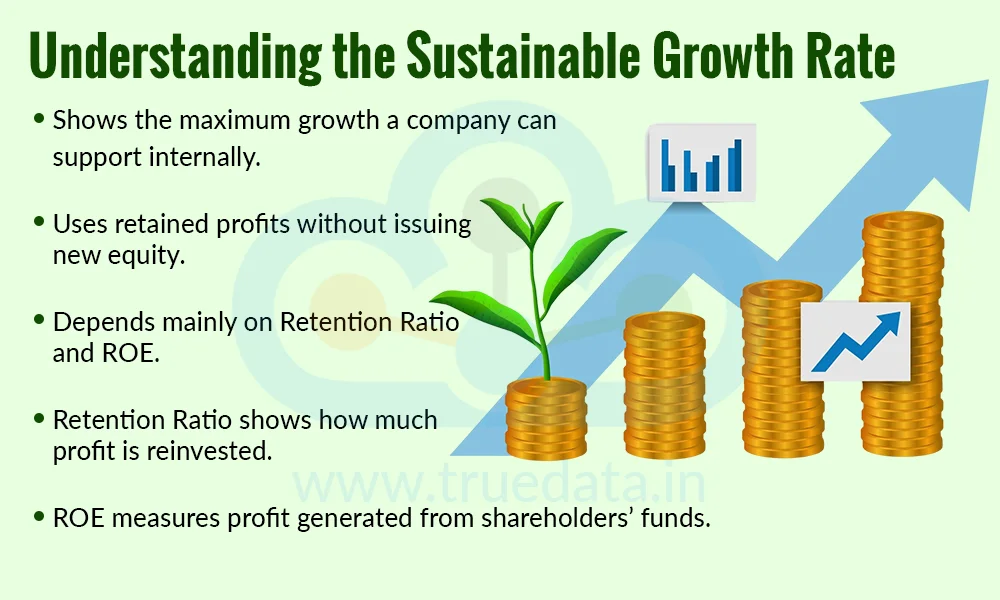
The Sustainable Growth Rate (SGR) is the maximum rate at which a company can grow its sales, profits, and overall business using its internally generated funds, without issuing new equity shares, while maintaining its existing financial and dividend policy. It indicates how quickly a company can grow by retaining a portion of its profits and reinvesting them in the business. The SGR depends mainly on two factors, i.e., the Retention Ratio, which shows how much profit the company keeps, and Return on Equity (ROE), which indicates how efficiently it uses shareholders’ funds to generate profits. For example, if a company has a Retention Ratio of 60% and an ROE of 15%, its SGR is 9% (60% * 15%). This means the company can theoretically support growth of around 9% through retained earnings while maintaining its existing financial structure and payout policy. SGR can be useful for assessing whether a company’s growth plans can be supported by the profits it retains, although actual growth can differ due to factors such as changes in demand, margins, debt, capital requirements, and business conditions.
The Sustainable Growth Rate (SGR) estimates how fast a company can grow using the profits it retains in the business, while maintaining its existing financial and dividend policies. There are two commonly used formulas to calculate SGR.
Formula 1 - Basic SGR Formula

The standard or most common SGR formula is,
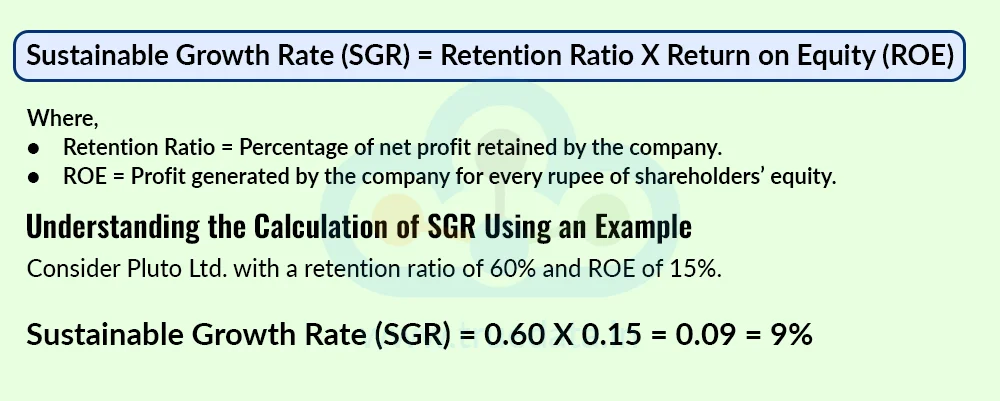
Sustainable Growth Rate (SGR) = Retention Ratio * Return on Equity (ROE)
Where,
Retention Ratio = Percentage of net profit retained by the company.
ROE = Profit generated by the company for every rupee of shareholders’ equity.
Understanding the Calculation of SGR Using an Example
Consider Pluto Ltd. with a retention ratio of 60% and ROE of 15%. The Sustainable Growth Rate for Pluto Ltd. is,
Sustainable Growth Rate (SGR) = Retention Ratio * Return on Equity (ROE)
Sustainable Growth Rate (SGR) = 0.60 * 0.15 = 0.09 = 9%
Thus, the company can theoretically grow at around 9% using its retained earnings while maintaining its existing financial and dividend policies.
Formula 2 - Using Dividend Payout Ratio

SGR can also be calculated using the dividend payout ratio. The formula for the same is,
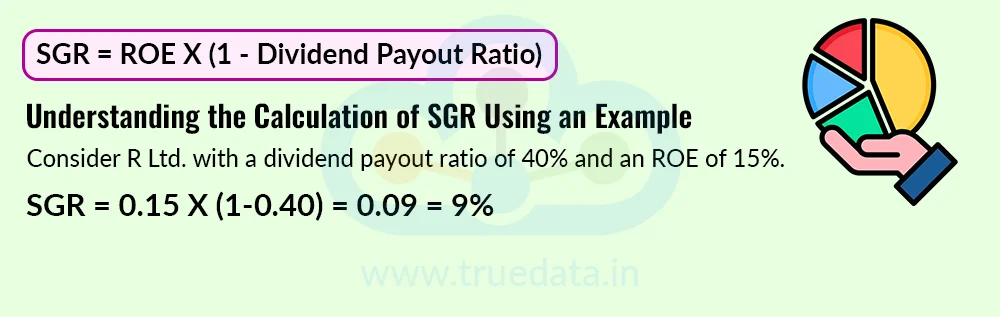
SGR = ROE * (1 - Dividend Payout Ratio)
Understanding the Calculation of SGR Using an Example
Consider R Ltd. with a dividend payout ratio of 40% and an ROE of 15%. The SGR for R Ltd. is,
SGR = ROE * (1 - Dividend Payout Ratio)
SGR = 0.15 * (1-0.40) = 0.09 = 9%
Formula 3 - Extended SGR Formula

A more detailed version can also be used when calculating growth based on changes in the company’s financial structure. The standard SGR formula is broken down using the DuPont Analysis to get the extended version of the formula.
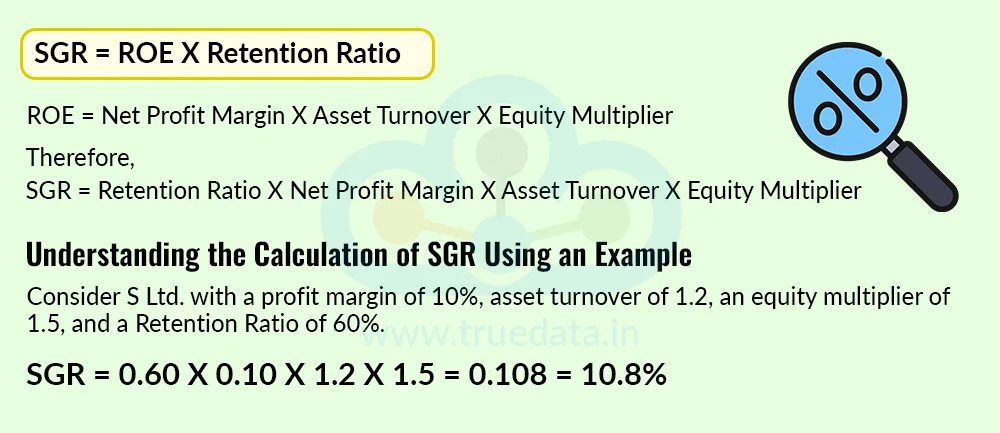
SGR = ROE * Retention Ratio
ROE = Net Profit Margin * Asset Turnover * Equity Multiplier
Therefore,
SGR = Retention Ratio * Net Profit Margin * Asset Turnover * Equity Multiplier
This approach helps investors understand what is driving the company’s sustainable growth, i.e., profit margins, how efficiently it uses assets, financial leverage, or the amount of profit it retains.
Understanding the Calculation of SGR Using an Example
Consider S Ltd. with a profit margin of 10%, asset turnover of 1.2, an equity multiplier of 1.5, and a Retention Ratio of 60%. The SGR for this company is calculated below.
SGR = Retention Ratio * Net Profit Margin * Asset Turnover * Equity Multiplier
SGR = 0.60 * 0.10 * 1.2 * 1.5 = 0.108 = 10.8%
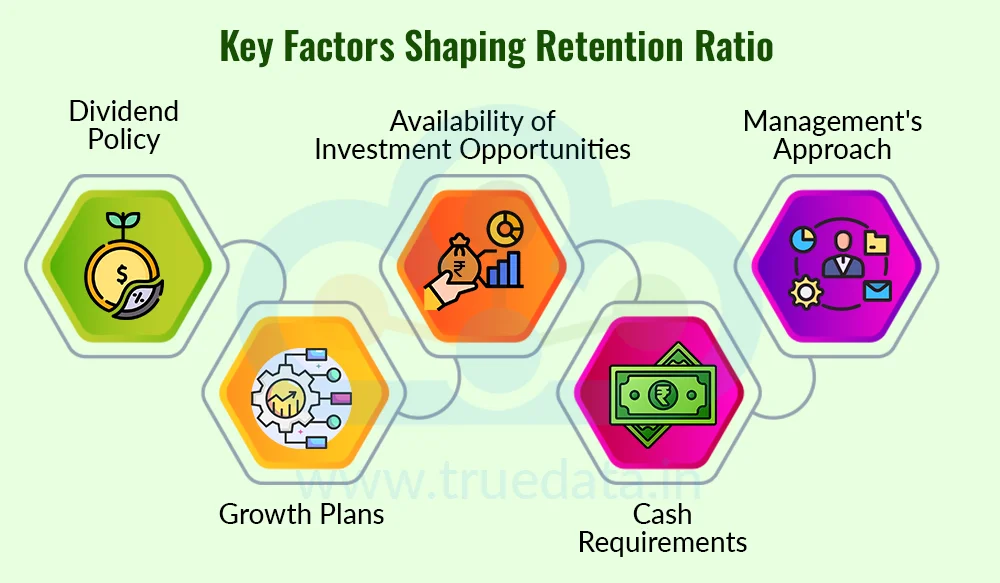
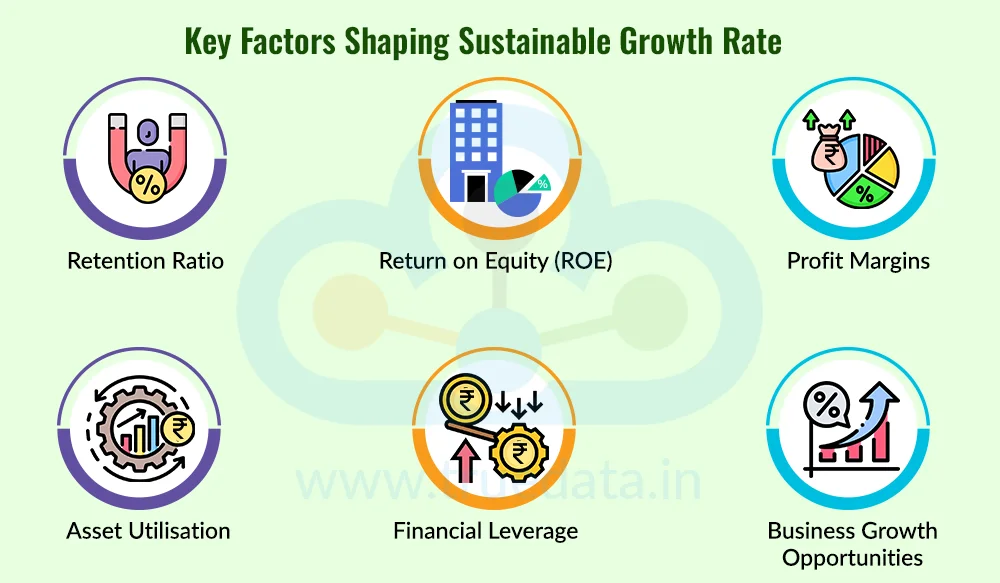
The Retention Ratio and Sustainable Growth Rate (SGR) are influenced by several business and financial factors. Understanding these factors can help investors assess how a company manages its profits and whether its growth can be supported by internal funds.

Dividend Policy - A company that pays a larger portion of its profits as dividends will have a lower Retention Ratio. On the other hand, a company that pays smaller dividends will retain more profits and have a higher ratio.
Growth Plans - Companies planning to expand their operations, enter new markets, launch products, or increase production capacity may retain more profits to fund these activities. This can result in a higher Retention Ratio.
Availability of Investment Opportunities - If a company has several profitable opportunities to invest in its business, it may retain more earnings. If suitable opportunities are limited, it may choose to distribute more profits to shareholders.
Cash Requirements - A company may retain a larger share of its profits to meet working capital needs, repay debt, purchase assets, or maintain a cash cushion. These requirements can affect how much profit is available for dividends.
Management's Approach - Management's preference also matters. Some companies follow a high-dividend policy, while others prefer to reinvest a larger portion of their earnings for future growth.

Retention Ratio - Retention Ratio is one of the key components of SGR. When a company retains a larger portion of its profits, it has more internal funds available for reinvestment, which can increase its potential sustainable growth rate, assuming the returns on those funds remain attractive.
Return on Equity (ROE) - SGR is directly influenced by ROE. A company generating higher returns on shareholders’ equity can potentially achieve a higher sustainable growth rate with the same Retention Ratio.
Profit Margins - Higher and stable profit margins can improve a company's ROE and provide more profits that can be reinvested in the business. Falling margins, however, can put pressure on sustainable growth.
Asset Utilisation - The efficiency of a company to use its assets to generate revenue can affect its ROE and, consequently, its SGR. Better asset utilisation can support higher returns without necessarily requiring a proportional increase in assets.
Financial Leverage - Debt can influence ROE and therefore SGR. Borrowing can help a company expand without issuing new equity, but higher debt also brings interest costs and repayment obligations. Investors should therefore consider the company's debt levels and ability to service its debt.
Business Growth Opportunities - A company operating in a growing industry may have more opportunities to reinvest its retained profits. The actual growth achieved, however, depends on whether these investments generate adequate returns.

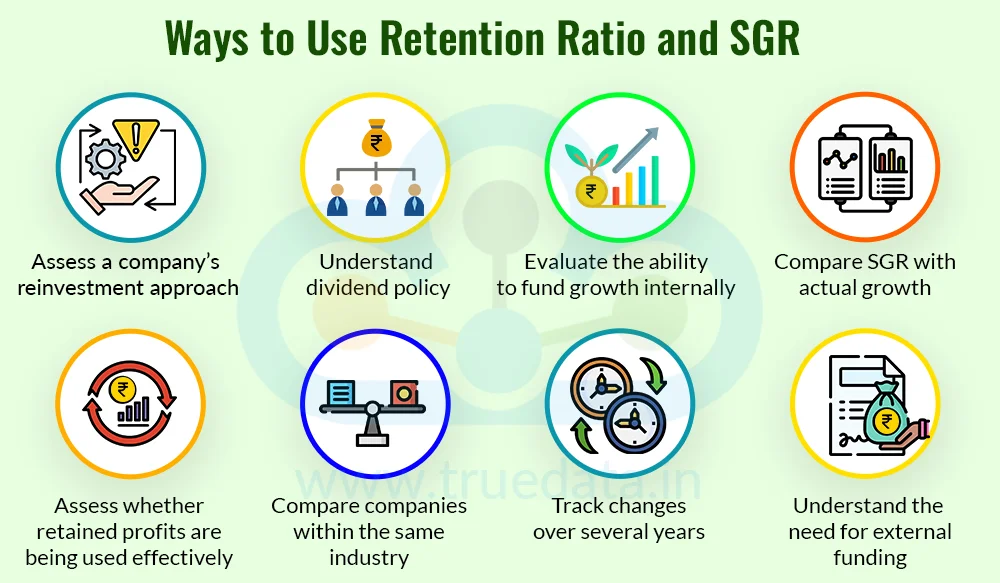
The Retention Ratio tells investors how much profit a company keeps, while the SGR indicates the growth it can potentially support with those retained profits. Using both together can help investors understand the relationship between a company's profits, dividends, reinvestment, and growth.
Assess a company’s reinvestment approach - The Retention Ratio shows how much of the company’s profit is being retained rather than distributed as dividends. A higher ratio may indicate that the company is focusing more on reinvesting its earnings in the business.
Understand dividend policy - Investors can use the Retention Ratio to understand how much profit a company distributes to shareholders. A lower Retention Ratio generally means a larger portion of profits is being paid as dividends, while a higher ratio means more profits are being retained.
Evaluate the ability to fund growth internally - SGR helps investors assess how quickly a company can theoretically grow using retained profits while maintaining its existing financial and dividend policies. A company with a higher SGR may have greater capacity to support growth without relying as heavily on external equity funding.
Compare SGR with actual growth - Investors can compare a company's historical revenue or earnings growth with its SGR. If actual growth is consistently much higher than its SGR, investors can examine whether the company is relying on additional debt, issuing new shares, or other external sources of funding to support that growth.
Assess whether retained profits are being used effectively - A high Retention Ratio by itself does not guarantee strong growth. Investors can look at ROE and SGR to understand whether the company is generating reasonable returns from the profits it retains.
Compare companies within the same industry - Retention Ratio and SGR can be compared across similar companies to understand differences in dividend policies, reinvestment, and potential internally funded growth. However, investors should account for differences in business models and capital requirements.
Track changes over several years - Looking at these measures over multiple financial years can reveal changes in a company's approach. For example, a rising Retention Ratio along with improving ROE may indicate that the company is retaining more profits while generating higher returns on shareholders' funds.
Understand the need for external funding - If a company's planned growth is significantly higher than its SGR, it may need additional funding through debt or fresh equity. Investors can therefore examine the company's borrowing levels, interest costs, cash flows, and share issuances alongside its SGR.
The Retention Ratio and Sustainable Growth Rate (SGR) help investors understand how a company manages its profits and supports future growth. While the Retention Ratio shows how much profit is retained in the business, the SGR indicates the growth the company can potentially support through these retained earnings. By analysing these measures along with profitability, cash flows, debt, and dividend policy, investors can get a clearer view of whether a company is using its profits effectively to support sustainable growth.
This article highlights two important financial ratios and their place in fundamental company analysis. Let us know your thoughts on this topic or if you need further information, and we will address it soon.
Till then, Happy Reading!
Thestock market never stands still, and prices swing constantly with every new h...
Corporate data is more than just the numbers of a company. They can show what is...
Investing is not just about numbers on a screen. It is about understanding the s...