Investing in mutual funds is not just about choosing funds that deliver high returns. It is equally important to understand how much risk a fund has taken to generate those returns. While many investors are familiar with the Sharpe Ratio for evaluating risk-adjusted performance, another equally useful metric that often goes unnoticed is the Treynor Ratio. So, what exactly is the Treynor Ratio, and how can it help you compare mutual funds more effectively? Dive into this blog where we explain what the Treynor Ratio is, how it is calculated, how to interpret it, and how to use it to make more informed investment decisions.

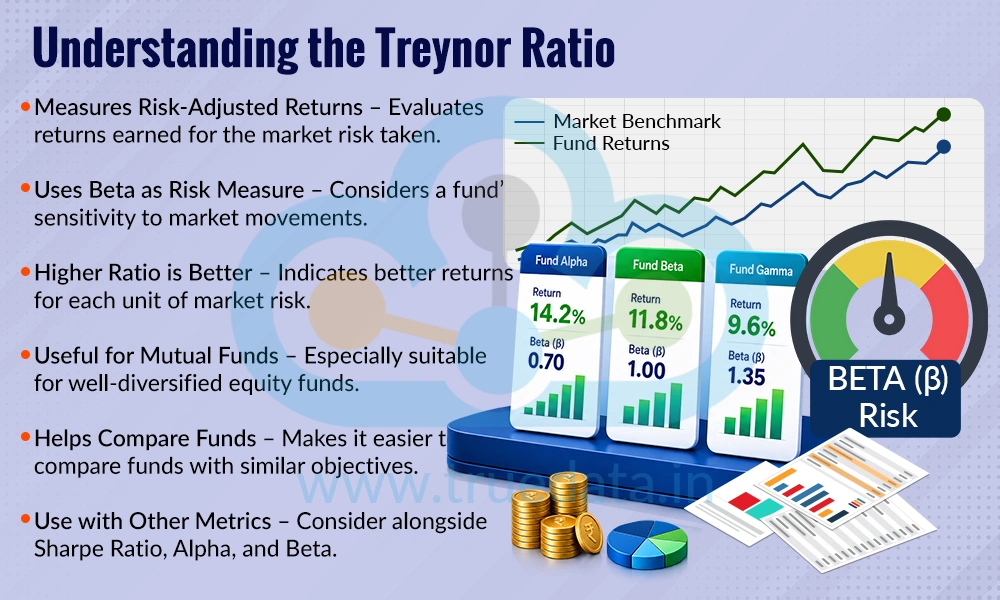
The Treynor Ratio is a financial metric used to evaluate how efficiently a mutual fund or investment has generated returns after considering the market risk it has taken. Instead of looking only at the returns earned by a fund, this ratio measures whether the returns are adequate for the level of market-related risk involved. It uses Beta, which indicates how sensitive a fund is to movements in the overall stock market, as the measure of risk. A higher Treynor Ratio suggests that a fund has delivered higher excess returns for every unit of market risk taken, making it more efficient from a risk-adjusted performance perspective.
Developed by American economist Jack L. Treynor, this ratio is particularly useful for evaluating well-diversified equity mutual funds, where market risk is the primary source of risk. The Treynor Ratio can serve as a valuable tool for investors to compare mutual funds with similar investment objectives, as it helps identify funds that have rewarded investors more effectively for the market risk they have assumed. However, it should not be used in isolation and is best considered alongside other performance measures, such as the Sharpe Ratio, Alpha, and Beta, to gain a more comprehensive view of a fund's overall performance.

The Treynor Ratio is an important tool as it goes beyond simply measuring returns and evaluates whether a mutual fund has generated those returns efficiently by taking an appropriate level of market risk. This helps investors make more informed decisions instead of selecting funds based solely on historical performance. Several mutual funds may invest in similar stocks or sectors, making it tricky to choose the right fund. The Treynor Ratio provides an additional layer of analysis by showing which fund has rewarded investors better for the market risk it has undertaken.
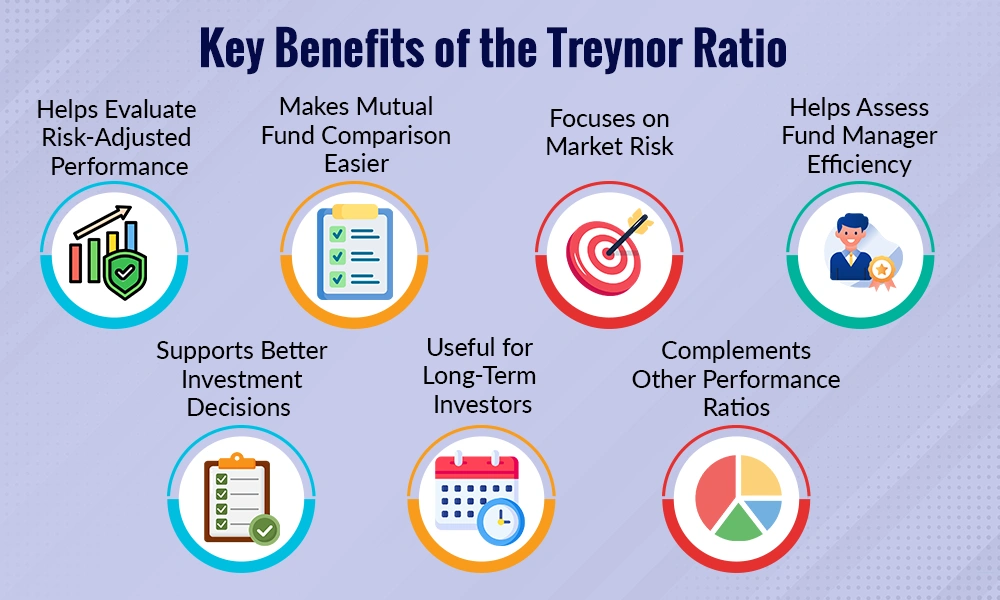
Helps Evaluate Risk-Adjusted Performance - A mutual fund delivering high returns may not always be the better investment if it has taken excessive market risk to achieve those returns. The Treynor Ratio adjusts a fund's performance for its market risk, allowing investors to judge whether the returns justify the level of risk involved. This leads to a more balanced evaluation of a fund's performance.
Makes Mutual Fund Comparison Easier - Many equity mutual funds invest in similar market segments, making it difficult to choose between them based on returns alone. The Treynor Ratio helps compare funds with similar investment objectives by highlighting which one has generated higher excess returns for each unit of market risk. This enables investors to identify funds that have managed risk more efficiently.
Focuses on Market Risk - Unlike some other performance measures that consider total risk, the Treynor Ratio focuses only on systematic risk, also known as market risk. This is the type of risk that cannot be eliminated through diversification and affects almost all investments during market movements. Since diversified mutual funds minimise company-specific risk, the Treynor Ratio provides a more relevant measure for evaluating such funds.
Helps Assess Fund Manager Efficiency - The Treynor Ratio also offers insights into how effectively a fund manager has managed market risk while generating returns. A consistently higher Treynor Ratio over time indicates that the fund manager has been able to produce better excess returns without taking unnecessary market risk. This can help investors identify fund managers with a disciplined and efficient investment approach.
Supports Better Investment Decisions - Looking only at returns can sometimes lead investors to choose funds that carry higher levels of risk than they realise. By incorporating the Treynor Ratio into the evaluation process, investors can compare both risk and return before making an investment decision. This leads to more informed fund selection and helps build a portfolio that aligns with an investor's risk tolerance and financial goals.
Useful for Long-Term Investors - Long-term investors often prefer funds that can consistently generate good returns while managing market risk effectively. The Treynor Ratio helps identify such funds by measuring the return earned for every unit of market risk over a period of time. This makes it particularly useful for investors building long-term wealth through equity mutual funds.
Complements Other Performance Ratios - The Treynor Ratio should not be used in isolation. Instead, it works best alongside other measures such as the Sharpe Ratio, Alpha, Beta, and Standard Deviation. Together, these metrics provide a more comprehensive picture of a mutual fund's risk, return, and overall performance, enabling investors to make well-informed investment decisions.

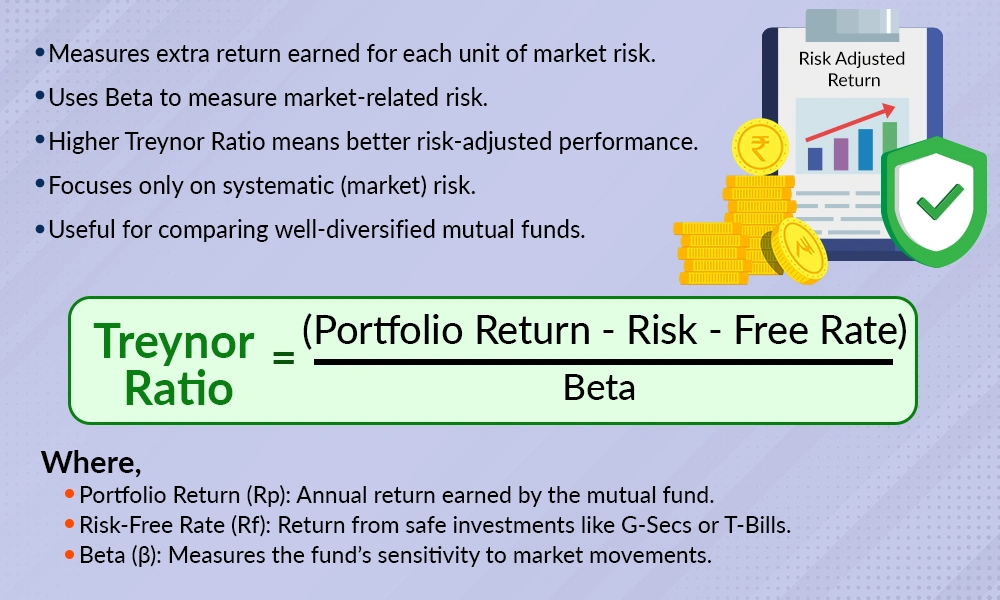
The Treynor Ratio measures the quantum of extra return a mutual fund or investment has generated for every unit of market risk it has taken. Rather than looking at a fund's overall returns, the Treynor Ratio evaluates whether the returns justify the level of risk arising from movements in the broader stock market. This involves starting with the calculation of the fund's excess return. This is the return earned in excess of or above the risk-free rate (typically represented by the yield on Government securities). This excess return is then divided by the fund's Beta, a measure of how sensitive the fund is to market fluctuations. By doing so, the Treynor Ratio shows how efficiently the fund manager has converted market risk into returns.
A higher Treynor Ratio indicates that a fund has generated greater returns for each unit of market risk taken, making it more efficient from a risk-adjusted perspective. On the other hand, a lower ratio suggests that the fund has not adequately compensated investors for the level of market risk it has assumed. The Treynor Ratio considers only systematic risk (market risk) and ignores company-specific or unsystematic risk. Therefore, it is most useful for analysing well-diversified equity mutual funds, where unsystematic risk has largely been diversified away. The Treynor Ratio can be a valuable metric for comparing mutual funds with similar investment objectives and identifying funds that have delivered superior risk-adjusted performance, rather than simply focusing on the highest returns.
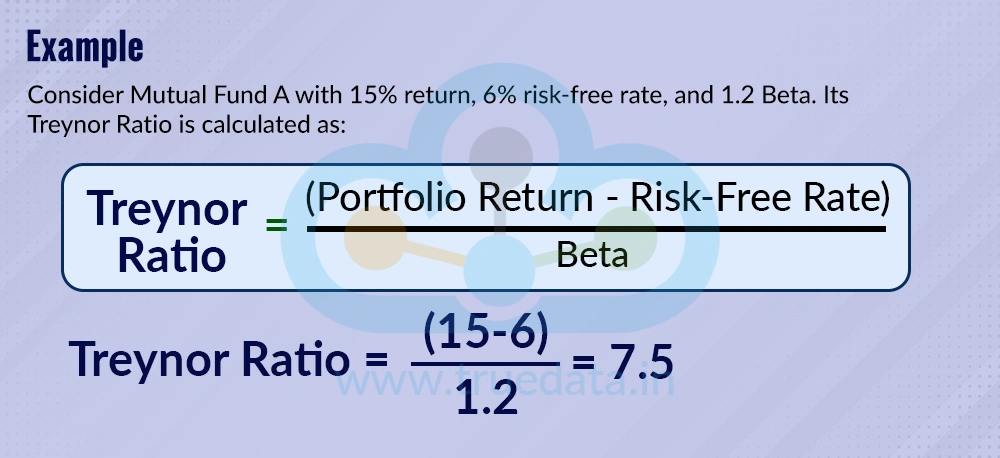
The formula to calculate the Treynor Ratio is,
Treynor Ratio = (Portfolio Return - Risk-Free Rate) / Beta
Where,
Portfolio Return (Rp) - The annual return generated by the mutual fund.
Risk-Free Rate (Rf) - The return on a virtually risk-free investment, such as Government securities (G-Secs) or Treasury Bills.
Beta (β) - A measure of how sensitive the mutual fund is to movements in the overall market. A Beta of 1 means the fund moves in line with the market, while a Beta greater than 1 indicates higher market volatility.
Understanding the Calculation of Treynor Ratio Using an Example

Consider Mutual Fund A with an annual return of 15%, a risk-free return of 6% and a Beta of 1.2. The Treynor Ratio for this fund is calculated as follows.
Treynor Ratio = (Portfolio Return - Risk-Free Rate) / Beta
Treynor Ratio = (15-6) / 1.2 = 7.5
Interpretation -
A Treynor Ratio of 7.5 means that Mutual Fund A has generated 7.5% of excess return for every unit of market risk (Beta = 1) it has taken. If another mutual fund with a similar investment objective has a Treynor Ratio of 6.0, Fund A is considered to have delivered better risk-adjusted performance, as it has generated higher excess returns for the market risk assumed.
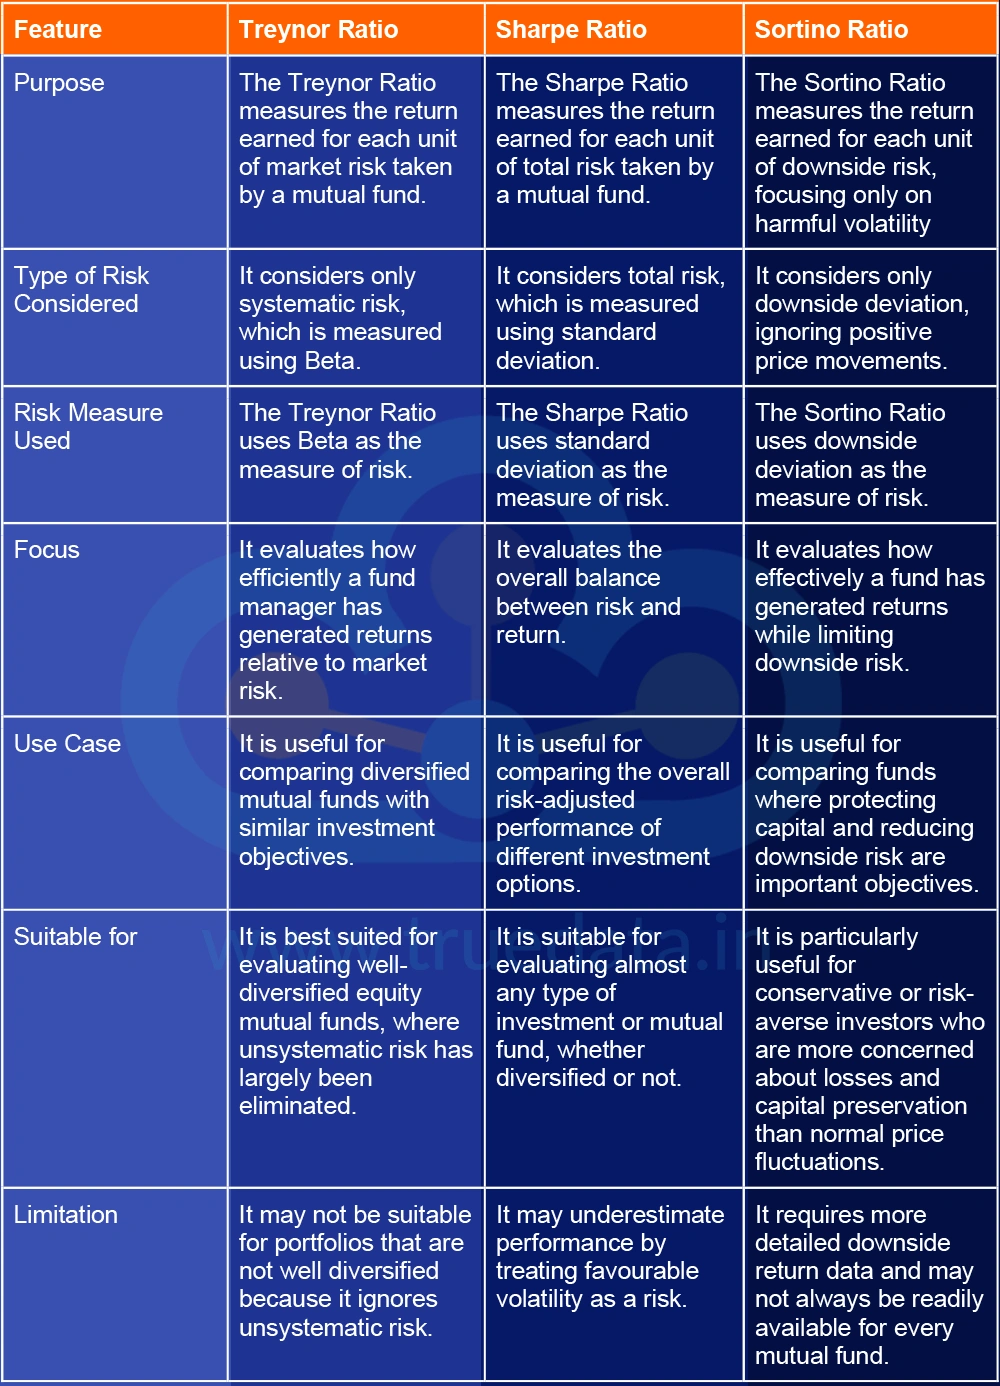
Although the Treynor Ratio, Sharpe Ratio, and Sortino Ratio are all used to evaluate the risk-adjusted performance of mutual funds, they differ in the type of risk they measure and the situations in which they are most useful. Understanding these differences helps investors choose the right metric when comparing mutual funds and assessing their performance.


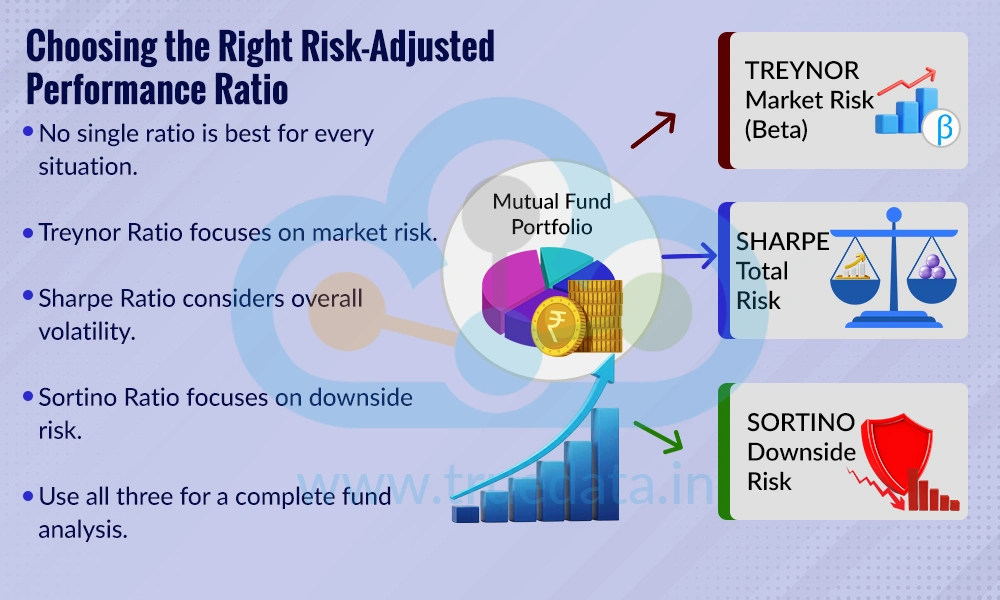
There is no single ratio that is best in every situation. Each metric serves a different purpose. The Treynor Ratio is most useful when comparing well-diversified equity mutual funds because it focuses on market risk. The Sharpe Ratio is ideal when investors want to evaluate the overall risk-adjusted performance of a fund by considering total volatility. The Sortino Ratio is more suitable for investors who are particularly concerned about downside risk and want to assess how well a fund protects against losses. Therefore, investors should use these ratios together, rather than relying on only one, to gain a more complete understanding of a mutual-fund’s performance and risk profile.

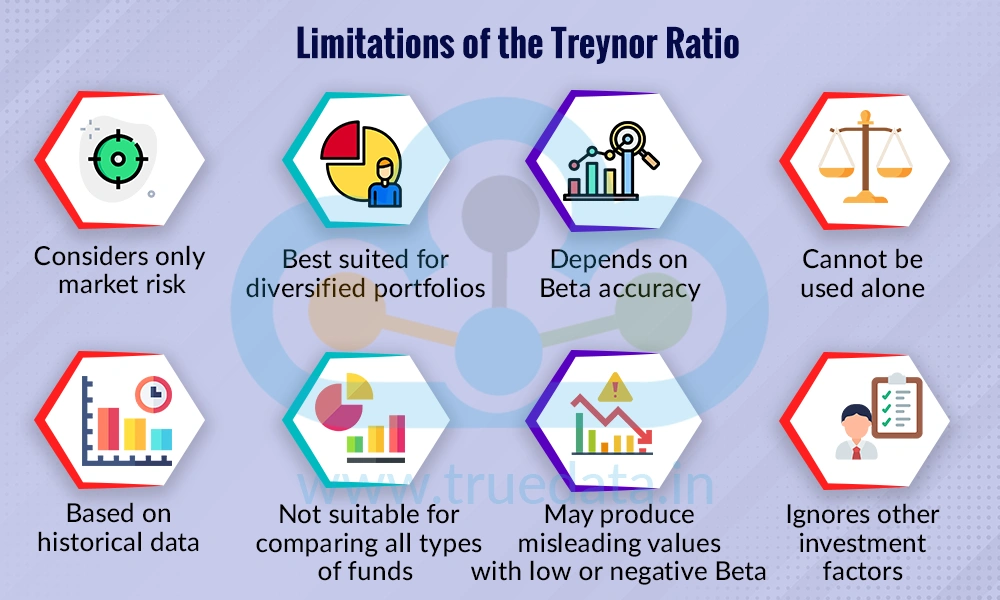
The limitations of the Treynor Ratio include,
Considers only market risk - The Treynor Ratio measures only systematic risk (Beta) and ignores company-specific or unsystematic risk.
Best suited for diversified portfolios - It works well only for well-diversified mutual funds. It may not provide meaningful results for concentrated portfolios or individual stocks.
Depends on Beta accuracy - The ratio is only as reliable as the Beta used in the calculation. If Beta changes over time or is estimated inaccurately, the Treynor Ratio may be misleading.
Cannot be used alone - The Treynor Ratio does not provide a complete picture of a fund's performance. It should be used along with other metrics such as the Sharpe Ratio, Sortino Ratio, Alpha, and Standard Deviation.
Based on historical data - The ratio uses past returns and historical Beta, which may not accurately predict a fund's future performance.
Not suitable for comparing all types of funds - Comparing funds with different investment objectives or asset classes using the Treynor Ratio may not produce meaningful results.
May produce misleading values with low or negative Beta - If a fund has a very low or negative Beta, the Treynor Ratio can become difficult to interpret and may not reflect the fund's true performance.
Ignores other investment factors - The ratio does not consider factors such as fund manager experience, portfolio quality, investment strategy, expense ratio, or market conditions, all of which can influence a fund's performance.
The Treynor Ratio is a useful tool for evaluating how efficiently a mutual fund has generated returns for the level of market risk it has taken. It helps investors look beyond returns and make more informed comparisons between well-diversified equity mutual funds. However, since it considers only market risk, it should not be used on its own. Using the Treynor Ratio alongside other measures such as the Sharpe Ratio, Sortino Ratio, Alpha, and Beta can provide a more complete understanding of a mutual fund's performance and support better investment decisions.
This article explains the Treynor Ratio in detail, which is a key ratio in the mutual fund factsheet. Let us know your thoughts on the topic or if you need further information and we will address it soon.
Till then, Happy Reading!
Read More: How to Read a Mutual Fund Factsheet?
Mutual fund investments have simplified greatly with just a tap on your smartpho...
Many investors think thatmutual fund investing is simply selecting a fund and wa...
Ever wondered why one investor talks aboutEPS, another prefers BVPS, while someo...