Valuation ratios play an important role in helping investors assess whether a stock may be fairly valued, expensive, or attractively priced. While the Price-to-Earnings (P/E) Ratio is one of the most widely used valuation measures, it is not the only one investors should consider. The Price-to-Sales (P/S) ratio offers another useful perspective by comparing a company’s market value with the sales it generates. So, what does the P/S ratio mean, and how can investors use it in fundamental analysis? Read on to understand the P/S ratio, how it works, and why it can be a useful addition to an investor’s valuation toolkit.

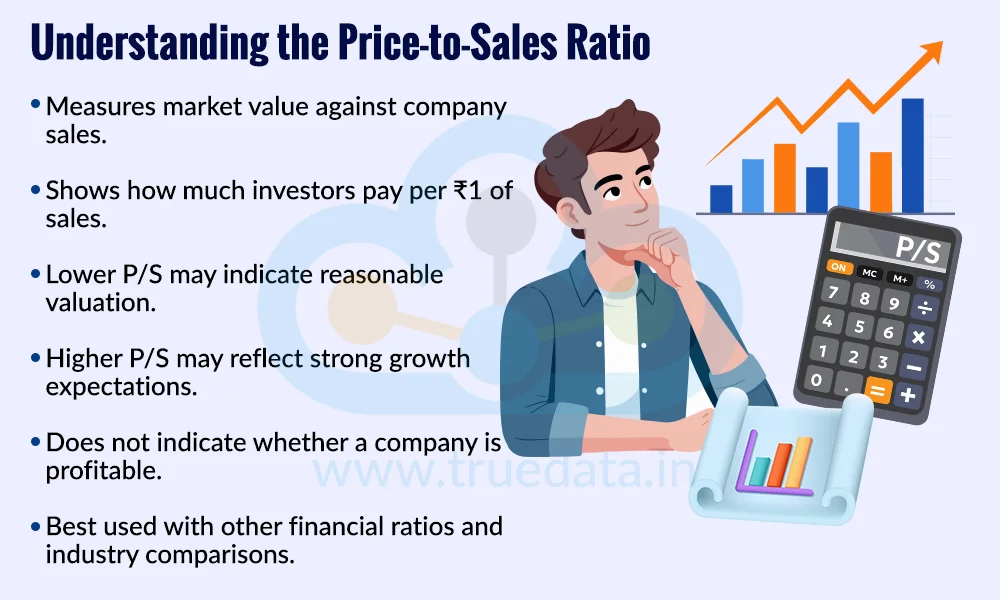
The Price-to-Sales (P/S) ratio is a valuation ratio that helps investors understand how much the market is willing to pay for every rupee of a company’s sales. For example, if a company has a P/S ratio of 3, it means investors are valuing the company at Rs. 3 for every Re. 1 of sales it generates. A lower P/S ratio may indicate that a stock is valued more reasonably compared with its sales, while a higher ratio may suggest that investors have high expectations for the company’s future growth. However, the P/S ratio should not be viewed in isolation, as sales do not tell us whether a company is actually making profits. Investors can use it alongside ratios such as P/E, profit margins, debt levels, and return ratios, and compare it with similar companies in the same industry to get a more meaningful picture of valuation.

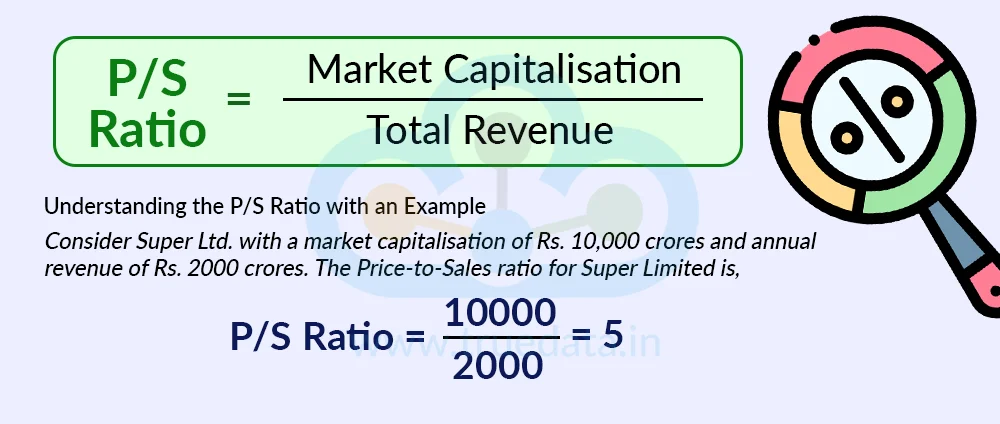
The Price-to-Sales (P/S) ratio is calculated by comparing a company’s market capitalisation with its total sales or revenue. It tells investors how much they are paying for every Re. 1 of revenue generated by the company.
The formula for calculating the P/S Ratio is,
P/S Ratio = Market Capitalisation / Total Revenue
Alternatively, we can also calculate the per-share value for the P/S Ratio.
P/S Ratio = Market Price Per Share / Sales Per Share
Understanding the P/S Ratio with an Example
Consider Super Ltd. with a market capitalisation of Rs. 10,000 crores and annual revenue of Rs. 2000 crores. The Price-to-Sales ratio for Super Limited is,
P/S Ratio = Market Capitalisation / Total Revenue
P/S Ratio = 10000 / 2000 = 5
Thus, the market is valuing the company at Rs. 5 for every Re. 1 of sales it generates. Investors can then compare this ratio with those of similar companies in the same industry to understand how the stock is valued relative to its peers. However, a lower P/S ratio does not automatically mean that a stock is cheaper or a better investment, as investors should also consider factors such as profit margins, earnings growth, debt and overall business prospects.

The Price-to-Sales (P/S) ratio helps investors understand how the market values a company in relation to the sales it generates. However, there is no fixed P/S ratio that can be considered good or bad for every company. The ratio should ideally be compared with similar companies in the same industry, as different sectors can have very different normal valuation levels.
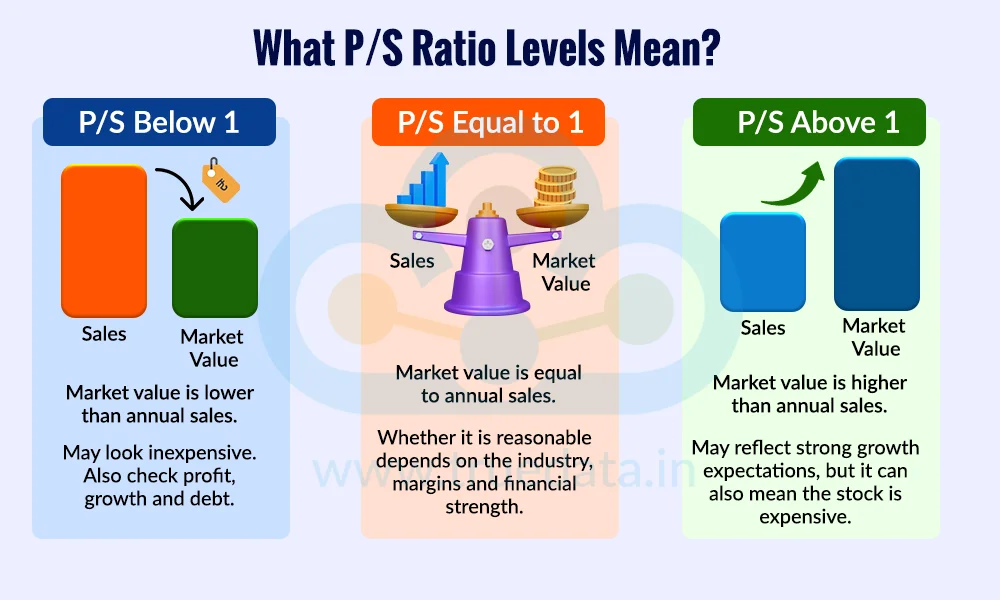
P/S Ratio Below 1 - A P/S ratio below 1 means the company’s market value is lower than its annual sales. For example, a P/S ratio of 0.8 means investors are paying Rs. 0.80 for every Rs. 1 of sales generated by the company. This may indicate that the stock is relatively inexpensive based on sales, but investors should also check profitability, growth and debt before drawing a conclusion.
P/S Ratio Equal to 1 - A P/S ratio of 1 means the company’s market value is equal to its annual sales. In simple terms, investors are paying Rs. 1 for every Rs. 1 of sales generated by the company. Whether this is a reasonable valuation depends on the company’s industry, growth prospects, profit margins and financial strength.
P/S Ratio Above 1 - A P/S ratio above 1 means the company’s market value is higher than its annual sales. For instance, a P/S ratio of 3 means investors are paying Rs. 3 for every Rs. 1 of sales. A higher ratio may reflect strong growth expectations or a strong business outlook, but it could also mean the stock is expensive relative to its sales.
The price-to-sales ratio is a financial ratio that can be used to understand the market perception of the company valuation. The importance of the Price-to-Sales Ratio is explained below.

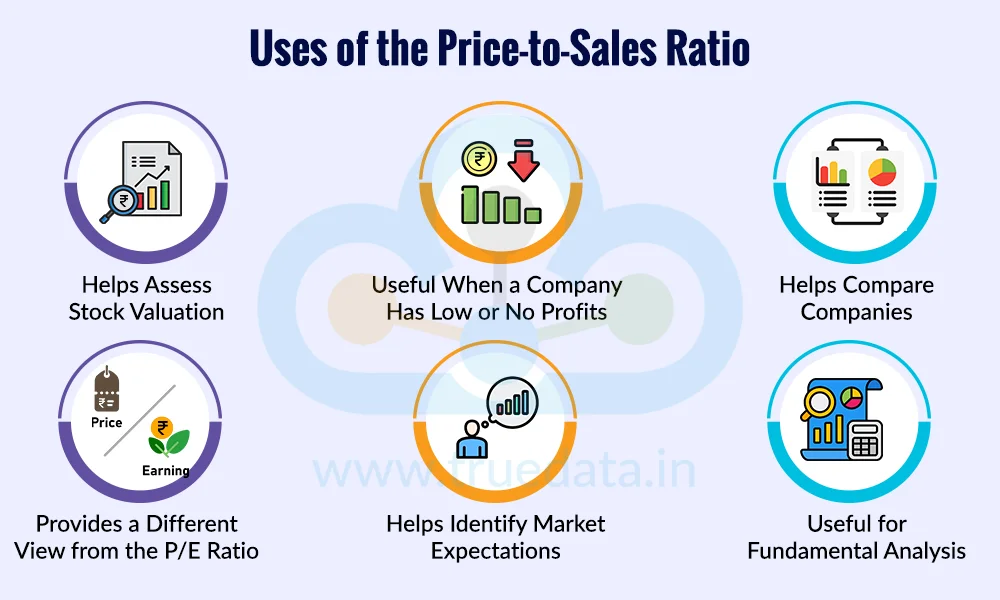
Helps Assess Stock Valuation - The Price-to-Sales (P/S) ratio helps investors understand how much the market is paying for a company compared with the sales it generates. By looking at the P/S ratio, investors can get an initial idea of whether a stock is valued relatively higher or lower compared with its sales. This can be particularly useful when comparing companies operating in the same industry.
Useful When a Company Has Low or No Profits - One major advantage of the P/S ratio is that it can still be used when a company has very low profits or is making losses. Ratios such as the P/E ratio may not provide much insight when earnings are negative, but the company may still have meaningful sales. The P/S ratio allows investors to assess how the market values those sales while they examine whether the business has the potential to become profitable.
Helps Compare Companies - The P/S ratio can make it easier to compare the valuations of companies within the same sector. For example, if two companies have similar business models and growth prospects but one trades at a significantly higher P/S ratio, investors can investigate why the market is assigning it a higher valuation. Differences in growth, profitability, brand strength or future prospects may explain the gap.
Provides a Different View from the P/E Ratio - The P/E ratio focuses on profits, whereas the P/S ratio focuses on sales. Looking at both can give investors a broader understanding of a company’s valuation. For example, a company may have strong sales growth but low profits due to high costs. In such a case, the P/S ratio can provide an additional perspective that the P/E ratio alone may not capture.
Helps Identify Market Expectations - A high P/S ratio often indicates that investors have strong expectations for the company’s future growth or profitability. On the other hand, a low P/S ratio may indicate more modest expectations or concerns about the business. Therefore, investors can use changes in the P/S ratio along with revenue growth and other financial indicators to understand how market expectations are evolving.
Useful for Fundamental Analysis - The P/S ratio is not a standalone measure for deciding whether to buy or sell a stock. Instead, it works best as one part of a broader fundamental analysis. Investors should consider the company’s revenue growth, profit margins, earnings, debt, cash flows and industry outlook, and compare the P/S ratio with peers and the company’s historical levels before reaching a conclusion.

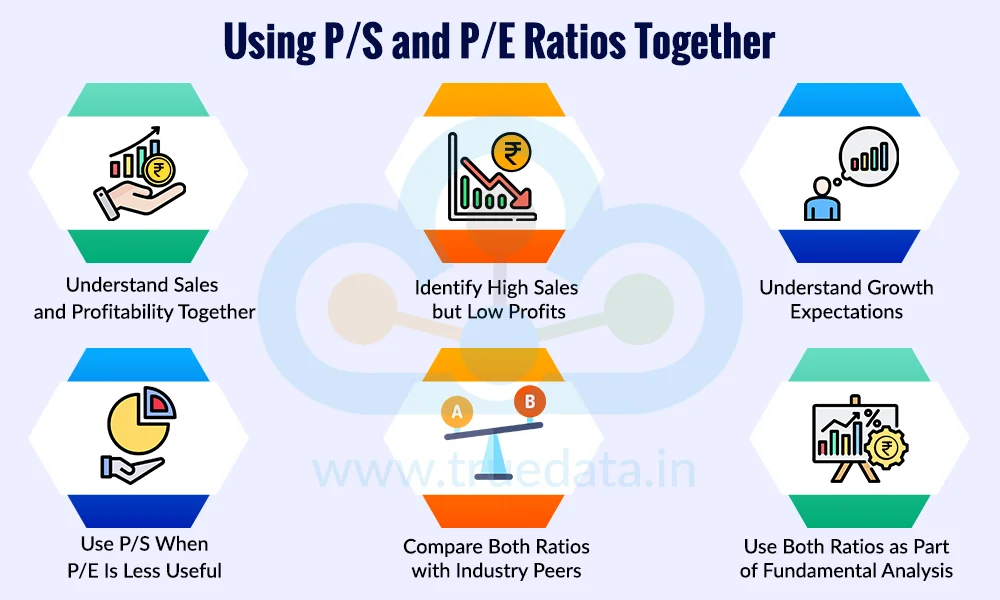
The Price-to-Sales (P/S) ratio and Price-to-Earnings (P/E) ratio look at a company’s valuation from two different angles. The P/S ratio compares the company’s market value with its sales, while the P/E ratio compares its market price with its earnings or profits. Using both ratios together can help investors get a broader view of how the market is valuing a company.
Understand Sales and Profitability Together - The P/S ratio tells you how much investors are paying for every Rs. 1 of sales, but it does not show whether those sales are turning into profits. The P/E ratio fills this gap by showing how much investors are paying for every Rs. 1 of earnings. Looking at both can help investors understand whether a company has not only strong sales but also the ability to generate healthy profits from those sales.
Identify High Sales but Low Profits - Suppose a company has a low P/S ratio but a high P/E ratio. This could mean that the company generates substantial sales but has relatively low profits due to high operating costs, interest expenses or other factors. In such a situation, investors should investigate whether profit margins can improve before considering the stock attractive based only on its low P/S ratio.
Understand Growth Expectations - A high P/S ratio and high P/E ratio may indicate that investors have strong expectations for the company’s future growth and profitability. The market may be willing to pay a premium because it expects sales and earnings to increase significantly. However, investors should check whether the company’s actual growth prospects justify these higher valuations.
Use P/S When P/E Is Less Useful - The P/E ratio may not be meaningful when a company has very low or negative earnings. In such cases, the P/S ratio can provide an additional way to assess valuation, as sales can still be positive even when profits are negative. As the company becomes profitable, investors can then use the P/E ratio alongside the P/S ratio for a more complete assessment.
Compare Both Ratios with Industry Peers - Investors should avoid deciding whether a P/S or P/E ratio is attractive by looking at the number alone. Instead, compare both ratios with similar companies in the same industry and, where possible, with the company’s own historical valuation. This can help identify whether a company is trading at a premium or discount relative to its peers.
Use Both Ratios as Part of Fundamental Analysis - The P/S and P/E ratios are useful starting points, but they should not be used in isolation. Investors should also examine revenue and earnings growth, profit margins, debt, cash flows, return ratios and the overall industry outlook. Using these measures together can provide a more balanced view of a company’s valuation and financial strength.
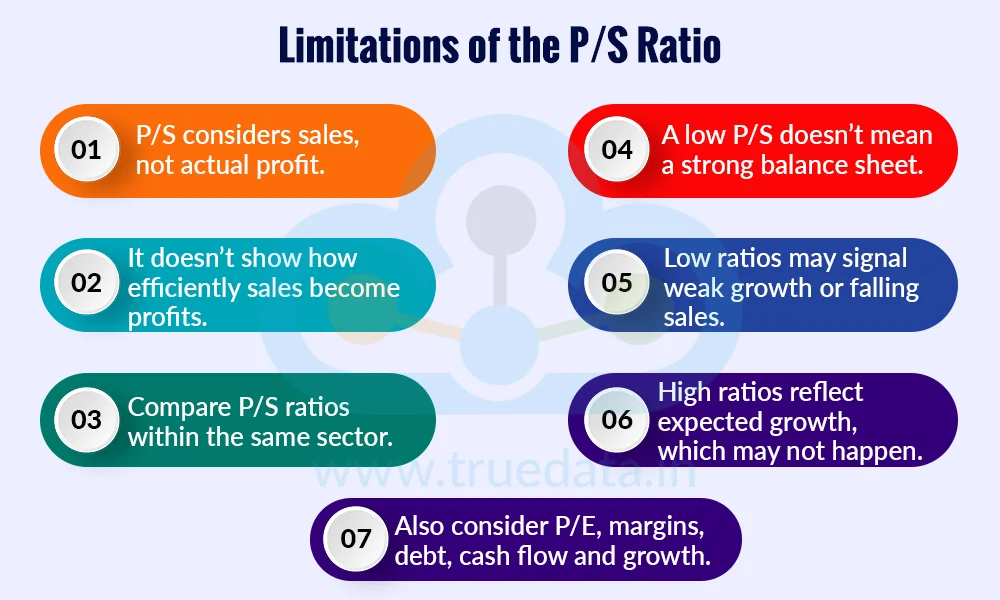
The limitations of the Price-to-Sales ratio are highlighted below.

It only considers sales, not the company’s actual profit.
It cannot tell how efficiently a company converts sales into profits.
P/S ratios can vary widely across sectors, so compare companies within the same industry.
A low P/S ratio does not necessarily mean the company has a strong balance sheet.
A low ratio may reflect weak growth, falling sales or business problems.
A high ratio may mean investors are expecting strong future growth, which may not always happen.
Investors should consider P/E, profit margins, debt, cash flows and growth along with the P/S ratio.

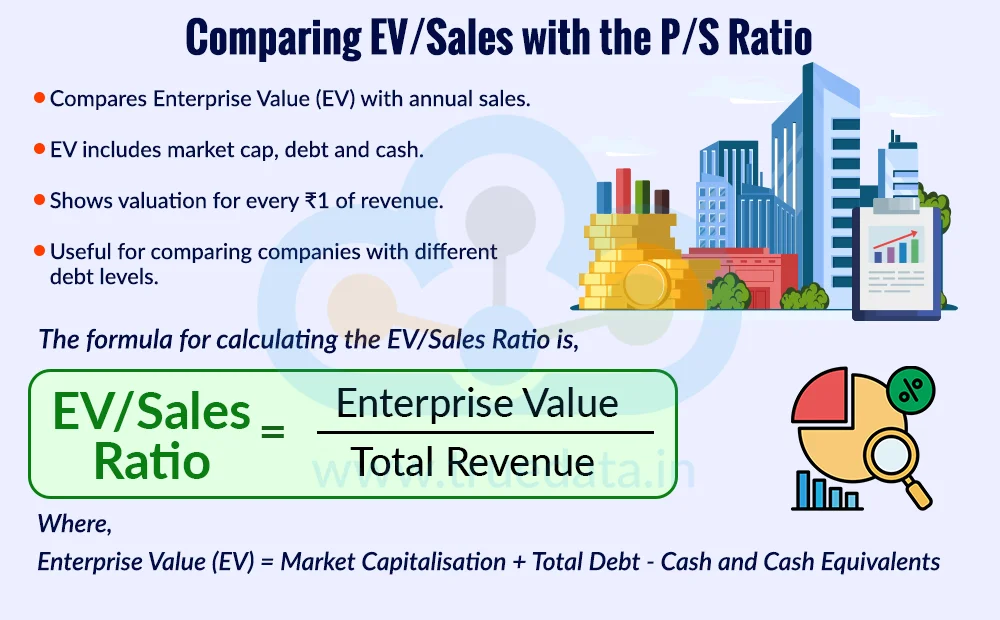
The Enterprise Value-to-Sales (EV/Sales) ratio is a valuation measure that compares a company’s enterprise value (EV) with its annual sales or revenue. Enterprise value represents the value of the entire business, taking into account not only its market capitalisation but also its debt and cash. This makes EV/Sales useful for understanding how much investors are effectively valuing a company for every Rs. 1 of revenue it generates. It is particularly useful when comparing companies with different levels of debt and cash.
The formula for calculating the EV/Sales Ratio is,
EV/Sales Ratio = Enterprise Value / Total Revenue
Where,
Enterprise Value (EV) = Market Capitalisation + Total Debt - Cash and Cash Equivalents
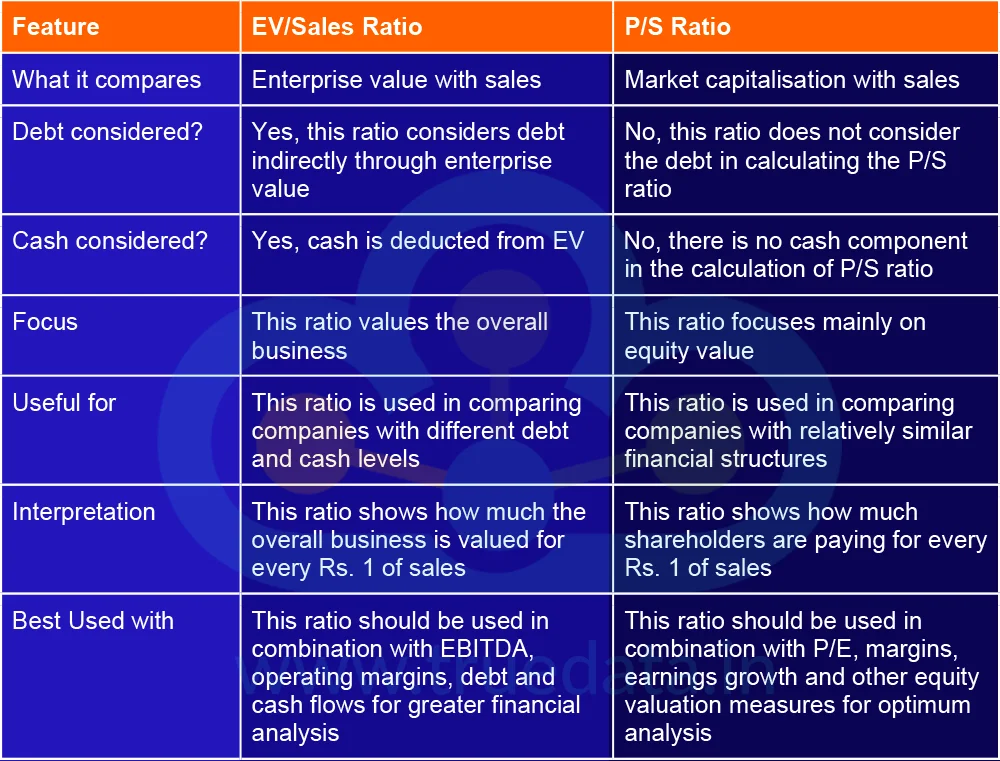
Difference between EV/Sales Ratio and P/S ratio

The Price-to-Sales (P/S) ratio is a useful valuation tool that helps investors understand how much the market is paying for a company’s sales. However, a low or high P/S ratio alone does not tell the complete story. Investors should compare the ratio with industry peers and the company’s historical levels, while also looking at revenue growth, profit margins, debt, cash flows and future business prospects. Used along with other fundamental analysis tools, the P/S ratio can help investors make more informed valuation decisions.
This article explains a crucial financial ratio and its use in fundamental analysis. Let us know your thoughts on the topic or if you need further information on the same, and we will address it soon.
Till then, Happy Reading!
Read More: BVPS vs EPS vs Price-to-Book Ratio - Key Differences Explained
Ever wondered why one investor talks aboutEPS, another prefers BVPS, while someo...
Investing in mutual funds is not just about choosing funds that deliver high ret...
Thestock market never stands still, and prices swing constantly with every new h...