Corporate Data

Enterprise Value Ratios

Marisha Bhatt · 11 Jul 2026 · 12 mins read · 0 Comments

Enterprise Value Ratios

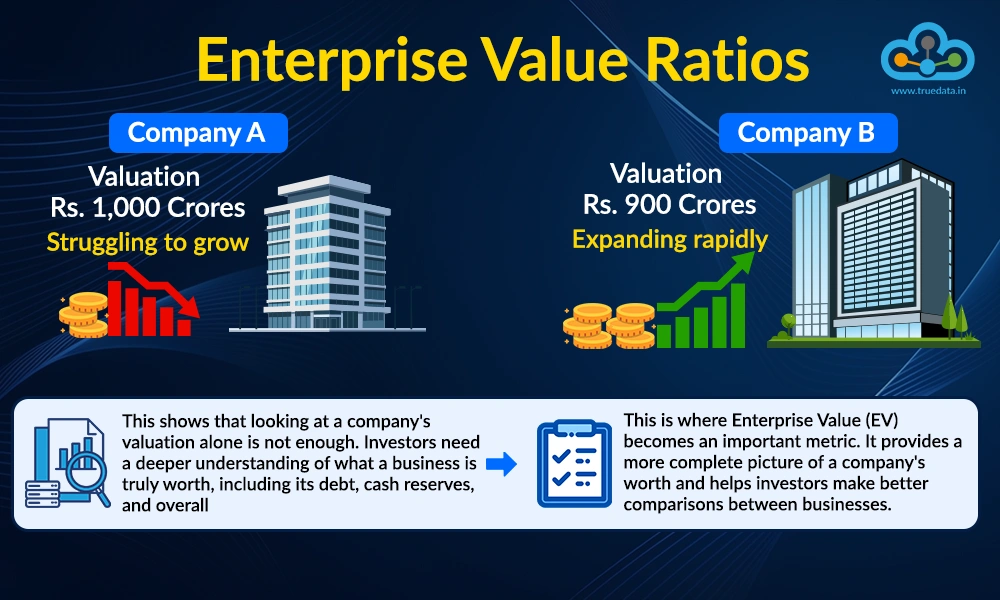
Imagine you have to choose between two companies. One is valued at Rs. 1,000 crores and the other at Rs. 900 crores. At first glance, the larger company may seem like the better investment. But what if the higher-valued company is struggling to grow while the other is expanding rapidly? Suddenly, the smaller company starts looking more attractive. This shows that looking at a company's valuation alone is not enough. Investors need a deeper understanding of what a business is truly worth, including its debt, cash reserves, and overall financial position. This is where Enterprise Value (EV) becomes an important financial metric. It provides a more complete picture of a company's worth and helps investors make better comparisons between businesses. Curious to know the meaning of enterprise value and its importance in fundamental analysis? Check out this blog, where we explore enterprise value and its key ratios in detail and their relevance for investors. 

What is Enterprise Value?

What is Enterprise Value

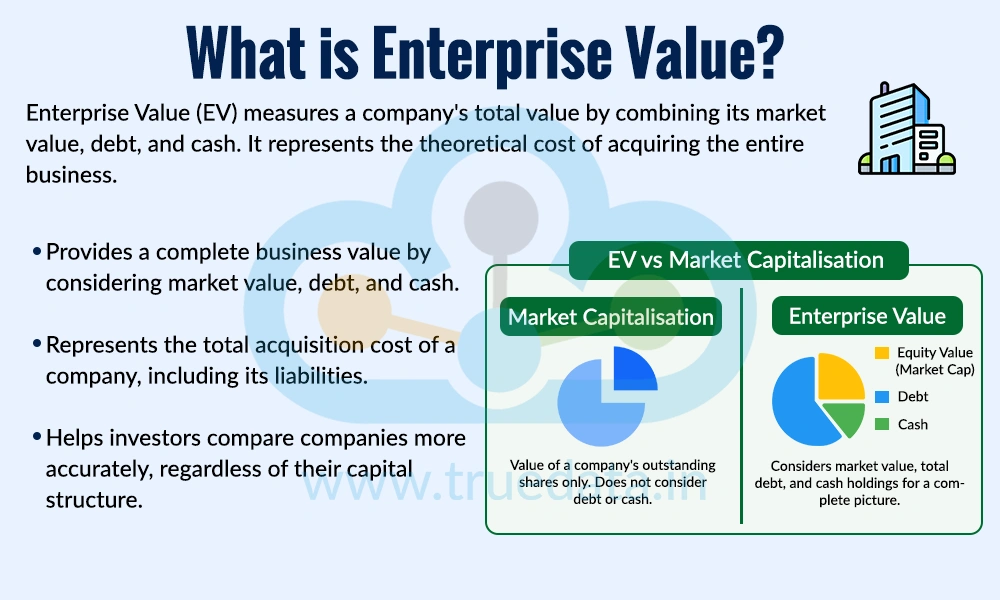
Enterprise Value (EV) is a measure used to estimate the total value of a business. Unlike market capitalisation, which only considers the value of a company's outstanding shares, Enterprise Value provides a more complete picture by taking into account the company's debt and cash holdings as well. It represents the amount an investor would theoretically need to pay to acquire the entire business, including its liabilities. EV is calculated by adding a company's market capitalisation and total debt, and then subtracting its cash and cash equivalents. Since it considers both ownership value and financial obligations, Enterprise Value is widely used by investors and analysts to compare companies more accurately, especially those with different levels of debt and cash on their balance sheets.

How to Calculate Enterprise Value?

Enterprise Value (EV) measures the total value of a company by considering not only its market value but also its debt and cash position. It gives investors a clearer picture of what it would cost to acquire the entire business. The formula to calculate the enterprise value is explained below.

Standard Formula 

Standard Formula 

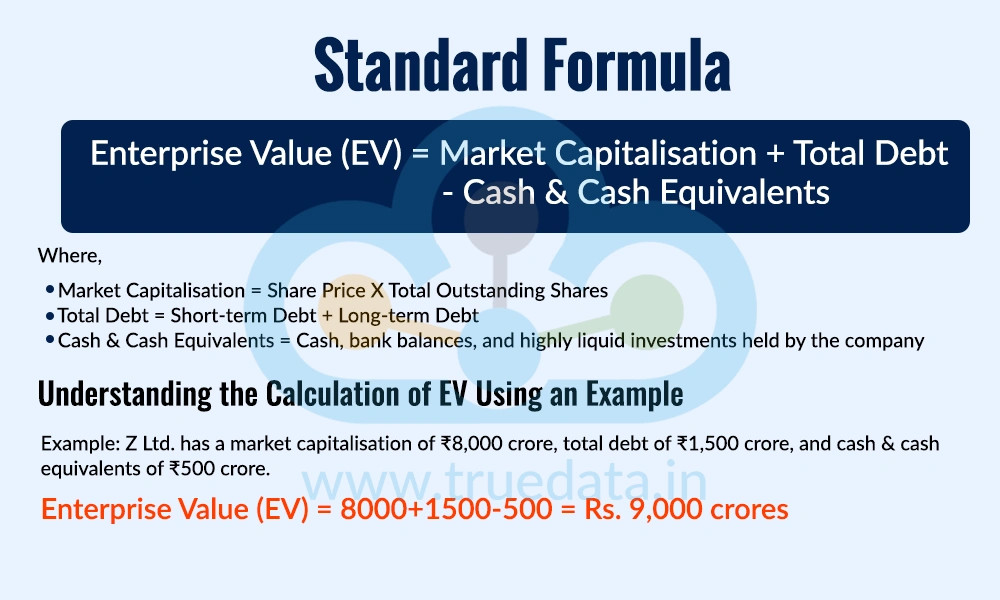
Enterprise Value (EV) = Market Capitalisation + Total Debt - Cash & Cash Equivalents

where,

  • Market Capitalisation = Share Price * Total Outstanding Shares

  • Total Debt = Short-term Debt + Long-term Debt

  • Cash & Cash Equivalents = Cash, bank balances, and highly liquid investments held by the company

Understanding the Calculation of EV Using an Example

Consider Z Ltd. with a market capitalisation of Rs. 8,000 crores and total debt of Rs. 1,500 crores. The cash and cash equivalents of Z Ltd stand at 500 crores. The enterprise value of Z Ltd. is calculated as follows,

Enterprise Value (EV) = Market Capitalisation + Total Debt - Cash & Cash Equivalents

Enterprise Value (EV) = 8000+1500-500 = Rs. 9,000 crores

Debt is added as the acquirer would need to take over or repay the company's outstanding debt, while cash is subtracted as the acquirer gains access to the company's cash reserves, reducing the effective acquisition cost. Thus, although investors value the company's shares at Rs. 8,000 crore, the actual value of the business is Rs. 9,000 crore after considering its debt and cash position. Hence, enterprise value is a better metric of valuation over market capitalisation when comparing companies. 

Alternate Formula

Alternate Formula

A company which has preference shares and minority interest can use an extended version of the standard formula mentioned above for calculating the enterprise value. 

The alternate formula for calculating EV is,

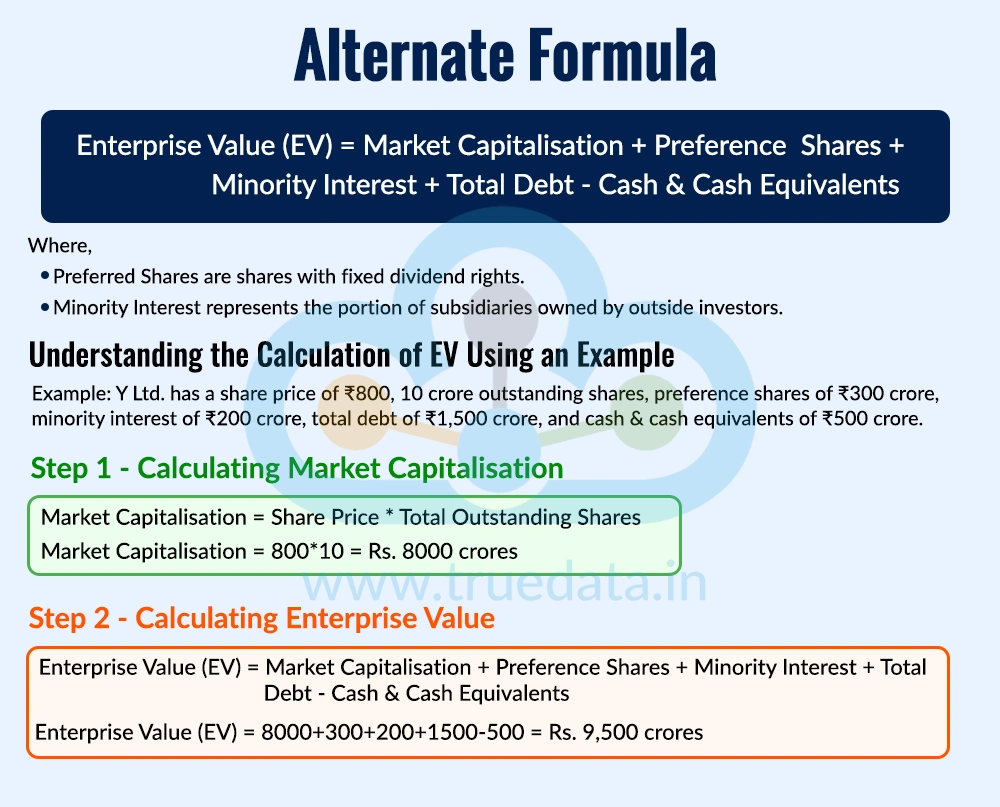
Enterprise Value (EV) = Market Capitalisation + Preference Shares + Minority Interest + Total Debt - Cash & Cash Equivalents

Where,

  • Preferred Shares are shares with fixed dividend rights.

  • Minority Interest represents the portion of subsidiaries owned by outside investors.

Understanding the Calculation of EV Using an Example

Consider Y Ltd. with the market price of Rs. 800 per share and 10 crore outstanding shares, preference shares of Rs. 300 crore, minority interest of 200 crore, total debt of Rs. 1500 crores and cash and cash equivalents of Rs. 500 crores. The EV of Y Ltd. is calculated below.

Step 1 - Calculating Market Capitalisation

Market Capitalisation = Share Price * Total Outstanding Shares

Market Capitalisation = 800*10 = Rs. 8000 crores


Step 2 - Calculating Enterprise Value

Enterprise Value (EV) = Market Capitalisation + Preference Shares + Minority Interest + Total Debt - Cash & Cash Equivalents

Enterprise Value (EV) = 8000+300+200+1500-500 = Rs. 9,500 crores

In this case, the Enterprise Value is Rs. 9,500 crore because an acquirer would also need to account for the preferred shareholders' claims and the minority shareholders' stake in subsidiaries, while benefiting from the company's cash holdings.

Why is Enterprise Value Important?

Why is Enterprise Value Important

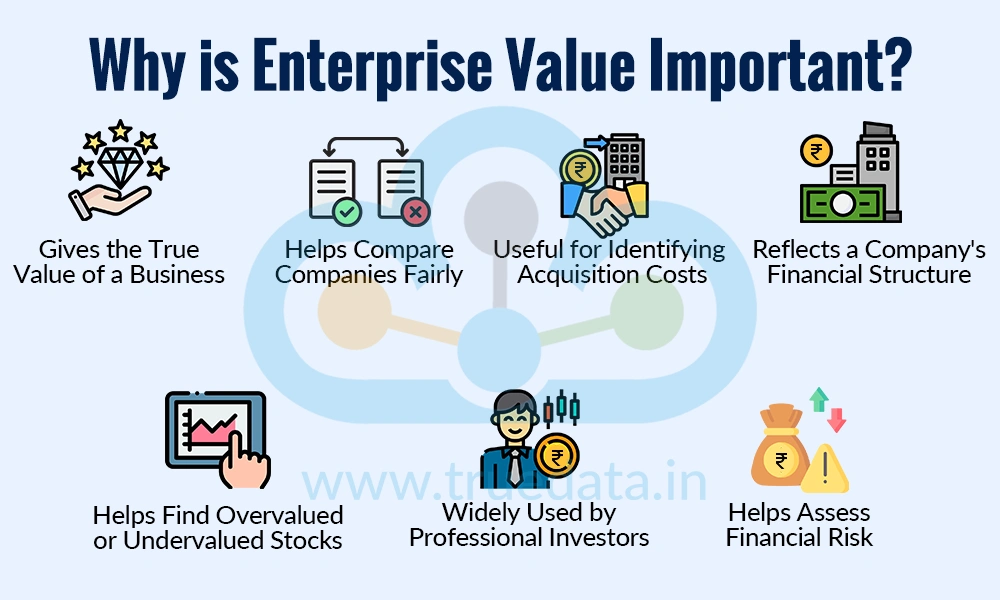
Enterprise Value (EV) is an important metric of fundamental analysis and can help investors in making informed portfolio decisions. The importance of EV for investors and companies is explained below. 

  • Gives the True Value of a Business - Enterprise Value considers a company's debt and cash, along with its market value. This provides a more complete picture of what the business is actually worth.

  • Helps Compare Companies Fairly - Two companies may have similar market capitalisations but very different debt levels. Enterprise Value helps investors make fair comparisons by accounting for these differences.

  • Useful for Identifying Acquisition Costs - When a company seeks to acquire another, it must also take over the target company's debt and gain access to its cash. Enterprise Value helps in estimating the actual cost of the acquisition, as it accounts for debt and other obligations like preference shares and minority interests.  

  • Reflects a Company's Financial Structure - Companies finance their operations through a mix of equity and debt. Enterprise Value shows how much of the business value comes from borrowing and how much comes from shareholders.

  • Helps Find Overvalued or Undervalued Stocks - Investors often use Enterprise Value-based ratios, such as EV/EBITDA, to assess whether a company's valuation is reasonable compared to its earnings and industry peers.

  • Widely Used by Professional Investors - Analysts, fund managers, and investment bankers frequently use Enterprise Value when evaluating companies because it offers a more comprehensive measure of business value than market capitalisation alone.

  • Helps Assess Financial Risk - A company with high debt may appear attractive based on its market value, but Enterprise Value reveals the impact of that debt, helping investors better understand the company's financial risk.

What are the Common Enterprise Value Ratios?

Enterprise Value (EV) ratios help investors understand how much they are paying for a company's earnings, sales, or cash flow. These ratios are often preferred over market-cap-based ratios because they consider a company's debt and cash position, giving a more complete picture of its valuation. The common EV ratios and their interpretation are explained hereunder. 

EV / EBITDA

EV / EBITDA

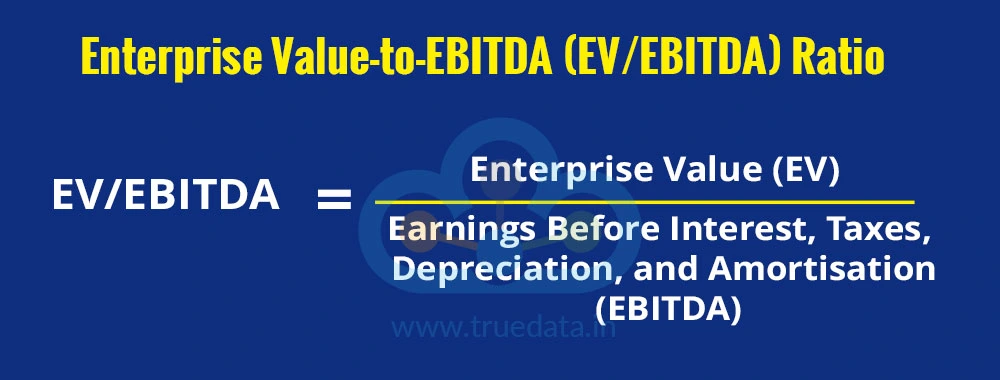
Enterprise Value-to-EBITDA Ratio (EV/EBITDA) compares a company's total value with its operating earnings before interest, taxes, depreciation, and amortisation. It shows how much investors are willing to pay for each rupee of a company's operating earnings. Since EBITDA focuses on operating performance and excludes financing and accounting decisions, this ratio is widely used to compare companies across the same industry. However, EBITDA ignores capital expenditure requirements. Thus, a company may show strong EBITDA but still need to spend heavily on maintaining its assets.

Enterprise Value-to-EBITDA Ratio = EV / EBITDA

Understanding the Enterprise Value-to-EBITDA Ratio Using an Example 

Consider Rose Ltd. with an Enterprise Value of Rs. 10,000 crore and EBITDA of Rs. 1,250 crore. The Enterprise Value-to-EBITDA Ratio of this company is,

Enterprise Value-to-EBITDA Ratio = EV / EBITDA = 10000 / 1250 = 8 times

Thus, investors are paying Rs. 8 for every Rs. 1 of EBITDA generated by the company.

Interpretation - 

  • Lower EV/EBITDA may indicate that a stock is undervalued compared to its peers.

  • Higher EV/EBITDA may indicate that investors expect strong future growth.

This ratio is best used for comparing companies belonging to the manufacturing sector, IT sector, and consumer goods sector, or companies with different debt levels.

EV / EBIT

EV / EBIT

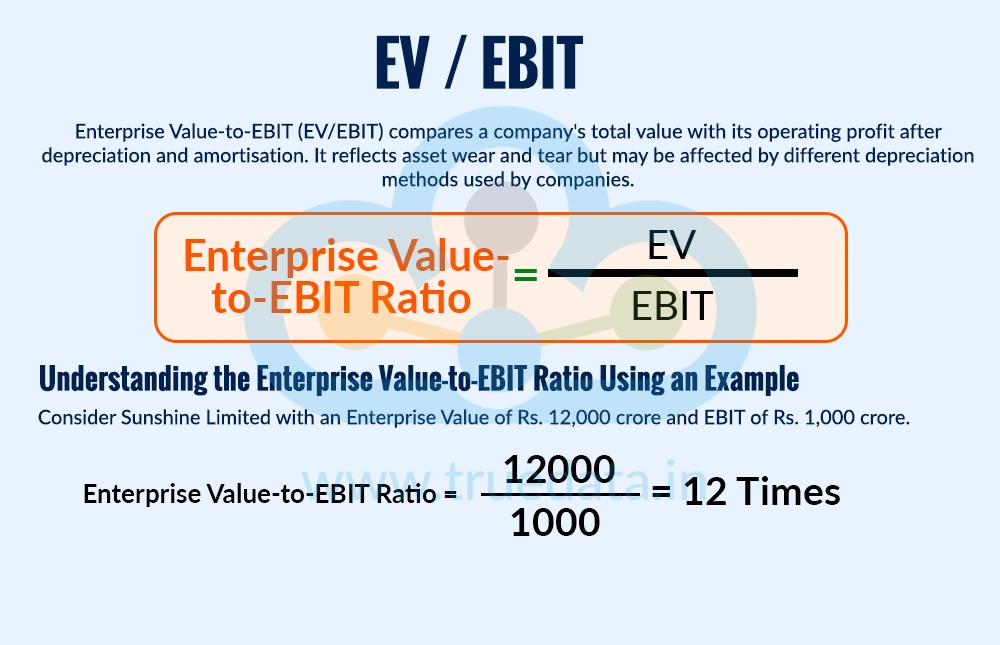
The Enterprise Value-to-EBIT Ratio (EV/EBIT) compares a company's Enterprise Value with its operating profit after accounting for depreciation and amortisation. It shows how much investors are paying for each rupee of operating profit generated by the business. Unlike EBITDA, it reflects the cost of wear and tear of assets. Moreover, depreciation methods can vary from one company to another, which may affect comparisons; thus, this ratio makes it a more conservative valuation measure for investors. 

Enterprise Value-to-EBIT Ratio = EV / EBIT

Understanding the Enterprise Value-to-EBIT Ratio Using an Example

Consider Sunshine Limited with an Enterprise Value of Rs. 12,000 crore and EBIT of Rs. 1,000 crore. The Enterprise Value-to-EBIT Ratio of this company is,

Enterprise Value-to-EBIT Ratio = EV / EBIT = 12000/1000 = 12 times

Thus, investors are paying Rs. 12 for every Rs. 1 of operating profit earned by the company.

Interpretation - 

  • A lower ratio may suggest an attractive valuation.

  • A higher ratio may indicate that investors expect future earnings growth.

  • It is generally considered stricter than EV/EBITDA because it includes depreciation expenses.

This ratio is best used for evaluating Manufacturing businesses, Telecom companies, infrastructure companies, and capital-intensive industries.

EV / Sales

EV / Sales

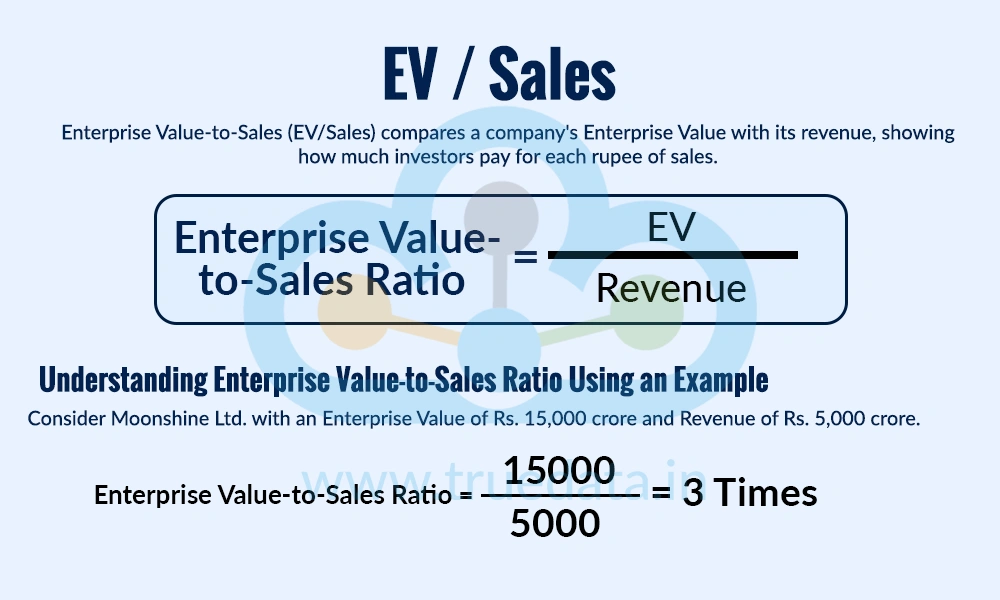
The Enterprise Value-to-Sales Ratio (EV/Sales) compares a company's Enterprise Value with its total revenue. It measures how much investors are willing to pay for every rupee of sales generated by the company. This ratio is particularly useful for companies that are growing rapidly but have not yet become profitable. 

Enterprise Value-to-Sales Ratio = EV / Revenue

Understanding Enterprise Value-to-Sales Ratio Using an Example

Consider Moonshine Ltd. with an Enterprise Value of Rs. 15,000 crore and Revenue of Rs. 5,000 crore. The Enterprise Value-to-Sales Ratio of this company is,

Enterprise Value-to-Sales Ratio = EV / Revenue = 15000/5000 = 3 times. 

Thus, investors value the company at Rs. 3 for every Re. 1 of annual sales.

Interpretation - 

  • A lower ratio may indicate a cheaper stock.

  • A higher ratio may indicate strong growth expectations.

  • Companies with similar sales can have very different profit levels, so this ratio should not be used alone.

This ratio is best used for analysing start-ups, technology companies, e-commerce businesses and loss-making but high-growth companies. 

EV / FCF

EV / FCF

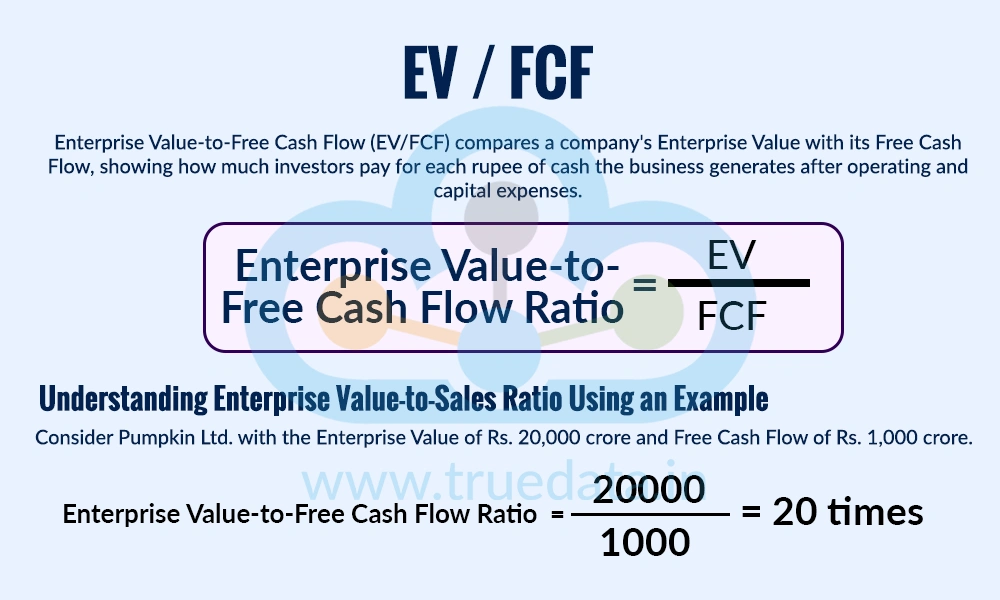
The Enterprise Value-to-Free Cash Flow Ratio (EV/FCF) compares a company's Enterprise Value with its Free Cash Flow (FCF), which is the cash left after paying operating expenses and capital expenditures. Many investors consider cash flows more important than accounting profits because cash is what a company ultimately uses to pay dividends, reduce debt, and fund growth. Thus, this ratio helps investors understand how much they are paying for the cash generated by the business after necessary operating and capital expenses.

Enterprise Value-to-Free Cash Flow Ratio = EV / FCF

Understanding Enterprise Value-to-Sales Ratio Using an Example

Consider Pumpkin Ltd. with an Enterprise Value of Rs. 20,000 crore and Free Cash Flow of Rs. 1,000 crore. The Enterprise Value-to-Free Cash Flow Ratio of this company is,

Enterprise Value-to-Free Cash Flow Ratio = EV / FCF = 20000/1000 = 20 times

Thus, investors are paying Rs. 20 for every Re. 1 of free cash flow generated by the company.

Interpretation - 

  • Lower EV/FCF ratios may indicate better value.

  • Higher ratios suggest investors are willing to pay a premium for future growth.

Companies with stable and growing cash flows often command higher valuations. This metric is best used for evaluating mature businesses, dividend-paying companies, and companies with stable cash generation and for long-term value investing.

Enterprise Value Per Share

Enterprise Value Per Share

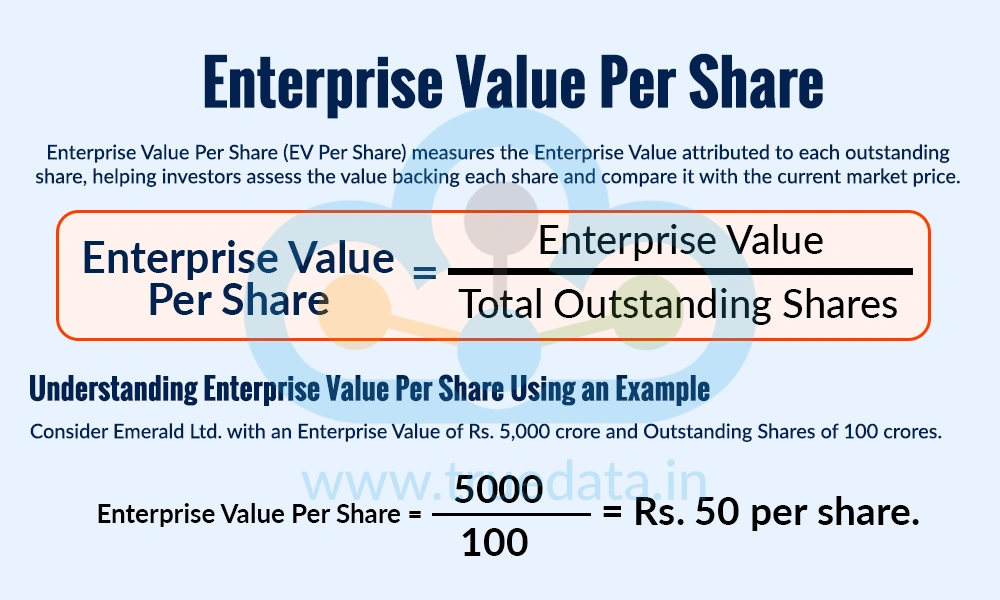
Enterprise Value Per Share (EV Per Share) measures the portion of a company's Enterprise Value attributable to each outstanding share. Unlike the other metrics, it is not a ratio but a per-share valuation measure. While it is not as widely used as EV/EBITDA or EV/FCF, it can help investors understand how much enterprise value backs each share they own. Investors can compare EV per share with the current market price to gain additional valuation insights. It is mainly used as a supporting metric rather than a primary valuation ratio.

Enterprise Value Per Share = Enterprise Value / Total Outstanding Shares

Understanding Enterprise Value Per Share Using an Example

Consider Emerald Ltd. with an Enterprise Value of Rs. 5,000 crore and Outstanding Shares of 100 crores. EV per share of Emerald Ltd. is explained below. 

Enterprise Value Per Share = Enterprise Value / Total Outstanding Shares

Enterprise Value Per Share = 5000/100 = Rs. 50 per share.

This means each share represents Rs. 50 of the company's enterprise value. A higher value generally indicates a larger business value per share. This metric is best used for comparing valuation metrics on a per-share basis, studying changes in company value over time and supporting other valuation analyses. However, Enterprise Value Per Share does not directly indicate whether a stock is cheap or expensive and should be used along with other valuation ratios.

What Should Investors Use - EV or Market Capitalisation?

What Should Investors Use - EV or Market Capitalisation

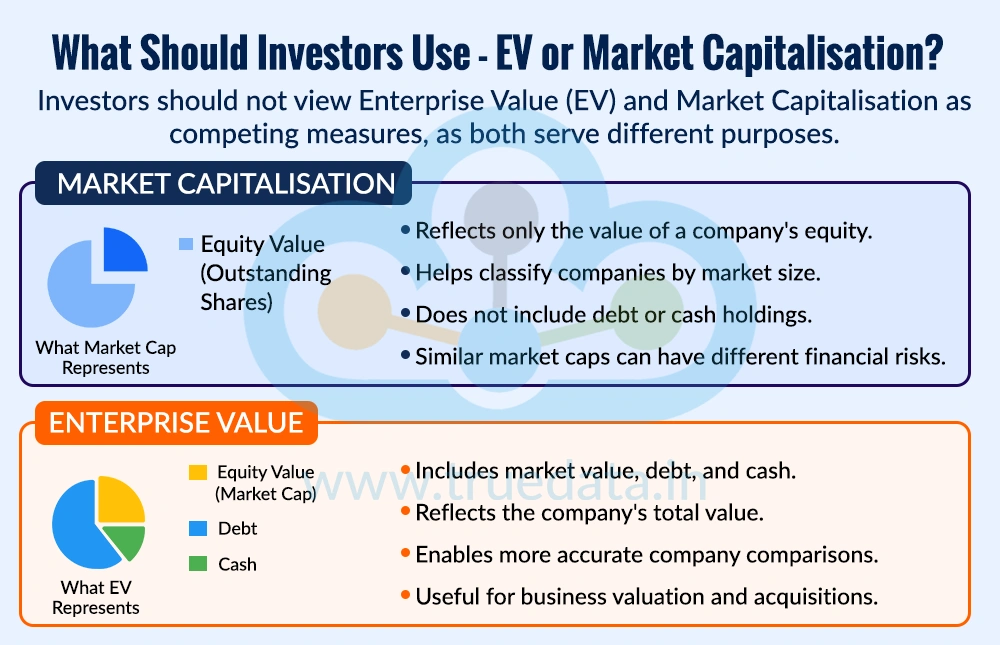
Investors should not view Enterprise Value (EV) and Market Capitalisation as competing measures, as both serve different purposes. Market capitalisation only reflects the value of a company's outstanding shares and shows what the stock market believes the company's equity is worth. It is useful for classifying companies as large-cap, mid-cap and small-cap and for understanding the size of a business. However, it does not consider important factors such as debt and cash, which can significantly affect a company's overall financial position. As a result, two companies with similar market capitalisations may have very different levels of debt and financial risk.

Enterprise Value is often the better metric for investors who want a more complete picture of a company's value. EV includes market capitalisation, debt, and cash, making it a more accurate measure of the total value of the business. This is especially useful when comparing companies in the same industry or evaluating acquisition opportunities. While market capitalisation is helpful for understanding a company's size and popularity in the stock market, Enterprise Value provides deeper insight into the true worth of the business. Therefore, investors should use market capitalisation to assess company size and Enterprise Value when analysing valuation and comparing investment opportunities.

What are the Advantages and Limitations of Using Enterprise Value?

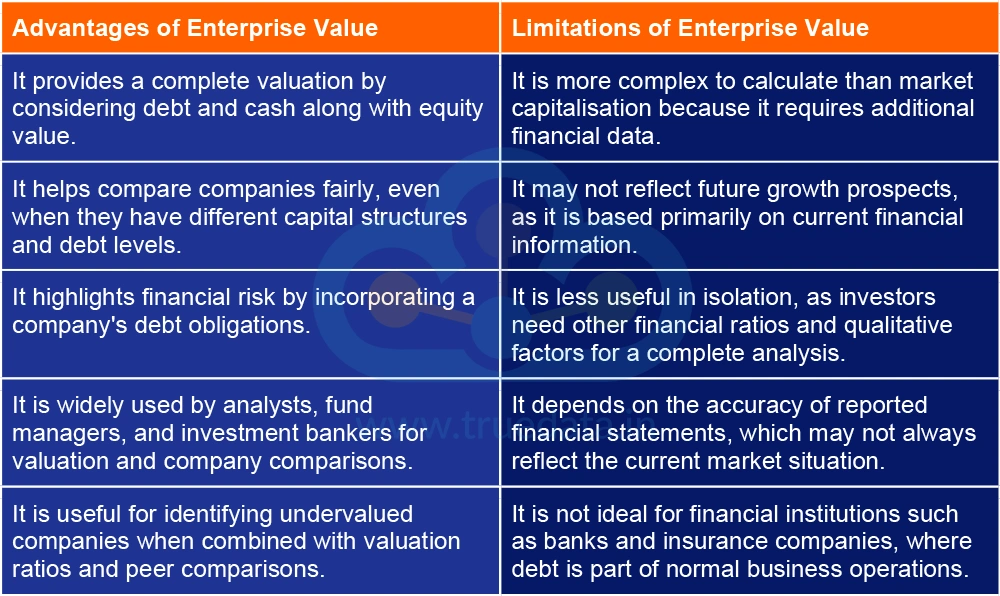
Now that we have explored the enterprise value and its related ratios in detail, let us focus on the advantages and limitations of using enterprise value. 

What are the Advantages and Limitations of Using Enterprise Value

Advantages of Enterprise Value

Limitations of Enterprise Value

It provides a complete valuation by considering debt and cash along with equity value.

It is more complex to calculate than market capitalisation because it requires additional financial data.

It helps compare companies fairly, even when they have different capital structures and debt levels.

It may not reflect future growth prospects, as it is based primarily on current financial information.

It highlights financial risk by incorporating a company's debt obligations.

It is less useful in isolation, as investors need other financial ratios and qualitative factors for a complete analysis.

It is widely used by analysts, fund managers, and investment bankers for valuation and company comparisons.

It depends on the accuracy of reported financial statements, which may not always reflect the current market situation.

It is useful for identifying undervalued companies when combined with valuation ratios and peer comparisons.

It is not ideal for financial institutions such as banks and insurance companies, where debt is part of normal business operations.

Conclusion

Enterprise Value (EV) is a useful valuation metric that helps investors understand the overall value of a company by taking into account its market capitalisation, debt, and cash holdings. It provides a more complete picture of a business than market capitalisation alone and is widely used for comparing companies, analysing valuations, and assessing acquisition costs. While EV should be used alongside other financial metrics, it can help investors make better-informed investment decisions and gain a clearer understanding of a company's true worth and financial position.

This article explains important enterprise valuation ratios and their use in fundamental analysis. Let us know your thoughts on this topic or if you need further information on the same and we will address it soon. 

Till then, Happy Reading!


Read More: Key Corporate Data Every Investor Must Track Before Investing 

Frequently Asked Questions

EV ratios are often preferred over equity-based ratios because they consider a company's debt and cash along with its market value, providing a more complete picture of the business. This makes it easier for investors to compare companies with different capital structures and debt levels.

EV/EBITDA is generally preferred for comparing companies because it focuses on operating earnings before non-cash expenses like depreciation and amortisation. However, EV/EBIT can be more useful for capital-intensive businesses, as it considers depreciation and provides a more realistic view of profitability.

EV ratios should generally be used to compare companies within the same industry, as different industries have different growth rates, profit margins, and capital requirements. Comparing EV ratios across unrelated industries can lead to misleading conclusions about a company's valuation.

When calculating Enterprise Value, investors may need to adjust for items such as preferred shares, minority interest, excess cash, and certain debt obligations to get a more accurate measure of a company's total value. These adjustments help ensure that EV reflects the true cost of owning the entire business.

Neither ratio is universally better. EV/FCF is often preferred when evaluating a company's actual cash-generating ability, while EV/EBITDA is useful for comparing operating performance across companies. Many investors use both ratios together for a more complete valuation analysis.
Marisha Bhatt

Marisha Bhatt is a financial content writer @TrueData.
She writes with the sole aim of simplifying complex financial concepts and jargon while attempting to clarify technical and fundamental analysis concepts of the stock markets. The ultimate goal is to spread vital knowledge and benefit the maximum audience. Her Chartered Accountant background acts as the knowledge base to help clarify crucial concepts and create a sound investment portfolio.

0 Comments

Related Articles

SEE ALL
Corporate Data
Corporate Data
Investing Smarter: The Power of Corporate Data and Market Sentiment Analysis

Thestock market never stands still, and prices swing constantly with every new h...

Corporate Data
Corporate Data
Understanding Quarterly vs Annual Corporate Data

Corporate data is more than just the numbers of a company. They can show what is...

Corporate Data
Corporate Data
Key Corporate Data Every Investor Must Track Before Investing

Investing is not just about numbers on a screen. It is about understanding the s...

Relevant Tags