
Company valuation is an important step in evaluating an investment opportunity, and the P/E ratio is the first step in this direction. But what if you do not get the most accurate picture with the P/E ratio? What do you consider then? This is where the Free Cash Flow Yield comes into the picture! This metric can give a much clearer and more accurate version of business valuation. Curious to know more? Dive into this blog where we dissect the difference between the free cash flow yield and the P/E Ratio, and which is a better metric for valuation.

The Price to Earnings (P/E) Ratio is one of the most commonly used tools to understand how a company is valued in the stock market. In simple terms, it tells investors how much investors are willing to pay for every Re. 1 of a company’s earnings. It helps investors judge whether a stock is expensive, fairly priced, or undervalued compared to its profits. A higher P/E ratio usually means investors expect higher growth in the future and are ready to pay a premium today, while a lower P/E ratio may indicate that the stock is undervalued or that the company has slower growth expectations. However, the P/E ratio should not be used in isolation. It works best when compared with similar companies in the same industry or with the company’s past P/E levels. Thus, the P/E ratio gives a quick snapshot of how the market values a company’s earnings, making it a useful starting point for investors when comparing different stocks or assessing whether a stock looks reasonably priced.
The formula to calculate the P/E Ratio is,
P/E Ratio = Market Price per Share / Earnings per Share (EPS)
Understanding P/E Ratio With an Example
Consider Z Ltd. with share trading at Rs. 200 and EPS of Rs. 20 per share. The PE ratio of this company is,
P/E Ratio = Market Price per Share / Earnings per Share (EPS)
Pe Ratio = 200/20 = 10
Thus, investors are willing to pay Rs. 10 for every Re. 1 of earnings the company generates. If another company in the same industry has a P/E ratio of 20, it means investors are paying Rs. 20 for every Re. 1 of earnings there, possibly because they expect higher future growth from that company.

The Free Cash Flow (FCF) Yield is a useful valuation metric that indicates how much cash a company is generating compared to its market value. It shows the return a company is giving to investors based on the actual cash it generates after spending on its operations and necessary investments (like buying machinery or maintaining assets). Unlike profits, which can sometimes be affected by accounting adjustments, free cash flow focuses on real cash, making it a more reliable indicator of a company’s financial strength. A higher FCF yield generally indicates the company is generating strong cash flows relative to its price. This may also translate to the stock being undervalued, while a lower yield may suggest the stock is expensive or generating weaker cash flows.
The formula to calculate Free Cash Flow Yield is,
Free Cash Flow Yield = Free Cash Flow / Market Capitalisation
Understanding Free Cash Flow Yield With an Example
Consider Y Ltd. with Rs. 500 crores in free cash flows in a year and a total market capitalisation of Rs. 5000 crores. The free cash flow yield of this company is,
FCF Yield = 500 / 5,000 = 0.10 or 10%
Thus, the company is generating a 10% cash return on its market value. In other words, for every Rs. 100 invested in the company, it is generating Rs. 10 in free cash flow. If another company has an FCF yield of only 4%, it means it generates less cash relative to its valuation, which could make it less attractive compared to the first company (assuming other factors are similar).
The P/E ratio is usually the go-to metric for business valuations. However, it can provide an incomplete picture or can even be misleading when accounting profits are manipulated. Free cash flow yield can be a better alternative for business valuation to avoid any errors in judgement and decision-making. The key differences between these metrics are tabled below.


When it comes to stock valuation, investors should not rely on just one metric like the P/E ratio or Free Cash Flow Yield alone. Each metric tells a different part of the story. The P/E ratio is useful as a quick and simple starting point because it shows how the market values a company’s earnings. However, it may not always reflect the true financial strength of a business, especially if profits are affected by accounting adjustments or one-time items. This is where Free Cash Flow Yield becomes important, as it focuses on the actual cash generated by the company, giving a clearer picture of its ability to sustain operations, pay dividends, or reinvest for growth. Using both together helps investors avoid misleading conclusions and make more balanced decisions.
In practice, investors should adopt a combination approach to valuation. The starting point can be the P/E ratio for comparing companies within the same industry, and then validating those insights using Free Cash Flow Yield to check the quality of earnings. Additionally, it is important to look at other factors such as revenue growth, debt levels, return ratios, and industry trends before making any investment decision. Also, no single ratio can capture the complete picture of a company’s performance; hence, a well-rounded analysis that combines multiple metrics will always provide a more reliable and informed view, helping investors make smarter and more confident investment choices.

While using the P/E Ratio and the FCF Yield Ratio is common in stock valuation, they do come with a few limitations. These limitations are explained below.
Limitations of Using the P/E Ratio
The P/E ratio is based on accounting profits, which can be affected by different accounting methods and adjustments.
It does not consider cash flow, so it may not reflect the actual cash-generating ability of a company.
It can be misleading for companies with very low or negative earnings, where the ratio becomes very high or not meaningful.
It does not account for debt levels, which can significantly impact a company’s financial health.
It may give a false sense of undervaluation if a company has weak future growth prospects.
It works best only when comparing companies within the same industry, not across different sectors.
Limitations of Using Free Cash Flow (FCF) Yield
Free cash flow can fluctuate a lot from year to year, making the yield unstable in the short term.
It may appear low for growing companies that are investing heavily, even if they have strong future potential.
Calculation of free cash flow requires detailed financial analysis and is not always readily available.
It does not directly capture market expectations or future growth as the P/E ratio does.
It can be affected by one-time changes in working capital, which may distort the true picture.
It may not be very useful for financial companies like banks and NBFCs, where cash flow works differently.
The P/E Ratio and the Free Cash Flow Yield are both useful tools for stock valuation, but neither should be used alone. The P/E ratio offers a quick and simple view based on profits, making for initial analysis, while Free Cash Flow Yield provides a deeper and more realistic understanding by focusing on actual cash generation. Each metric has its own strengths and limitations, and their effectiveness can vary depending on the type of business and industry. Thus, the best approach is to use a combination of both these metrics along with other financial indicators to get a complete picture and make more informed and confident investment decisions.
This article helps in understanding the finer analysis of valuation and the right mix for the same. Let us know your thoughts on the topic or if you want further details, and we will address it soon.
Till then, Happy Reading!
Read More: Common Mistakes in Company Fundamental Analysis and How to Avoid Them
Marisha Bhatt is a financial content writer @TrueData.
She writes with the sole aim of simplifying complex financial concepts and jargon while attempting to clarify technical and fundamental analysis concepts of the stock markets. The ultimate goal is to spread vital knowledge and benefit the maximum audience. Her Chartered Accountant background acts as the knowledge base to help clarify crucial concepts and create a sound investment portfolio.

Thestock market never stands still, and prices swing constantly with every new h...
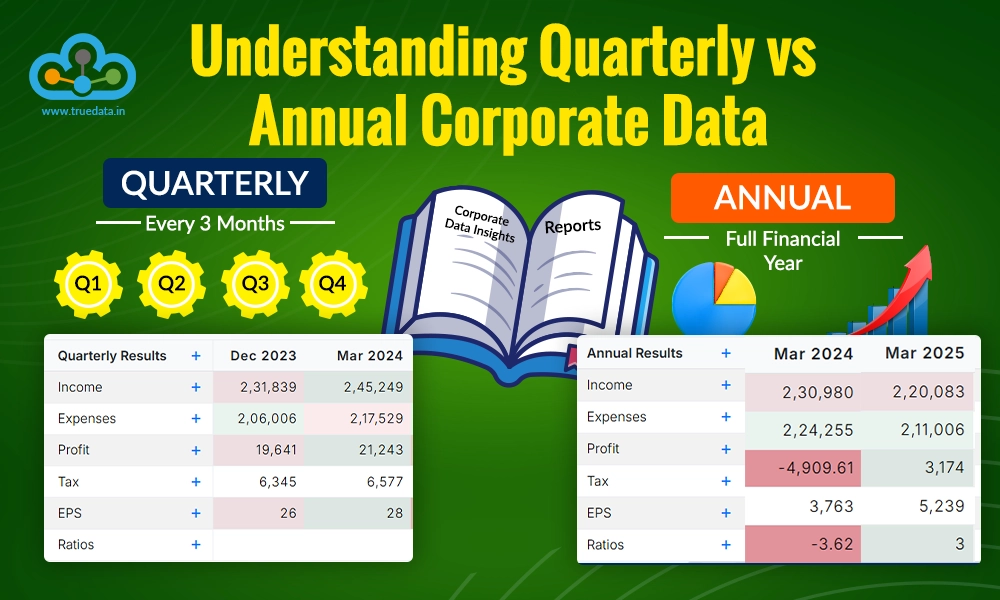
Corporate data is more than just the numbers of a company. They can show what is...
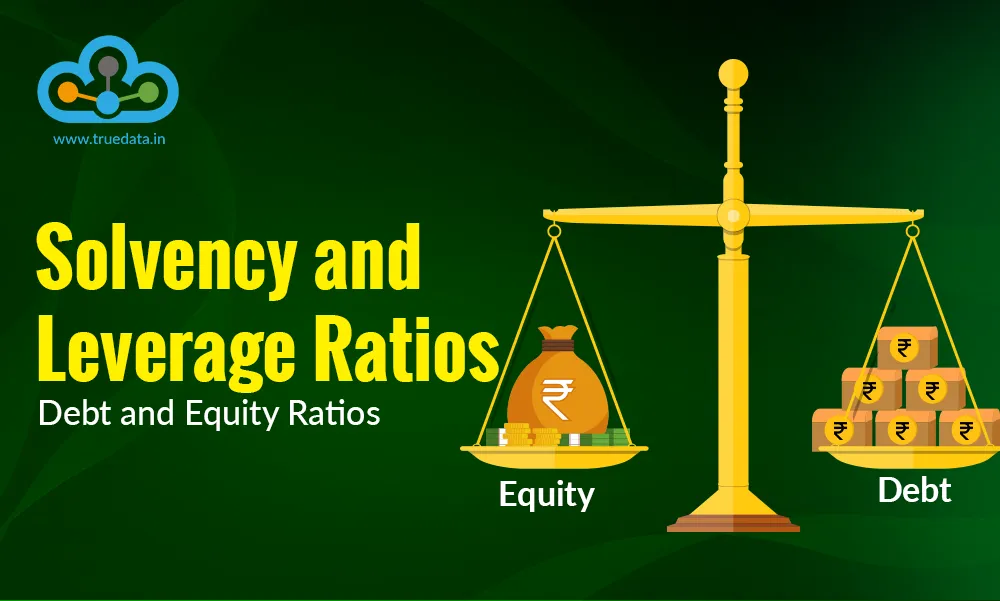
Debt and equity together form the total capital of a company. However, when anal...