Trading Strategies / Indicators

What are Trend Lines? How to Use Them?

Marisha Bhatt · 04 Aug 2026 · 13 mins read · 0 Comments

what-are-trend-lines-how-to-use-them

Have you ever wondered how experienced traders can quickly tell whether a stock is in an uptrend or a downtrend? In many cases, the answer is as simple as drawing a trend line. Despite being one of the oldest and simplest tools in technical analysis, trend lines continue to help traders understand market direction and identify potential trading opportunities. But how are these lines made, and how to use them? Get answers to these questions, and more in this blog where we explore the meaning of trend lines, learn how to draw them correctly and understand their importance in technical analysis.

What are Trend Lines?

What are Trend Lines

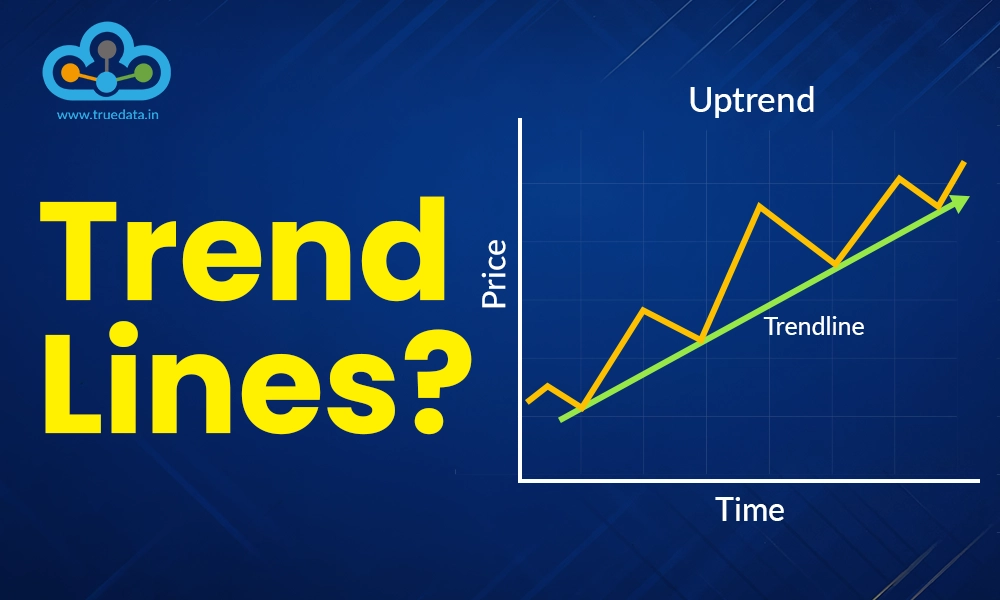
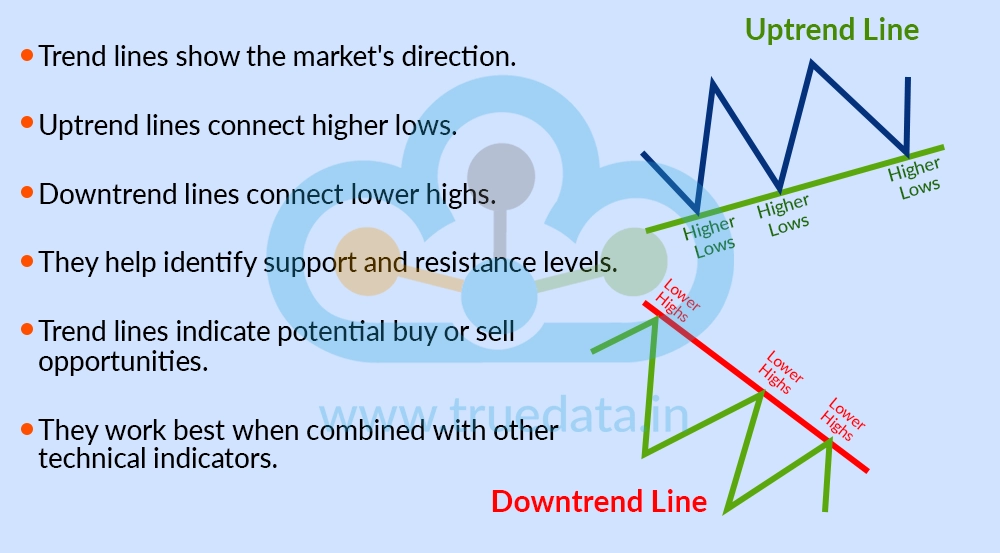
Trend lines are straight lines drawn on a price chart to show the general direction in which the price of a stock, index, commodity, or any other financial asset is moving. They are created by connecting two or more important price points, such as highs or lows, and then extending the line into the future. An upward-sloping trend line connects higher lows and indicates that buyers are in control, while a downward-sloping trend line connects lower highs and suggests that sellers are dominating the market. Traders use trend lines to identify the direction of the market, recognise potential support and resistance levels, and spot possible buying or selling opportunities.

The concept of trend lines is derived from Dow Theory, developed by Charles H. Dow in the late 19th century. Dow observed that markets tend to move in identifiable trends rather than in completely random patterns. Over time, technical analysts began using simple lines on price charts to visually represent these trends, making it easier to understand market behaviour. Today, trend lines are one of the most widely used tools in technical analysis as they are simple to draw, easy to understand, and can be applied to multiple assets like stocks, mutual funds, ETFs, indices, commodities, currencies, etc. While trend lines can provide valuable insights into price movements, they work best when used alongside other technical indicators and sound risk management rather than as a standalone decision-making tool.

How to Draw Trendlines?

Drawing a trend line may seem simple, but drawing it correctly is important for accurate analysis. A well-drawn trend line helps in identifying the market's direction, potential support and resistance levels, and possible buying or selling opportunities. The basic idea is to connect important price points while following the natural movement of the market instead of forcing the line to fit every price swing. 

In Charts

When using a line chart, the trend line is drawn by connecting important closing prices, as a line chart only shows the closing price of each trading session.

how-to-draw-trendlines

  • For an Uptrend - 

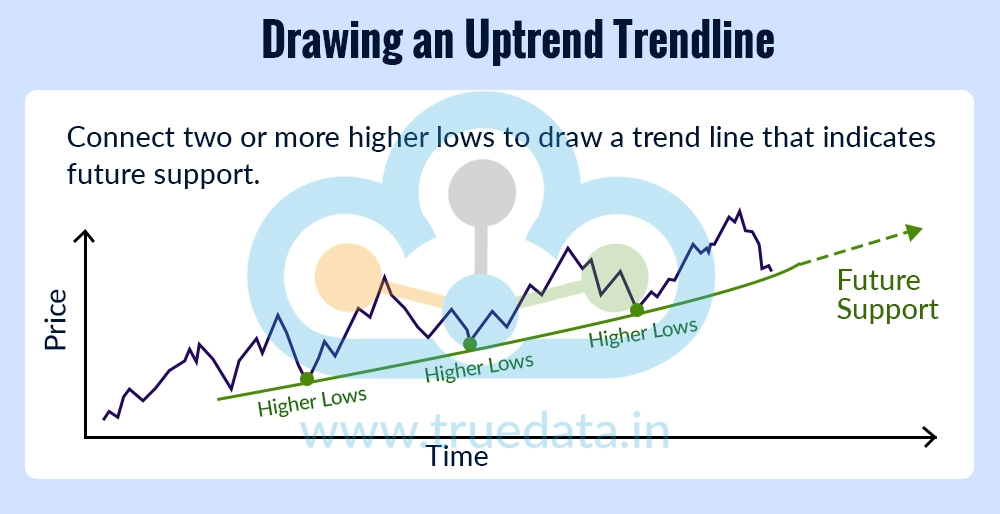
    • Identify a market where prices are making higher lows.

    • Connect at least two significant higher lows with a straight line.

    • Ideally, the line should touch three or more higher lows, as this makes the trend line more reliable.

    • Extend the line to the right to estimate future support levels.

    • Avoid forcing the line to pass through every price point. It should represent the overall trend rather than every small fluctuation.

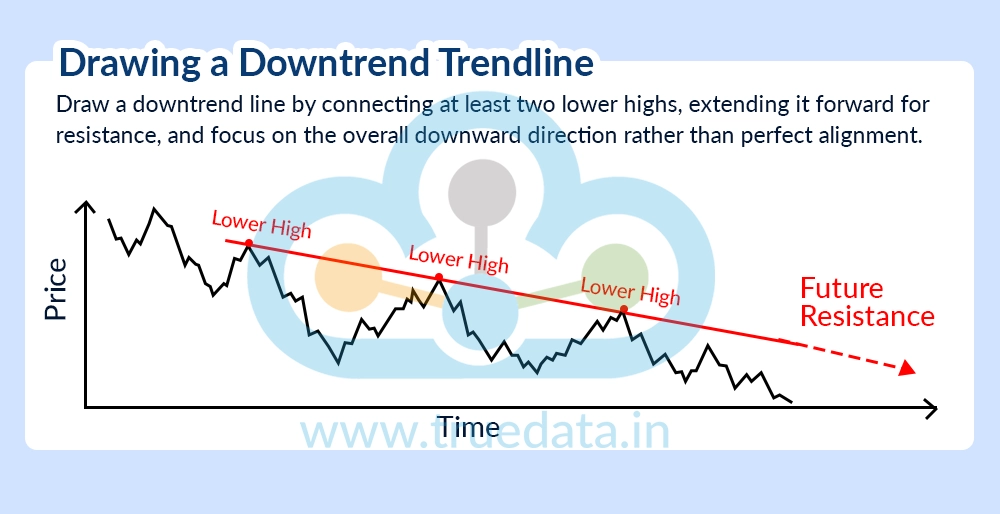
  • For a Downtrend - 

for-a-downtrend

  • Look for a market where prices are making lower highs.

  • Connect at least two important lower highs using a straight line.

  • A trend line touching three or more lower highs is generally considered stronger.

  • Extend the line forward to identify potential resistance levels.

  • Small price deviations are normal, so focus on the overall direction instead of perfect alignment.

  • For a  Sideways Trend
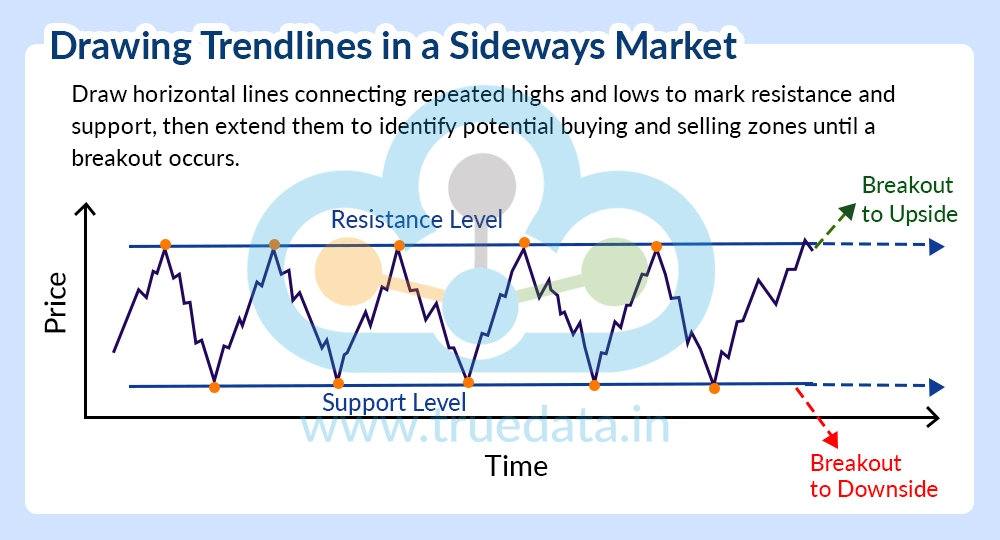
  • A sideways trend (also called a range-bound market) occurs when prices move within a horizontal range instead of making higher highs or lower lows. In a line chart, traders use horizontal trend lines rather than sloping ones.

for-a-sideways-trend-1

  • Identify a market where prices are repeatedly moving between a similar high and a similar low.
  • Draw a horizontal line connecting at least two significant highs to mark the resistance level.

  • Draw another horizontal line connecting at least two significant lows to mark the support level.

  • If the price touches these levels three or more times, the range is generally considered more reliable.

  • Extend both lines to the right to identify potential buying and selling zones until the price breaks out of the range.

In Candlesticks

Candlestick charts provide much more information than line charts because they show the opening, closing, highest, and lowest prices for each trading session. As a result, drawing trend lines on candlestick charts requires better judgement.

  • For an Uptrend -

how-to-draw-trendline-in-candlesticks

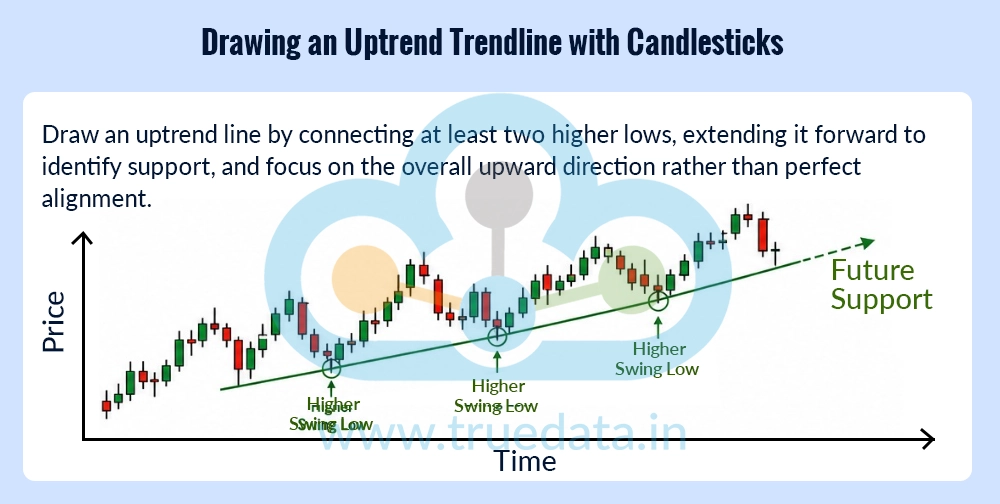
  • Identify the series of higher swing lows formed by the candlesticks.

  • Draw a straight line connecting the lower portions (swing lows) of at least two candlesticks.

  • If a few candlestick shadows (wicks) slightly cross the line, it is generally acceptable as long as most of the price action respects the trend line.

  • Extend the line forward to identify potential support where buyers may enter again.

  • For a Downtrend -

for-a-downtrend-candlestick

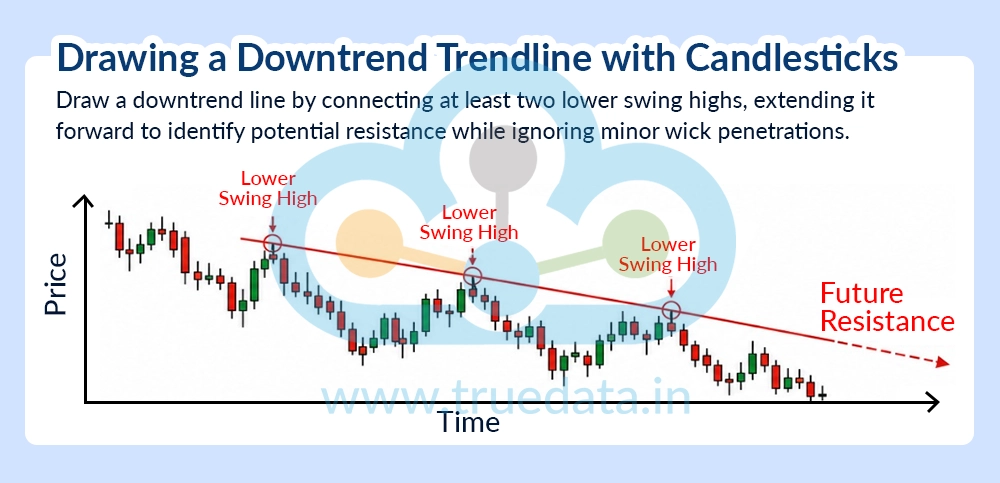
  • Identify the series of lower swing highs.

  • Draw a straight line connecting the upper portions (swing highs) of at least two candlesticks.

  • Minor penetration by candlestick wicks is common and does not necessarily invalidate the trend line.

  • Extend the line to estimate future resistance levels where sellers may become active.

  • For a Sideways Trend - 

For a Sideways Trend

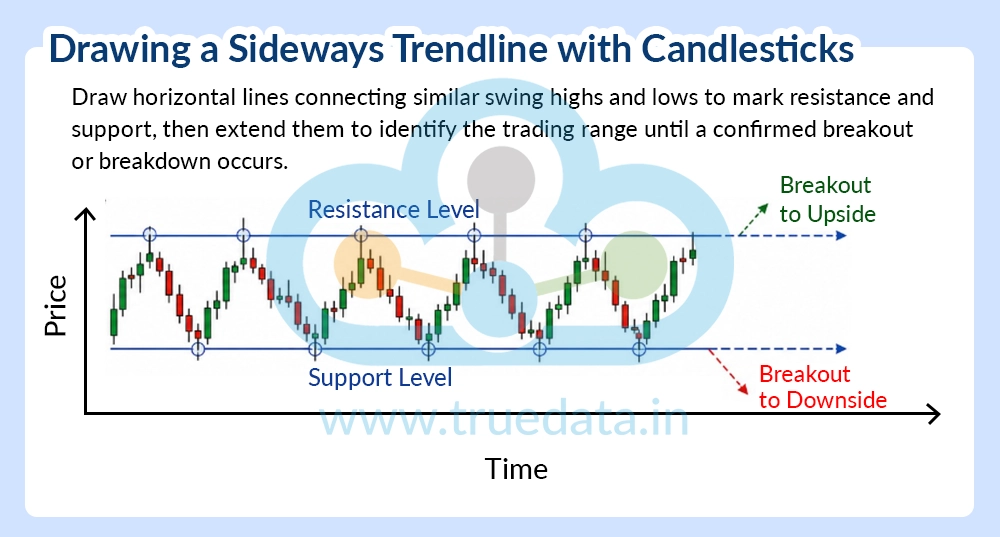
On a candlestick chart, a sideways trend is identified when prices repeatedly reverse from nearly the same support and resistance levels without establishing a clear uptrend or downtrend.

  • Identify the series of similar swing highs and similar swing lows formed by the candlesticks.

  • Draw a horizontal line connecting the swing highs to mark the resistance level.

  • Draw another horizontal line connecting the swing lows to mark the support level.

  • Minor penetration of the support or resistance levels by candlestick wicks is normal, provided that the price largely remains within the range.

  • Extend both horizontal lines to estimate where prices may continue to find support and resistance until a confirmed breakout or breakdown occurs.

Key Points to Remember While Drawing Trendlines 

  • A trend line should follow the main trend, not every minor price movement.

  • The more times the price respects the trend line without breaking it, the stronger and more reliable the trend line becomes.

  • Draw trend lines using major swing highs and swing lows, not small price fluctuations.

  • Trend lines become less reliable if they are repeatedly broken or require frequent adjustments.

  • Extend the trend line into the future to identify possible support, resistance, or breakout levels.

  • Use trend lines along with other technical indicators such as moving averages, RSI, volume, or MACD to improve the quality of the trading decisions instead of relying on trend lines alone.

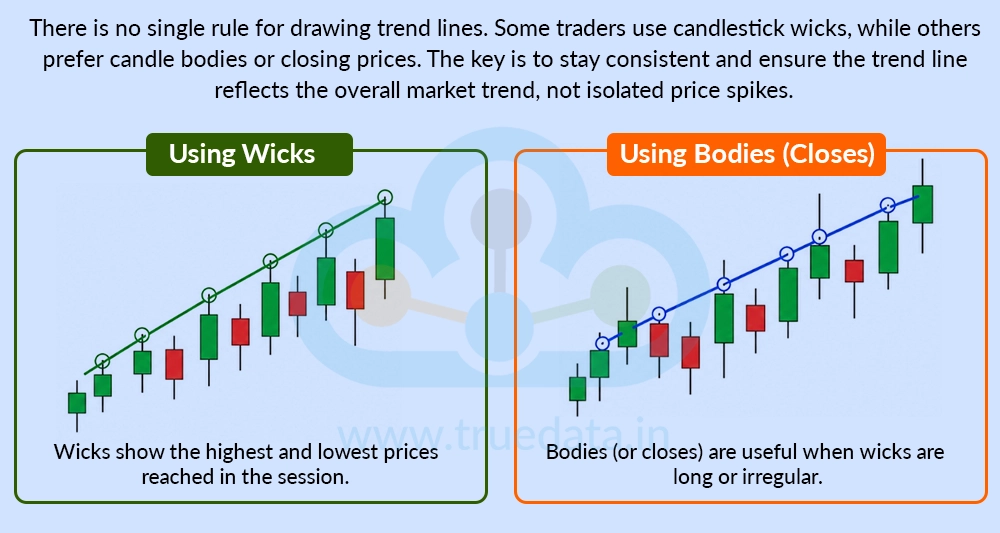
Should Traders Use the Candlestick Body or the Wick to Draw Trendlines?

should-traders-use-the-candlestick-body-or-the-wick-to-draw-trendlines-1

There is no single rule that applies in every situation. Many traders prefer drawing trend lines through the candlestick wicks because they represent the highest and lowest prices reached during the trading session. Others use the closing prices or candle bodies, especially when the market shows long, irregular wicks caused by temporary volatility. The most important thing is to remain consistent with the method chosen and ensure that the trend line reflects the overall market direction rather than isolated price spikes.

Why are Trendlines Important in Technical Analysis?

Why are Trendlines Important in Technical Analysis

Trend lines are one of the most useful tools in technical analysis because they help investors and traders understand the overall direction of the market. Instead of getting distracted by daily price fluctuations, trend lines make it easier to identify whether prices are moving upward, downward, or sideways. Since they are simple to draw and interpret, they are widely used by beginners as well as experienced market participants. However, trend lines should always be used along with other technical indicators and proper risk management for better decision-making.

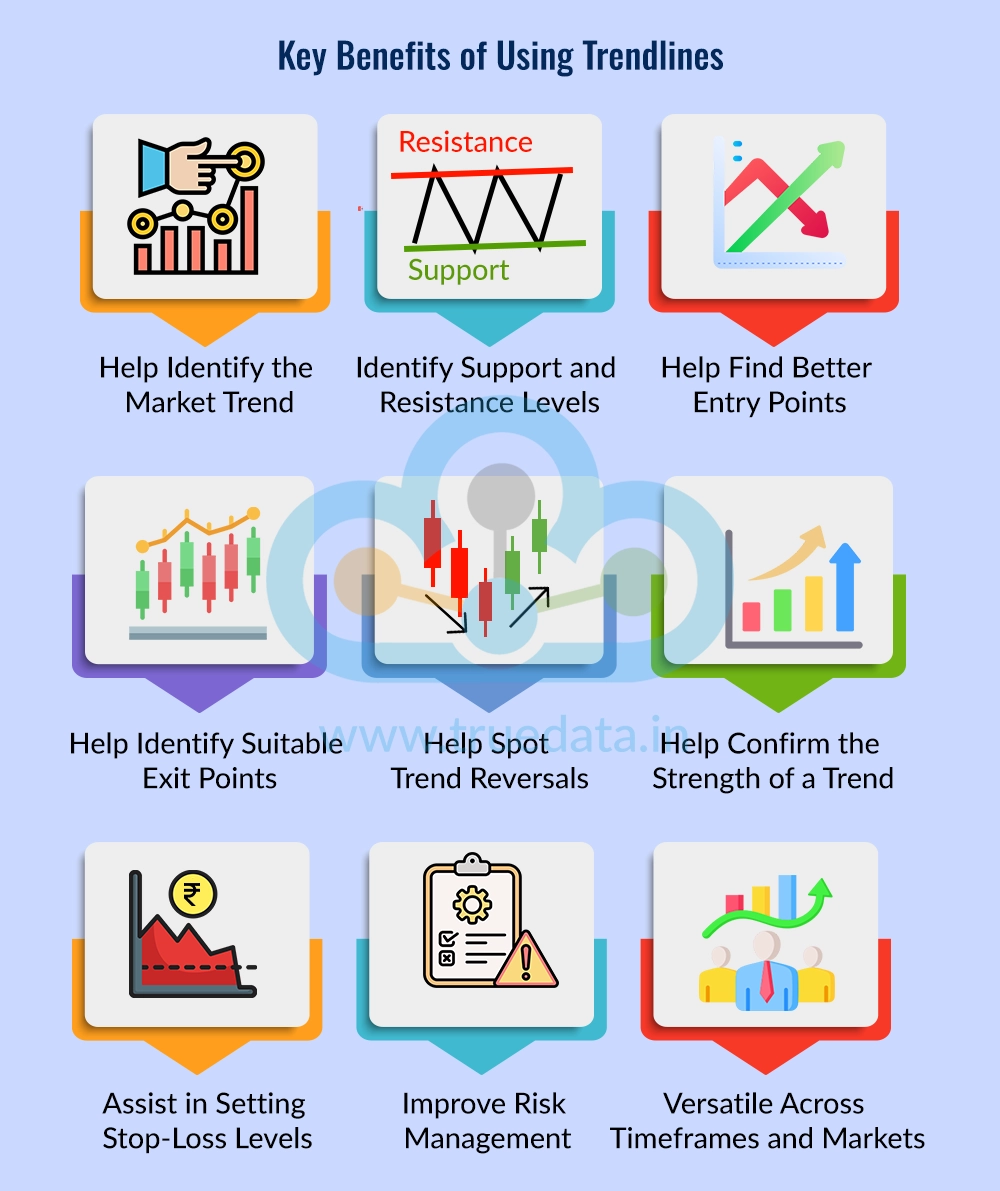
Help Identify the Market Trend

The primary purpose of a trend line is to show the direction in which the price is moving. An upward-sloping trend line indicates that buyers are in control and the market is in an uptrend. A downward-sloping trend line suggests that sellers are dominating and the market is in a downtrend. By identifying the prevailing trend, investors and traders can align their decisions with the overall market direction instead of trading against it.

Identify Support and Resistance Levels

Trend lines often act as dynamic support and resistance levels. In an uptrend, the trend line can act as a support level where prices may stop falling and resume rising. In a downtrend, the trend line can act as a resistance level where prices may struggle to move higher before declining. These levels help traders anticipate possible price reactions and plan their trades more effectively.

Help Find Better Entry Points

One of the biggest advantages of using trend lines is that they can help identify potential buying opportunities. During an uptrend, traders often wait for the price to pull back towards the trend line before considering a buy. This allows them to enter a trade closer to the support level instead of buying after a sharp price rise. Similarly, entering near the trend line may also improve the risk-reward ratio of a trade.

Help Identify Suitable Exit Points

Trend lines are equally useful for planning exits. If the price repeatedly fails to move above a downward trend line, traders may consider booking profits or avoiding fresh buying. Similarly, if the price breaks below an upward trend line with strong confirmation, it may signal that the existing trend is weakening and that it could be time to reduce exposure or exit the trade.

Help Spot Trend Reversals

A trend line can provide an early indication that the market direction may be changing. For example, when the price decisively breaks above a downward trend line, it may suggest that buyers are gaining strength. Likewise, when the price falls below an upward trend line, it may indicate that sellers are taking control. While a trend line break does not always lead to a reversal, it alerts traders to watch for additional confirmation before making decisions.

Help Confirm the Strength of a Trend

The more times the price touches a trend line and moves in the expected direction without breaking it, the stronger the trend is generally considered to be. A trend line that has been respected several times often reflects strong buying or selling interest. This gives traders greater confidence in the existing trend, although no trend remains intact forever.

Assist in Setting Stop-Loss Levels

Trend lines can help traders place stop-loss orders more logically. For example, in an uptrend, a stop-loss may be placed slightly below the upward trend line to limit losses if the trend changes. In a downtrend, traders who are short-selling may place a stop-loss slightly above the downward trend line. Using trend lines for stop-loss placement helps manage risk while allowing the trade enough room to move naturally.

Improve Risk Management

Successful trading is not only about finding profitable opportunities but also about managing risk. Trend lines help traders estimate where the price may find support or resistance, making it easier to calculate potential profit and possible loss before entering a trade. This helps in selecting trades with a favourable risk-reward ratio rather than making decisions based on emotions.

Versatile Across Timeframes and Markets

One of the biggest advantages of trend lines is their versatility. They can be used across different timeframes, from intraday and daily charts to weekly and monthly charts, making them useful for day traders, swing traders, positional traders, and long-term investors alike. Trend lines are also applicable across various financial markets, including stocks, indices, ETFs, commodities, currencies, bonds, and other traded assets.

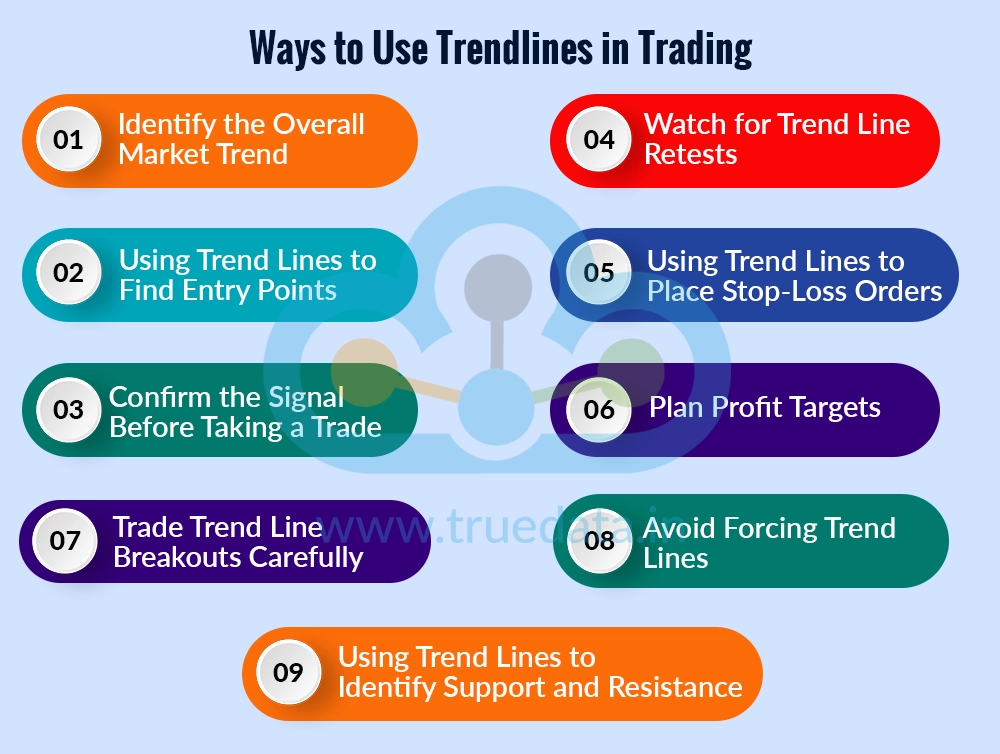
How to Use Trendlines in Trading?

How to Use Trendlines in Trading

Trend lines are more than just lines on a chart; they help traders understand market direction, identify potential trading opportunities, and manage risk. However, they should not be used as the only basis for making trading decisions. Combining trend lines with other technical indicators, price action, and proper risk management can improve the chances of making well-informed trades.

  • Identify the Overall Market Trend - The first step is to determine whether the market is in an uptrend, downtrend, or sideways trend. Traders should draw an upward trend line by connecting higher lows or a downward trend line by connecting lower highs. Trading in the direction of the prevailing trend generally has a higher probability of success than trading against it.

  • Using Trend Lines to Find Entry Points - Trend lines can help identify potential entry opportunities.

    • In an uptrend - Traders often look for buying opportunities when the price falls back towards the upward trend line and then starts moving higher again.

    • In a downtrend - Traders may look for selling or short-selling opportunities when the price rises towards the downward trend line and then begins to decline.

Waiting for the price to react near the trend line instead of chasing the market can lead to better trade entries.

  • Confirm the Signal Before Taking a Trade - Traders should not enter a trade simply because the price touches a trend line. They should look for additional confirmation, such as,

    • A bullish or bearish candlestick pattern.

    • An increase in trading volume.

    • Confirmation from indicators such as RSI, MACD, or Moving Averages.

    • A strong price bounce from the trend line.

Using multiple signals together can help reduce the chances of false trades.

  • Using Trend Lines to Identify Support and Resistance - Trend lines often act as dynamic support and resistance levels.

    • In an uptrend, the trend line may act as support where buyers become active.

    • In a downtrend, the trend line may act as resistance where sellers may enter the market.

These levels can help traders plan their entries, exits, and stop-loss orders more effectively.

  • Trade Trend Line Breakouts Carefully - A breakout occurs when the price moves decisively above or below a trend line.

    • A breakout above a downward trend line may indicate that buyers are gaining strength.

    • A breakout below an upward trend line may suggest that sellers are taking control.

However, not every breakout leads to a new trend. Therefore, traders should wait for confirmation through a strong closing price, higher trading volume, or a successful retest of the broken trend line before taking a position.

  • Watch for Trend Line Retests - After a breakout, the price often returns to test the broken trend line before continuing in the new direction. This is known as a retest.

    • After an upward breakout, the old resistance trend line may become support.

    • After a downward breakout, the old support trend line may become resistance.

Many traders wait for a successful retest before entering a trade because it can provide greater confidence in the breakout.

  • Using Trend Lines to Place Stop-Loss Orders - Trend lines can help determine logical stop-loss levels.

    • For a buy trade, the stop-loss is often placed slightly below the upward trend line or below the recent swing low.

    • For a sell or short trade, the stop-loss is often placed slightly above the downward trend line or above the recent swing high.

This approach helps limit potential losses if the market moves against the trade.

  • Plan Profit Targets - Trend lines can also help in setting realistic profit targets. Traders often look for previous support and resistance levels, chart patterns, or important price zones to estimate where the price may face buying or selling pressure. Thus, having a predefined exit plan helps avoid emotional decision-making.

  • Avoid Forcing Trend Lines - A trend line should naturally connect important swing highs or swing lows. If traders have to adjust or force the line to fit the price movement, it is probably not a valid trend line. Focus should be on the overall market structure instead of trying to connect every price movement.

What are the Limitations of Trendlines?

What are the Limitations of Trendlines

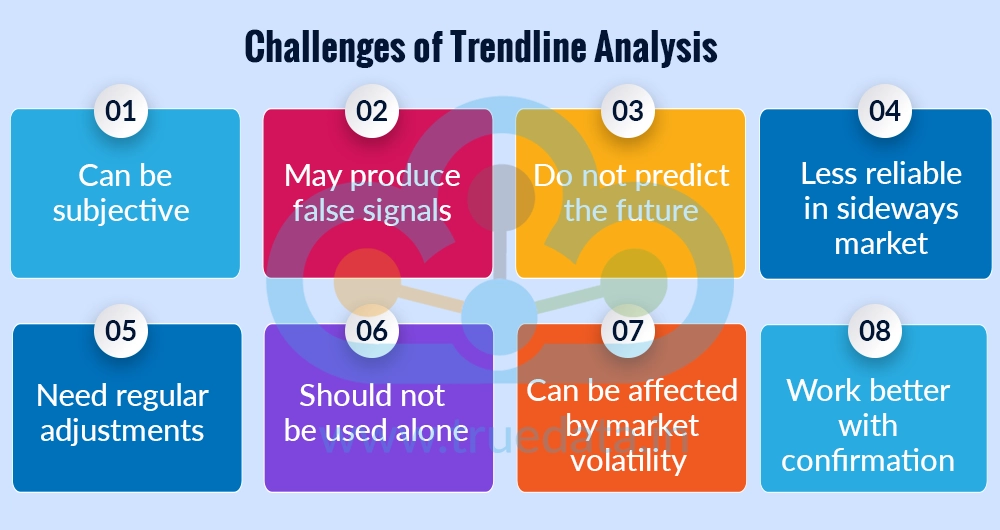
While trend lines are a useful technical analysis tool, they are not perfect. Investors and traders should understand their limitations before relying on them for trading decisions. These limitations include, 

  • Can be subjective - Different traders may draw trend lines differently, which can lead to different interpretations of the same chart.

  • May produce false signals - A price may briefly break a trend line and then quickly move back, resulting in a false breakout or breakdown.

  • Do not predict the future - Trend lines indicate the current market trend but cannot guarantee how prices will move next.

  • Less reliable in sideways markets - When prices move within a narrow range without a clear trend, trend lines may provide limited insights.

  • Need regular adjustments - As new price data becomes available, trend lines may need to be redrawn to reflect the latest market movements.

  • Should not be used alone - Relying only on trend lines can increase the risk of incorrect trading decisions. They should be used along with indicators such as RSI, MACD, Moving Averages, and volume analysis.

  • Can be affected by market volatility - Sudden news events, economic announcements, or unexpected market movements can cause prices to break trend lines temporarily.

  • Work better with confirmation - A trend line becomes more reliable when supported by other technical signals, chart patterns, or strong trading volume.

Conclusion

Trend lines are one of the simplest and most effective tools in technical analysis. They help investors and traders identify market trends, find potential entry and exit points, and recognise important support and resistance levels. However, like any technical tool, trend lines are not always accurate and should not be used on their own. Combining them with other technical indicators, price action, and proper risk management can help traders make more informed trading decisions. 

This article focuses on a fundamental concept of technical analysis and its nuances. Let us know your thoughts on the topic or if you need further information on the same, and we will address it soon. 

Till then, Happy Reading!


Read More: What is Position Trading? 

Frequently Asked Questions

A trend line requires at least two significant price points (two swing highs or two swing lows) to be drawn. However, a trend line that is touched or respected by three or more price points is generally considered more reliable for trading decisions.

The slope of a trend line shows how strong and how fast the price is moving in a particular direction. A steeper slope indicates stronger price momentum, while a flatter slope suggests a slower or weaker trend.

In an uptrend, the trend line often acts as a support level, where prices may stop falling and move higher. In a downtrend, the trend line acts as a resistance level, where prices may struggle to rise and start falling again.

Common mistakes include forcing a trend line to fit the chart, drawing it through insignificant price points, and relying on it alone without confirmation from other indicators. Traders should use trend lines with price action, volume, and other technical indicators for more reliable trading decisions.

A trend line is a single line that shows the direction of the market, while a channel consists of two parallel trend lines that mark the upper resistance and lower support levels. A channel helps traders identify the likely range within which prices may move.
Marisha Bhatt

Marisha Bhatt is a financial content writer @TrueData.
She writes with the sole aim of simplifying complex financial concepts and jargon while attempting to clarify technical and fundamental analysis concepts of the stock markets. The ultimate goal is to spread vital knowledge and benefit the maximum audience. Her Chartered Accountant background acts as the knowledge base to help clarify crucial concepts and create a sound investment portfolio.

0 Comments

Related Articles

SEE ALL
Trading Strategies / Indicators
Three Black Crows Patterns and Trading Strategies

The red and green candlesticks on a chart may look like chaos at first glance. B...

Trading Strategies / Indicators
What is the Flag And Pole Pattern In Technical Analysis?

Global uncertainty often spills over into financial markets. In times when geopo...

Trading Strategies / Indicators
Engulfing Candlestick Patterns

Candlestick patterns are among the most basic and common tools traders use to cr...