
The world of trading is evolving rapidly, with more investors and traders stepping into the markets despite global uncertainty and constant change. In such a fast-moving environment, timely and accurate market data plays a crucial role in making informed trading decisions. Among the various types of market data, tick-by-tick data stands out for its ability to capture every price movement in real time. Curious to explore more about tick-by-tick data or tick data trading? Read on this blog where we break down what tick-by-tick data really means, and how it can support better trading decisions.

Tick-by-tick data is the most detailed form of real-time market data, where every single trade and price change in a security is recorded exactly when it happens. Each tick usually contains the transaction price, traded quantity, precise time, and sometimes the direction of the trade. This data is often referred to as time and sales data and reflects the true flow of trades in the market. Unlike candle charts or summary data, tick-by-tick data does not aggregate information, but it shows the market tick after tick, making it a core part of intraday market data for active investors and traders.
The importance of tick-by-tick data in trading is explained below.
Tick-by-tick data plays a key role as order flow data, helping traders understand how buying and selling are actually happening in the market. Instead of just seeing price levels, traders can observe whether trades are happening aggressively or quietly. This insight supports better tick data for price discovery, especially during volatile sessions in indices like Nifty and Bank Nifty.
Tick-by-tick data is especially useful for intraday traders, scalpers, and those using algorithmic or quantitative trading systems because it provides real-time market data at the most detailed level. By analysing time and sales data and order-flow data, traders can spot quick price fluctuations, breakout attempts, and sudden shifts in demand or supply as they happen. Unlike aggregated charts, tick data reflects actual trades, which helps in improving trading accuracy with tick data by allowing better-timed entries and exits. This makes tick data for trading strategies highly effective, particularly in intraday market data and options trading, where even small price differences can have a big impact on profits and losses.
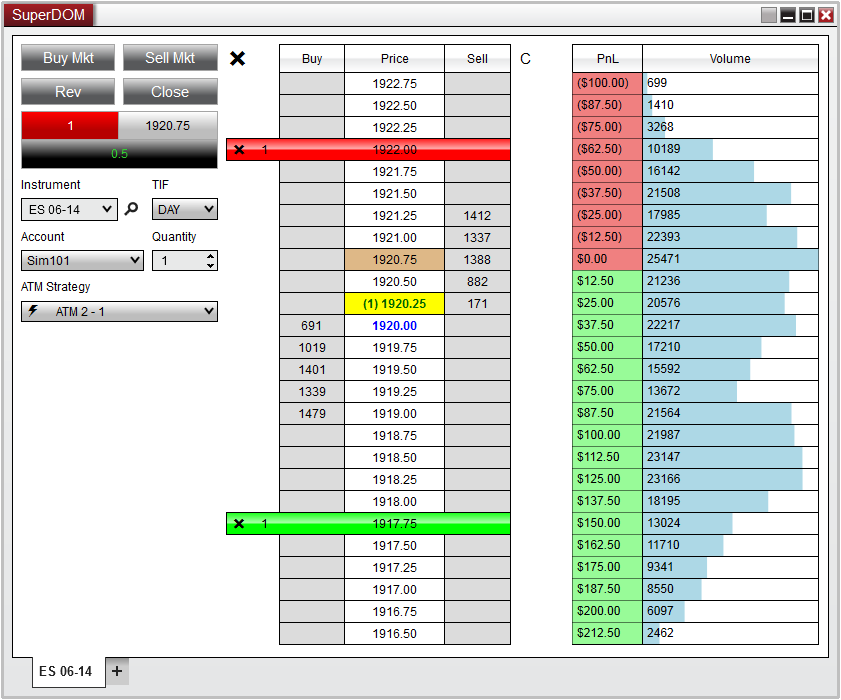
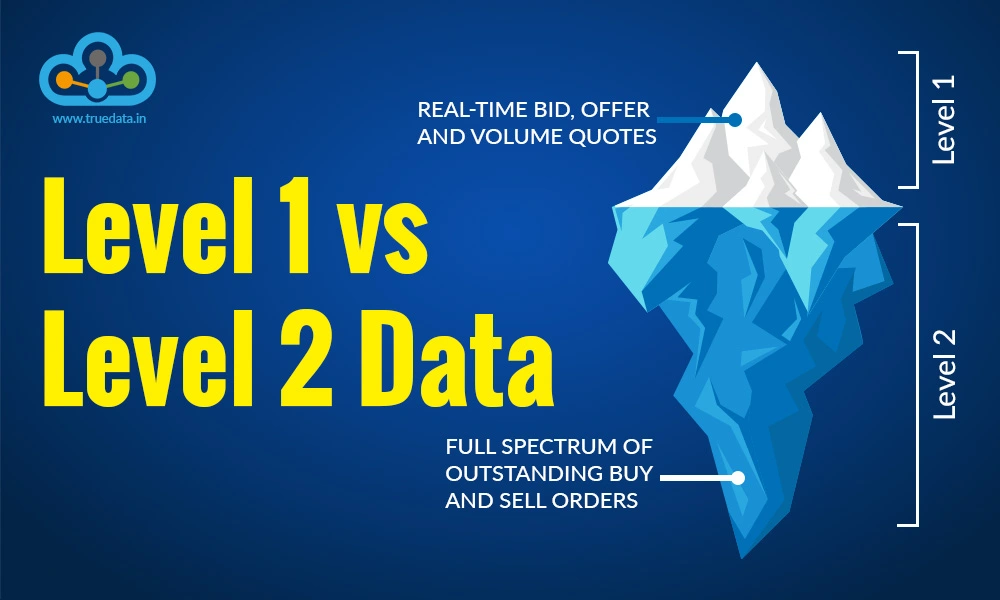
While Level 1 data shows the best bid, ask, and last traded price, Level 2 data goes deeper by showing multiple bid and ask levels. Tick-by-tick data complements both by revealing how quickly prices change and how orders get filled. Together, they help traders judge market depth, liquidity, and short-term strength or weakness more accurately.
Tick-by-tick data forms the backbone of algorithmic trading data and quantitative trading data. Automated systems rely on precise tick movements to trigger trades, manage risk, and optimise execution. For traders building rule-based systems, tick data for trading strategies allows realistic back-testing that includes slippage and sudden price spikes.
Markets can change direction within seconds, especially during news events or high-volatility sessions. Tick-by-tick data helps traders react faster and make informed decisions based on real-time activity rather than delayed or averaged data. This edge can make a meaningful difference over the long run for serious traders.

The tick-by-tick data provides very detailed real-time market information, including both order book changes and actual executed trades. The rich structure supports algorithmic trading data and quantitative trading data models, where every event matters. They allow rigorous tick data processing, help detect anomalies, and improve execution and strategy backtesting. Thus, correctly capturing all fields helps avoid tick data quality issues, latency problems, and supports accurate market analysis. The constituents of the tick-by-tick data include,
Header Information -
This helps systems synchronise and understand the structure of the incoming data. Every tick message starts with a header that includes,
Stream ID, which identifies which feed channel the data belongs to.
Sequence Number, which helps keep ticks in order and detect missing data.
Order Messages (New / Modify / Cancel) -
These components form order flow data, allowing analysis of how orders enter, modify, or exit the market. These messages represent order-book actions and include,
Timestamp, the exact time of the order event (often in nanoseconds).
Order ID, i.e., unique identifier for the order.
Token (Instrument ID), which identifies the specific stock or derivative contract.
Order Type (Buy/Sell), which shows whether the order is to buy or sell.
Price, i.e., the order price, in paise (must be converted to rupees).
Quantity (number of shares or contracts in the order).
Trade Messages -
This is the real tick data that shows executed trades for tick data for trading strategies and tick data for price discovery. These messages appear whenever a trade (execution) occurs and contain,
Timestamp, which is the precise time when the trade happened.
Buy & Sell Order IDs, i.e., reference to the orders that matched.
Token (Instrument ID), i.e., specifies the traded security.
Trade Price, i.e, execution price (in paise, needs conversion to rupees).
Trade Quantity, i.e., number of units traded.
Trade Cancellation Messages -
Trade cancel messages are essential to maintain tick data quality because genuine executions must be adjusted in downstream analysis. These occur when previously reported trades are cancelled or invalidated,
Timestamp, Token, & Price, which are similar to trade messages.
Order IDs are set to zero since cancellation refers to the trade itself.
Spread Order / Spread Trade Messages (for certain segments) -
These are important for traders analysing complex instruments beyond standard equity trades. In segments like commodity derivatives (CD), specialised messages include,
Spread Order Details, which are similar to normal order fields and are applied to spread contracts.
Spread Trade Details, which capture the price and quantity of spread executions.
Contract Master Data -
Without masters, raw tick fields cannot be mapped to meaningful security names or types. To interpret tick messages correctly, applications must load Master Data Files that list details such as -
Token number (unique ID for each contract).
Symbol & Instrument Type (e.g., equity, future, option).
Expiry Date / Strike Price (for derivatives).
Recovery & Heartbeat Messages -
These are special control messages that help with tick data processing and keep feeds robust in case of latency in tick data or packet loss. This includes,
Heartbeat, which confirms the feed is live.
Recovery Responses that help reconnect or recover missed ticks if there’s a data gap.

Tick-by-tick data records every single trade and price change that happens in the market, including price, time, volume, and sometimes bid-ask details. Unlike 1 min 5 min charts, tick data does not group trades together. Each transaction is one ‘tick’. This makes it very powerful, but also very heavy and complex to analyse. It shows the true behaviour of buyers and sellers in real time.
The analysis of tick-by-tick market data is explained below.
Start by Filtering Noise - Raw tick data is extremely noisy. Thousands of trades can happen in seconds, especially in stocks like Reliance, Bank Nifty, or Nifty futures. If you look at raw ticks directly, it will feel chaotic and confusing. The first step is filtering, i.e., grouping ticks into small units like volume bars, time bars (1-second, 5-second), or price movement bars. This makes patterns visible and removes meaningless fluctuations that can distract decision-making.
Focus on Price and Volume Together - Tick data becomes powerful only when price and volume are analysed together. A price move with low volume usually means weak interest, while a price move with heavy volume shows strong buying or selling pressure. For example, if the price is rising but the volume per tick is falling, it may signal exhaustion. If the price breaks a level with strong tick volume, it shows genuine participation and higher reliability.
Identify Order Flow and Market Pressure - Tick data helps you understand who is in control, i.e, buyers or sellers. Continuous aggressive buying at the ask price shows bullish pressure, while repeated selling at the bid shows bearish pressure. This is called order flow analysis. Even for retail traders, simply observing repeated buy ticks or sell ticks near key levels gives insight into whether a breakout is real or fake.
Track Liquidity and Volatility Zones - Tick data shows where the market is active and liquid. Areas with many ticks and high volume are zones of strong interest (support/resistance zones). Areas with low tick activity show a lack of interest and are prone to sudden spikes. Traders use this to avoid entries in low-liquidity zones and focus on high-participation levels where price behaviour is more reliable.
Use Tick Data for Timing, Not Direction Alone - Tick-by-tick analysis is best used for entry and exit timing, not for long-term direction prediction. Direction comes from higher timeframe charts, fundamentals, or macro view. Tick data helps you refine execution by understanding better entry price, better stop placement, and better exit timing. This is especially useful for intraday traders, scalpers, and F&O traders.
Combine Tick Data with Normal Charts - Tick data should never be used alone. The best approach is to combine it with 5-min, 15-min, or daily charts. Higher timeframes give structure and trend, while tick data gives precision. Think of it like a map and a microscope, where charts show the road, and tick data shows the surface details.

Tick-by-tick data is a form of real-time market data that captures every trade, quote change, and transaction as it happens. It includes time and sales data, bid-ask updates, and volume at each price point. While the structure of tick data is similar across markets, its practical use differs because of variations in liquidity, trading hours, participant behaviour, and regulation. This is why tick data for price discovery looks very different in equities, derivatives, currencies, and crypto.
In equity markets, tick-by-tick data is mainly used as intraday market data to understand short-term price movements and liquidity. Traders analyse order flow data to see whether buying or selling pressure is stronger and how prices react to large trades. Comparing Level 1 vs Level 2 data helps traders see not just the last traded price, but also the depth of demand and supply. Tick data for trading strategies such as scalping and momentum trading can improve entry and exit timing. However, long-term investors usually gain limited benefits from tick data analysis and prefer daily or weekly data for decision-making.
In futures and options, tick-by-tick data is a core input for algorithmic trading data and quantitative trading data models. Because derivatives are leveraged instruments, even small price changes matter. Tick data helps traders track rapid changes in volume, aggressive buying or selling, and sudden shifts in sentiment. In highly active contracts like index futures and options, improving trading accuracy with tick data becomes important, especially during expiry sessions or volatile periods. Traders rely heavily on time and sales data and order flow to avoid false breakouts and manage risk better.
Commodity markets react sharply to global news, weather updates, and inventory data. Tick-by-tick data allows traders to observe how prices respond second by second, offering strong benefits of tick-by-tick data during volatile sessions. Order flow and time-based analysis help traders detect unusual activity and manage risk when prices move suddenly. Tick data also improves price discovery, especially when new information enters the market.
Currency markets operate with tight spreads and high liquidity, making tick-by-tick data ideal for studying execution quality and latency in tick data. Traders focus less on big price moves and more on how smoothly trades are executed during fast market conditions. In Indian currency derivatives, tick data supports short-term trading strategies and helps traders avoid poor fills during news events. The advantages of tick data analysis come mainly from better timing rather than long-term trend prediction.
The pros and cons of using tick-by-tick data are highlighted below.

Tick-by-tick data provides the most detailed form of real-time market data, showing every trade and price change as it happens.
It helps traders understand order flow data, making it easier to see whether buyers or sellers are in control.
Tick data improves price discovery by revealing how prices move at the transaction level, not just at candle close.
It supports intraday market data analysis, which is useful for scalping and short-term trading.
Tick-by-tick data improves trading accuracy by allowing more precise entries, exits, and stop-loss placement.
It is essential for algorithmic trading data and quantitative trading data used in automated strategies.
Tick data helps in realistic backtesting, as it captures slippage and execution behaviour more accurately.
Tick-by-tick data generates a very large volume of information, leading to tick data storage issues.
Tick data processing requires advanced software, fast systems, and technical knowledge, which can be costly.
There are common tick data quality issues, such as missing ticks or incorrect timestamps, that can affect analysis.
Latency in tick data can reduce its usefulness, especially for very fast trading strategies.
Tick data contains a lot of short-term noise, which can lead to overtrading and emotional decisions.
Managing and analysing tick data involves the challenge of managing large financial datasets, which is difficult for many retail traders.
Tick-by-tick data may distract long-term investors from focusing on fundamentals and bigger market trends.
The cost of reliable tick data feeds and platforms can be high for individual investors.
Tick-by-tick data breaks down real-time market data in the most detailed formand offers deep insight into price discovery, order flow, and short-term market behaviour. It is especially useful for intraday traders, scalpers, derivatives traders, and those using algorithmic or quantitative trading strategies, as it can improve trading accuracy and execution decisions. Tick data also comes with clear challenges, such as high noise, data quality issues, latency, and the difficulty of storing and processing large financial datasets. Hence, tick-by-tick data should be used selectively and with discipline.
This article focuses on the importance of tick-by-tick data and helping traders implement strategic trading plans through its in-depth understanding. Let us know your thoughts on the topic or if you need further information on the same, and we will address it soon.
Till then, Happy Reading!
Read More: SEBI Norms on Sharing Real-Time Price Data
Marisha Bhatt is a financial content writer @TrueData.
She writes with the sole aim of simplifying complex financial concepts and jargon while attempting to clarify technical and fundamental analysis concepts of the stock markets. The ultimate goal is to spread vital knowledge and benefit the maximum audience. Her Chartered Accountant background acts as the knowledge base to help clarify crucial concepts and create a sound investment portfolio.
Great explanation of tick by tick market data! It’s nice to see detailed coverage on how this data supports intraday and algo strategies. In my experience, combining tick data with higher timeframe charts really improves trade timing and execution quality
Thank you so much for sharing your experience! You are absolutely right! Combining tick-by-tick data with higher timeframe charts can really improve timing and execution, especially for intraday and algo strategies. Keep reading and sharing your thoughts on our other topics too. We are looking forward to hearing from you!
Do you think retail traders still benefit from raw tick data in today’s markets where algo strategies dominate? Curious about your use cases and takeaways!
Retail traders can still benefit from raw tick data to improve entry timing and understand short-term price moves, but it works best when used with a clear strategy and proper risk management. We hope this resolves your query. Stay tuned for more informative content on TrueData!
Tick data is powerful but pricey and heavy, definitely needs the right tools to handle.
Absolutely true! Tick data can be powerful, but it does require the right tools and setup to handle it efficiently and make the most of its value. You can reach us at [email protected] for details on pricing and subscription.
Good Blog. Keep adding More Contents about Trading
Glad you like our work! Stay tuned for more informative trading content on TrueData!
nice post ..
Thank you for appreciating our work, glad you like it!
Great article! Could you also share real use-cases of tick-by-tick data for algorithmic strategies, especially for NIFTY or Bank NIFTY? That would help many intraday traders understand practical benefits
Glad you like our post! Tick-by-tick data can be used in Nifty and Bank Nifty to help algos spot sudden changes in order flow or quick breakouts near support and resistance levels. This can allow faster entries and tighter stop-loss placement for better execution. Hope this resolves your query. Stay tuned for more interesting content on TrueData!
I noticed latency and storage issues mentioned here. can you suggest best practices or tools for managing large tick data sets efficiently?
To manage large tick data efficiently, traders can use fast SSD storage, clean and compress old data regularly, and work with databases or tools designed for high-frequency data instead of simple Excel files. We hope this resolves your query. You can also reach us at [email protected] for more assistance on this topic.
please how tick-by-tick compares with 1-second or 1-minute OHLC data in terms of strategy performance
Tick-by-tick data gives the most precise entries and exits, which can improve performance for very short-term or algo strategies. In contrast, 1-second or 1-minute OHLC data is lighter and works well for most intraday strategies without needing heavy processing. We hope this resolves your query. Stay tuned for more informative content on TrueData!
good info for tick by tick data
Glad you like our work! Keep reading and sharing your thoughts on our other topics too. We are looking forward to hearing more from you!
Is it possible to get tick-by-tick historical data into Excel too, and if so, how does that differ from real-time streaming?
Yes, it’s possible to get tick-by-tick historical data into Excel using a data provider’s export or API feature. Historical data is downloaded as past records for analysis, while real-time streaming updates live as new ticks come in during market hours. We hope this resolves your query. Stay tuned for more interesting content on TrueData!
nice post
Thank you for appreciating our work Ma'am! Glad you like it!
So, have Truedata started providing tick by tick data?
TrueData currently provides tick-per-second data, not a full tick-by-tick (TBT) feed.
Is truedata good for HFT (high-frequency trading) and Latency arbitrage
Thank you for your query! TrueData is not specifically designed for high-frequency trading (HFT) or latency arbitrage, as these strategies require tick-by-tick (TBT) data directly from the exchange along with server co-location within exchange data centers to achieve ultra-low latency. Since such infrastructure and direct exchange-level access are essential for HFT environments, data vendors like TrueData may not meet these stringent latency requirements. However, our data solutions are well-suited for algorithmic trading, backtesting, and medium-frequency strategies. Please feel free to reach out if you need assistance in choosing the right solution for your use case.
The blog explains tick-by-tick data as capturing “every single trade and price change in real time” , but in practical usage, many retail data vendors provide slightly aggregated feeds (like 1-second data instead of true exchange-level ticks). So how should traders clearly differentiate between: True exchange TBT (every order/trade event) vs Vendor-provided “tick” data (possibly aggregated) It would be helpful if you could clarify this in future posts, especially for traders building order-flow or high-frequency strategies. Overall, great content and very informative
In practice, traders should clearly differentiate between true exchange-level TBT (tick-by-tick) data and vendor-provided “tick” data based on how the data is sourced and transmitted. True TBT data captures every individual market event, each trade, order update, bid/ask change, exactly as it occurs on the exchange, with no aggregation. This is typically available only via direct exchange feeds or institutional-grade infrastructure. In contrast, many vendor-provided “tick” feeds may aggregate events over very small time intervals (e.g., milliseconds or 1-second buckets) or batch updates to optimize bandwidth and delivery, which can result in slight loss of granularity. A practical way to differentiate is to look at factors like event frequency, timestamp precision, presence of order book depth updates, and whether multiple trades share identical timestamps, these can indicate aggregation. For most retail and even many professional strategies, vendor-level tick data is sufficient, but for order-flow analysis or latency-sensitive strategies, true exchange-level TBT becomes much more critical. We appreciate the suggestion and will definitely consider covering this topic in more detail in a future post.
Data accuracy and execution timing were especially useful.
Thank you for your feedback! We are glad you found the sections on data accuracy and execution timing useful. These are important factors when working with tick-by-tick data, as they can significantly impact trading analysis and decision-making.
Well explained, TrueData! I particularly liked the comparison between tick data and OHLC data. It clearly shows why detailed market data matters for precise trade execution.
Thank you so much for your thoughtful feedback! We are delighted you found the comparison between tick-by-tick data and OHLC data helpful. Understanding the differences between them can help traders choose the right data for analysis, strategy development, and more informed trading decisions.
latency and execution quality especially useful. It shows why high-frequency and algorithmic traders rely so heavily on granular market data.
Thank you for your valuable feedback! We're glad you found the discussion on latency and execution quality useful. Granular market data is indeed a key advantage for high-frequency and algorithmic trading, enabling faster decision-making, more precise execution, and better strategy performance. We appreciate you taking the time to share your thoughts!
nice post. order flow analysis clearly shows why tick-by-tick data is valuable for intraday and algorithmic traders.
Thank you for your kind words! We're glad you found the post insightful. You're absolutely right. Order flow analysis becomes far more effective with tick-by-tick data, as it provides a detailed view of market activity that's especially valuable for intraday and algorithmic trading strategies. We appreciate your feedback!
Introduction Real-time market data from NSE, BSE, and MCX is distributed as 4 d...

Thestock market never stands still, and prices swing constantly with every new h...
Market data is the backbone ofsuccessful trading, but not all market data is the...