Technical analysis has evolved with a wide range of modern indicators and charting tools, but some classics continue to remain relevant. Point and Figure (P&F) charts are one such time-tested tool that focuses on price movements while filtering out unnecessary market noise. But how does a P&F chart work, and how can traders use it to identify trends, breakouts and potential trading opportunities? Explore our blog to understand the Point and Figure Chart in Trading and learn how to use this classic charting technique in your trading strategy.

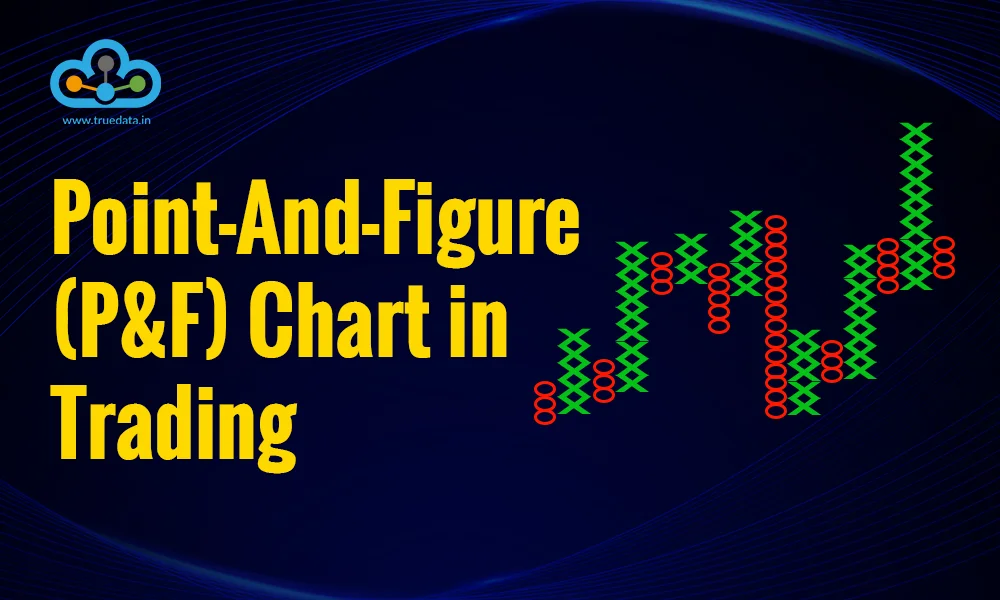
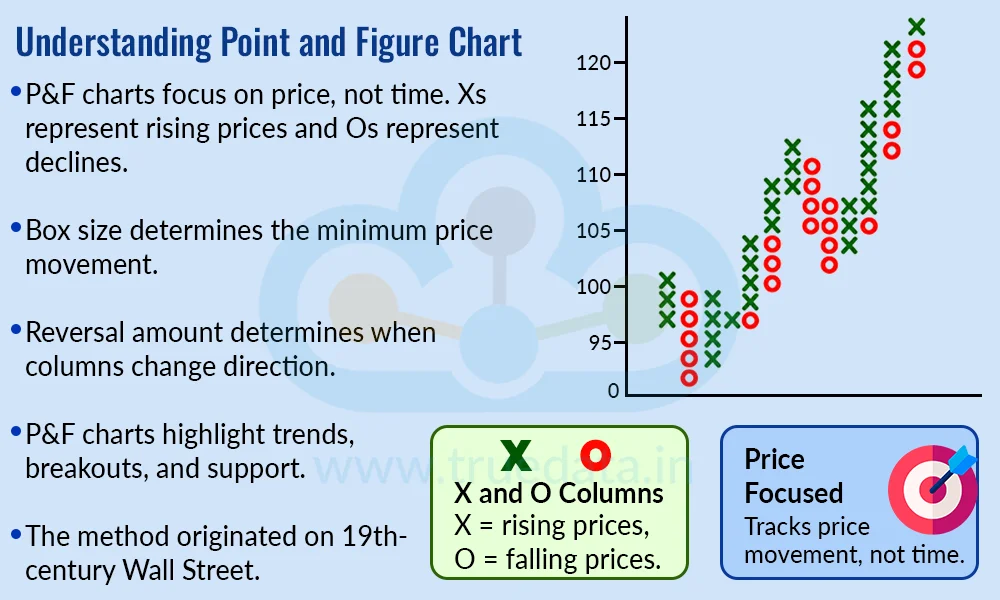
A Point and Figure (P&F) chart is a type of technical chart that focuses only on price movements and ignores the element of time. Unlike traditional candlestick charts, where each candle represents a fixed period such as a minute, hour or day, a P&F chart records price movements using X and O columns. Xs represent rising prices, while Os represent falling prices. The chart changes only when the price moves by a specified amount, known as the box size, and a new column is created when the price reverses by a specified number of boxes, known as the reversal amount. By filtering out smaller price movements, P&F charts can help traders focus on broader trends, support and resistance levels, and potential breakouts.
Point and Figure (P&F) charting originated on 19th-century Wall Street, when traders needed a simple way to record stock price movements before computers and modern charting software. Early versions, known as ‘Figure Charts’, recorded price changes using numbers in columns, with one of the earliest documented references appearing in 1898 in The Game in Wall Street and How to Successfully Play It, written under the name ‘Hoyle’. Traders later began using Xs instead of numbers, giving rise to ‘Point Charts’, and the terms ‘point’ and ‘figure’ eventually came together to form Point and Figure charts. The method was further developed in the 20th century, with Victor De Villiers publishing a dedicated book on P&F charting in 1933 and A.W. Cohen helping popularise the modern three-box reversal method and the use of Xs for rising prices and Os for falling prices. As these charts could be maintained with simple pencil, paper and price data, they became a practical way for traders to study significant price movements without the need for time-based charts or computers.
Constructing a Point and Figure (P&F) chart is different from creating a regular candlestick chart because it does not plot every price movement against a specific time period. Instead, it records price changes that meet predefined conditions. The general guidelines for constructing the point and figure charts are explained below.

Select the asset - The trader first selects the stock, index, currency, commodity or other financial instrument to be analysed.
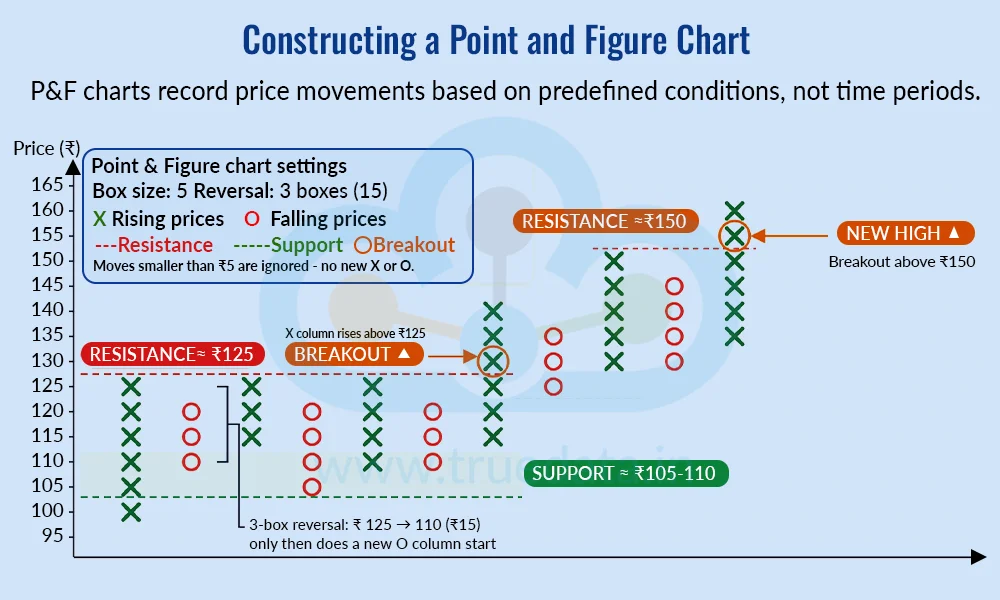
Choose the box size - The trader decides the minimum price movement that will be represented on the chart. For example, with a Rs. 5 box size, every qualifying Rs. 5 price movement is represented by one box. So, if a stock moves from Rs. 100 to Rs. 105, one X may be added to the chart. If it moves to Rs. 110, another X can be added. The box size should be selected according to the price and volatility of the instrument and the trader's analysis objective.
Set the reversal amount - The trader then decides how much the price must move in the opposite direction before a new column is created. A commonly used setting is a 3-box reversal. With a Rs. 5 box size, this would require a Rs. 15 reversal. So, if the current X column has moved up to Rs. 125, the price would generally need to fall to Rs. 110 before a new O column is started.
Mark rising prices with Xs - When the price rises by the required box size, an X is added to the chart. Additional Xs are added to the same column as the price continues to rise.
Mark falling prices with Os - When the price falls by the required box size, an O is added. Additional Os are added to the same column as the price continues to decline.
Create a new column after a reversal - A new column is not created as soon as the price changes direction. The price must first move by the selected reversal amount. Once this condition is met, a new column is started using the opposite symbol.
Ignore smaller price movements - Price changes smaller than the selected box size generally do not result in a new X or O. This helps filter out minor price fluctuations and market noise.
Continue adding X and O columns - The process continues as the price moves up and down. Unlike a candlestick chart, a new column is not created simply because a new trading day or hour has started. The columns are created based on price movements and the selected reversal setting.
Analyse the chart - Once the P&F chart is constructed, traders can study the X and O formations to identify trends, support and resistance levels, breakouts and breakdowns. These observations can be combined with other technical analysis tools when evaluating trading opportunities.
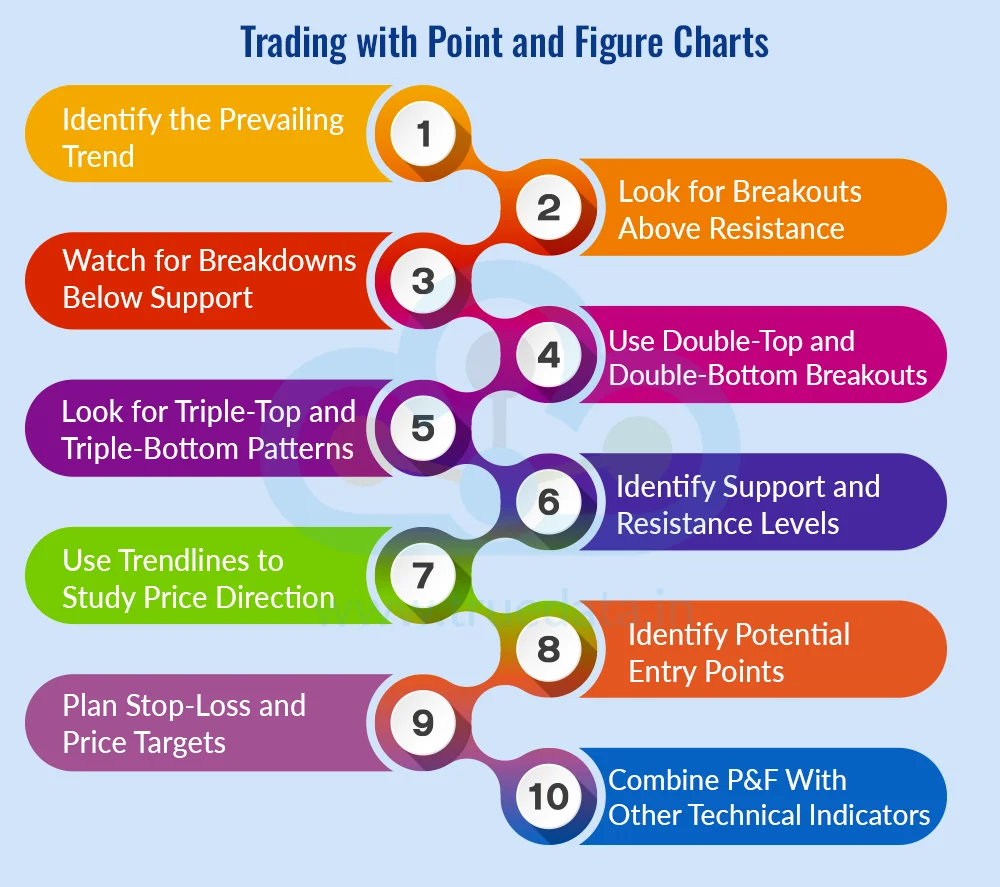
Point and Figure (P&F) charts can help traders focus on significant price movements by filtering out smaller fluctuations. Traders can use the chart along with other technical analysis tools to study trends, breakouts and potential entry or exit levels. Some common ways to use P&F charts include,

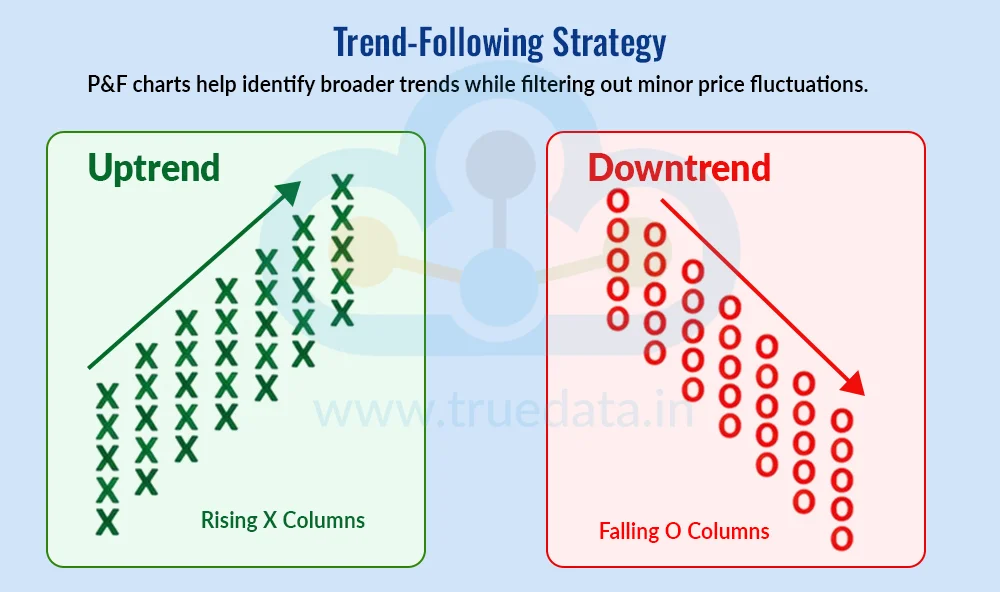
Identify the Prevailing Trend - The first step is to identify the overall direction of the price. Traders can study the arrangement of X and O columns to understand whether the stock is generally moving upwards, downwards or sideways. A sequence of rising X columns and higher price levels may indicate an upward trend, while falling O columns and lower price levels may indicate a downward trend. Identifying the broader trend can help traders avoid taking positions that go strongly against the prevailing price direction.
Look for Breakouts Above Resistance - A P&F chart can help traders identify potential breakouts above resistance. Resistance is a price level where the stock has previously struggled to move higher. If an X column moves above the top of an earlier X column, it may indicate that the stock has broken through that resistance level. For example, if a stock repeatedly faces resistance around Rs. 500 and a new X column rises above Rs. 500, traders may watch the movement for confirmation. Volume, market conditions and other technical indicators can be considered before entering a trade.
Watch for Breakdowns Below Support - Traders can also use P&F charts to identify potential breakdowns below support. Support is a level where buying interest has previously prevented the price from falling further. If an O column moves below the bottom of a previous O column, it may indicate increasing selling pressure. For example, if a stock has repeatedly found support around Rs. 400 and a new O column falls below this level, traders may view it as a potential bearish signal. However, a breakdown does not guarantee that the price will continue falling, so traders may look for additional confirmation.
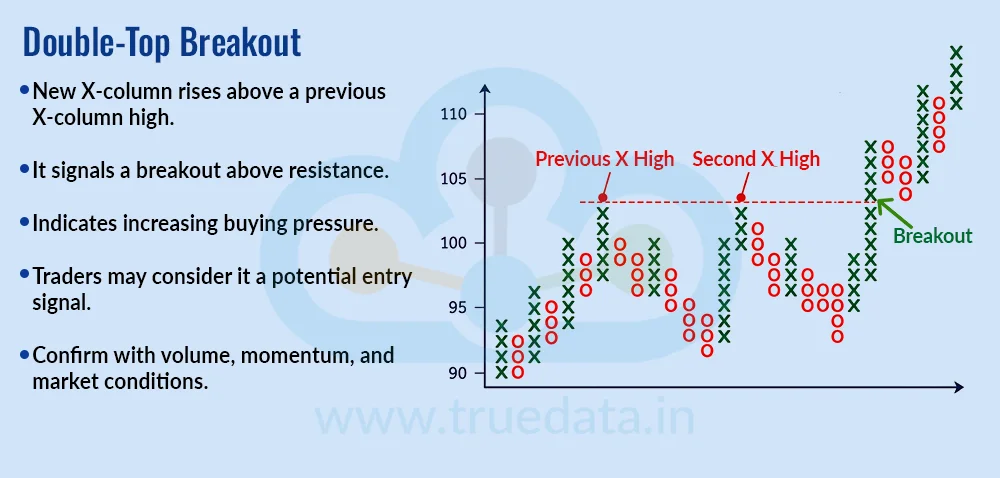
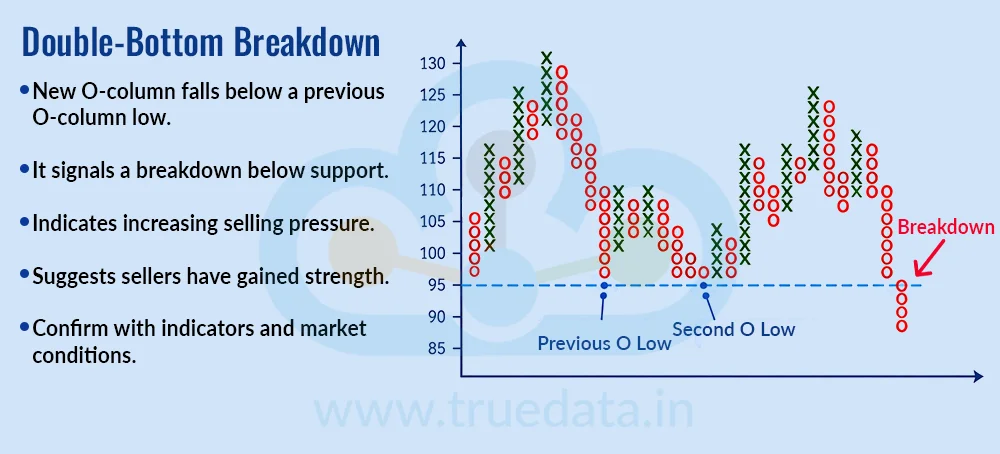
Use Double-Top and Double-Bottom Breakouts - Double-top and double-bottom patterns are commonly associated with P&F charts. A double-top breakout occurs when an X column rises above the high reached by a previous X column. This can indicate that buyers have pushed the price beyond an earlier resistance level. A double-bottom breakdown works in the opposite way, where an O column falls below the low of a previous O column, suggesting increased selling pressure. Traders can use these patterns to identify potential changes or continuation in price direction, while considering other market information before taking a position.
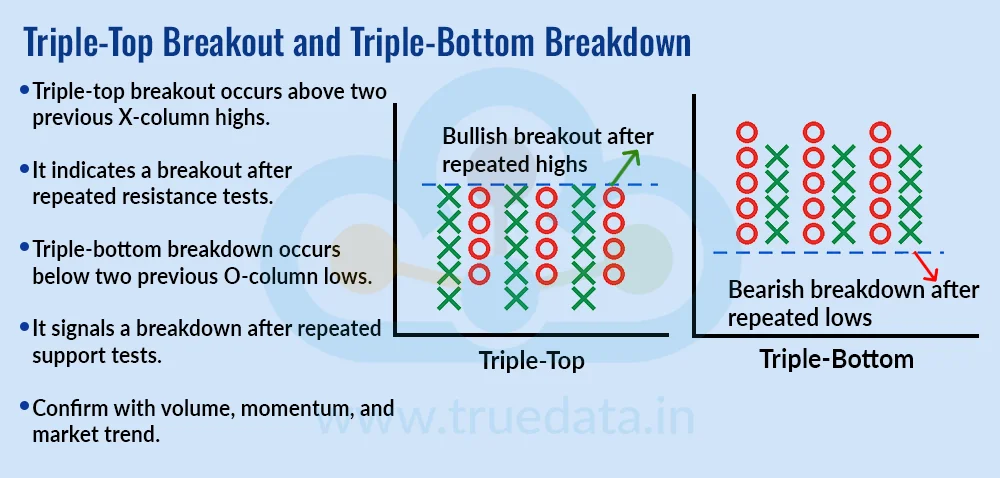
Look for Triple-Top and Triple-Bottom Patterns - Traders can also watch for triple-top and triple-bottom formations. A triple-top setup generally develops when the price tests a similar high several times before an X column eventually moves above that level. A triple-bottom setup develops when the price tests a similar low multiple times before an O column moves below it. Repeated tests of the same level can make these areas important to watch. However, traders should remember that even well-defined chart patterns can produce false signals.
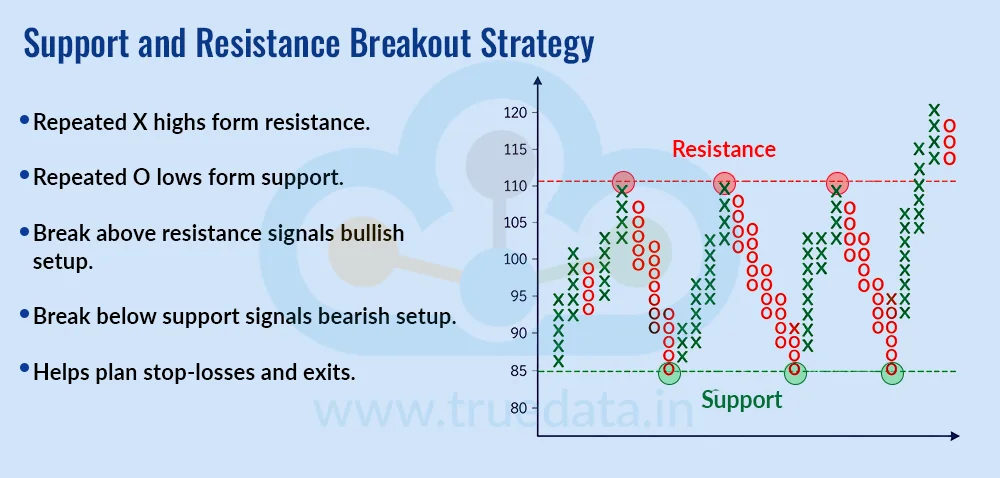
Identify Support and Resistance Levels - P&F charts can make certain support and resistance levels easier to observe because the chart focuses on significant price movements. Repeated highs in X columns may indicate a resistance zone, while repeated lows in O columns may indicate a support zone. Traders can use these levels when planning potential entry points, stop-losses and profit-taking levels. It is generally useful to consider these levels as zones rather than assuming that a stock will always reverse at one exact price.
Use Trendlines to Study Price Direction - Trendlines can also be used with P&F charts to understand the broader direction of price movement. An upward trendline can help traders track a rising trend, while a downward trendline can highlight a falling trend. If the price moves through an important trendline, traders may reassess whether the existing trend is weakening or changing. Trendlines should preferably be considered along with the overall X and O pattern rather than being used as a standalone trading signal.
Identify Potential Entry Points - Once a trader identifies a potential setup, the P&F chart can help determine a possible entry point. For example, a trader may consider an entry after a confirmed breakout from a resistance level or a double-top pattern. Another trader may wait for additional confirmation from volume or a momentum indicator before entering. The exact approach depends on the trading strategy, timeframe, risk tolerance and instrument being traded. The key is to define the conditions for entering a trade before taking the position.
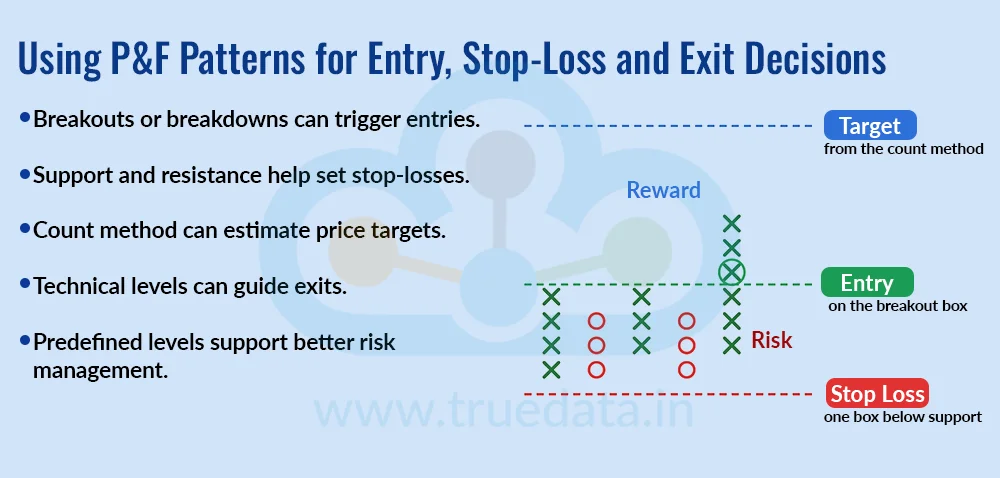
Plan Stop-Loss and Price Targets - Traders can use P&F charts to plan stop-loss levels and estimate potential price targets. A stop-loss may be placed near relevant support or resistance while considering the stock’s volatility, whereas the P&F count method can help estimate a potential price objective based on the pattern width, box size and reversal setting. These levels are only guides and should be considered along with market conditions and the trader’s risk-reward approach.
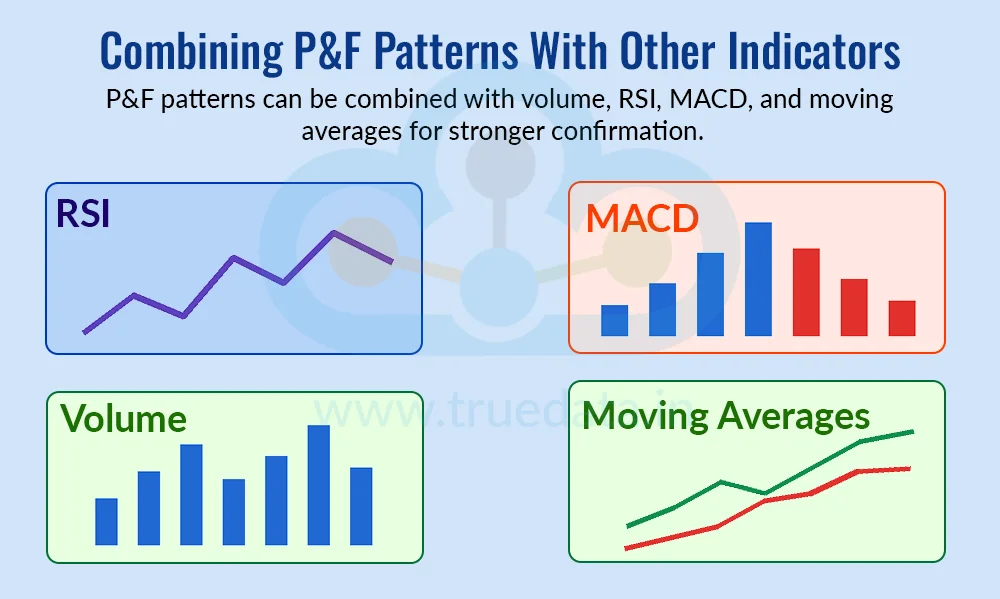
Combine P&F With Other Technical Indicators - P&F charts do not have to be used in isolation. Traders can combine them with other tools such as moving averages, RSI, MACD and volume to get additional information. For example, a trader may look for a P&F breakout while also checking whether trading volume is supportive and whether momentum indicators show strength. Using multiple tools can provide additional context, although adding more indicators does not automatically make a trading signal more reliable.
Point and Figure (P&F) chart patterns are formations created by the movement of X and O columns on a P&F chart. Since these charts focus on significant price movements rather than time, traders can use them to study buying and selling pressure, trends, breakouts, breakdowns and potential reversals. These patterns can also form the basis of different P&F trading strategies. The most commonly used patterns and strategies are explained below.

A double-top breakout is one of the basic bullish patterns in Point and Figure charting. It occurs when a new X column rises above the high reached by a previous X column. For example, if an earlier X column reaches Rs. 500 and a later X column moves above Rs. 500, the move creates a double-top breakout. This suggests that buyers have pushed the price above an earlier resistance level and may indicate increasing buying pressure. Traders may use this as a potential entry signal, while checking volume, momentum and broader market conditions for additional confirmation.

A double-bottom breakdown is the bearish counterpart of a double-top breakout. It occurs when a new O column falls below the low of a previous O column. For example, if a stock previously found support around Rs. 400 and a later O column falls below Rs. 400, it creates a double-bottom breakdown. This may indicate that sellers have gained strength and that the earlier support level has been breached. Traders can monitor such a setup for a potential bearish trade, while considering confirmation from other technical indicators and market conditions.

Triple-top and triple-bottom formations involve repeated tests of similar resistance or support levels. A triple-top breakout occurs when an X column eventually moves above the highs of two previous X columns, showing that the price has broken through a level that was tested multiple times. A triple-bottom breakdown occurs when an O column moves below the lows of two previous O columns. These formations can be used as breakout and breakdown strategies, with traders often looking at volume, momentum and the broader market trend before acting on the signal.

P&F charts can be used to follow the broader price trend without giving as much importance to smaller fluctuations. A sequence of rising X columns and higher highs can indicate an upward trend, while falling O columns and lower lows can indicate a downward trend. Traders following this strategy generally look for bullish setups when the broader trend is upward and bearish setups when the broader trend is downward. This approach can help traders avoid reacting to every minor price movement.

P&F charts can make important support and resistance levels easier to identify. Repeated highs in X columns may create a resistance area, while repeated lows in O columns may form a support area. Traders can wait for the price to move beyond these levels before considering a trade. An X column moving above resistance can provide a potential bullish setup, while an O column falling below support can provide a potential bearish setup. These levels can also be used when planning stop-losses and exits.

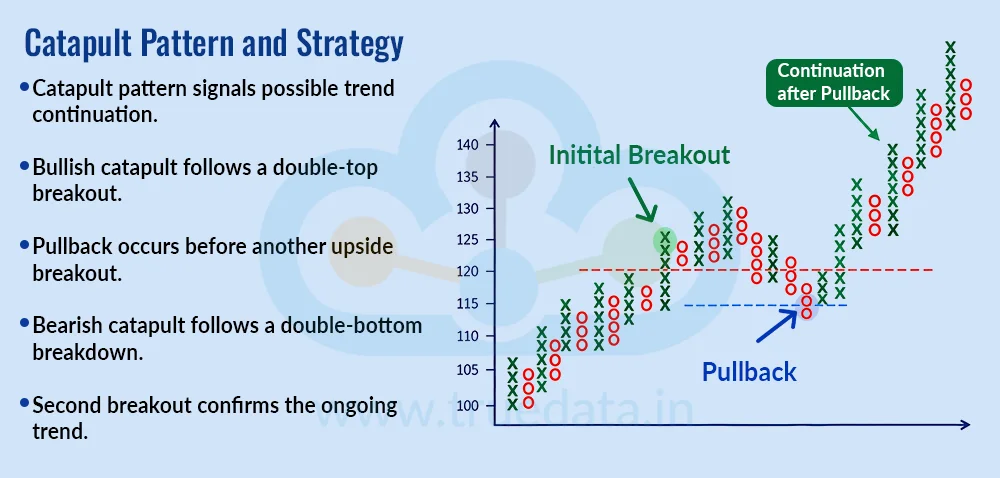
The catapult is a more complex P&F pattern that can indicate continuation of an existing price move. A bullish catapult generally develops after a double-top breakout, followed by a pullback and another breakout above a previous high. A bearish catapult works in the opposite direction, where a double-bottom breakdown is followed by a recovery and then another breakdown. The pattern is based on the idea that the initial trend remains intact despite a temporary move in the opposite direction. Traders can use the second breakout or breakdown as a potential confirmation of the trend continuation.

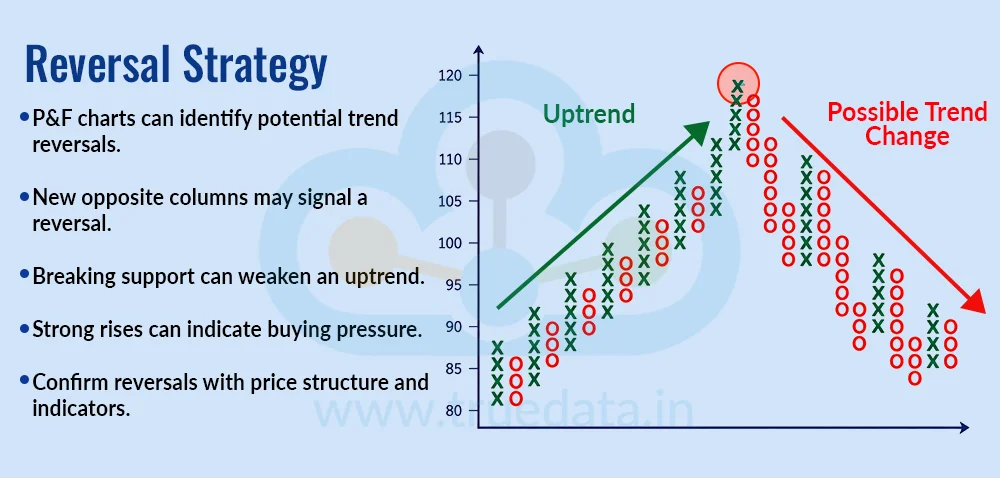
P&F charts can also be used to identify potential trend reversals. A reversal occurs when price movement becomes strong enough to create a new column in the opposite direction and potentially break an important previous level. For example, after a prolonged series of X columns, a significant decline can create a new O column and break support, suggesting that the earlier upward trend may be weakening. Similarly, a strong rise after a series of O columns may indicate increasing buying pressure. Traders should distinguish between a temporary pullback and a genuine trend reversal by considering the surrounding price structure and other indicators.

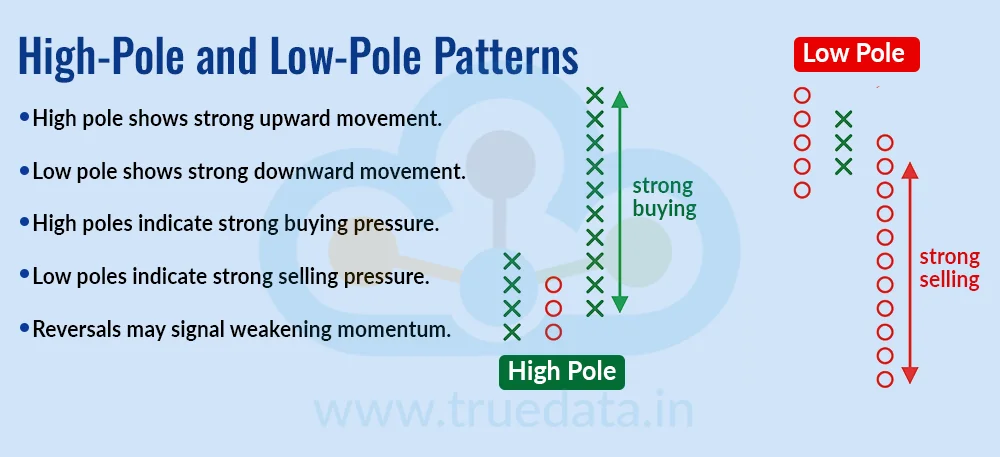
A high-pole pattern represents a strong upward movement, shown by a relatively tall column of Xs, while a low-pole pattern represents a strong downward movement through a tall column of Os. These formations can help traders identify periods of strong buying or selling pressure. A high pole followed by a significant reversal may indicate that the earlier upward move is losing momentum, while a low pole followed by a strong recovery may suggest that selling pressure is weakening. Traders can use these patterns as part of a broader assessment rather than treating them as standalone signals.

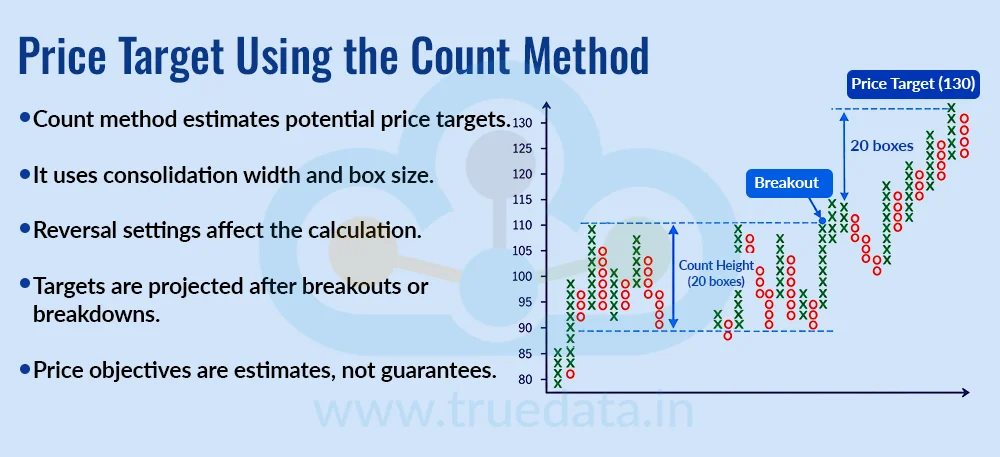
One distinctive feature of P&F analysis is the use of the count method to estimate potential price targets. The method considers the width of a significant consolidation or congestion area along with the chart's box size and reversal setting. Depending on whether the setup is bullish or bearish, the resulting count is projected upward or downward from a relevant breakout or breakdown level. The count method provides an estimated price objective, not a guaranteed target. Traders can therefore use it alongside support and resistance, risk-reward considerations and other forms of analysis.

P&F patterns do not necessarily have to be used on their own. Traders can combine them with moving averages, RSI, MACD, trading volume and other technical tools to obtain additional context. For example, a trader may identify a double-top breakout on a P&F chart and then check whether volume has increased and momentum indicators support the upward move. Similarly, a breakdown below support can be examined alongside market and sector trends before a bearish position is considered.

Once a P&F setup has been identified, traders can use the chart to structure the trade. A breakout or breakdown can serve as a potential entry trigger, depending on the trading strategy. Relevant support and resistance levels can help determine a stop-loss, while the count method or nearby technical levels can help establish a potential price target or exit level. Defining these levels before entering a trade can help traders maintain a clear risk-management plan instead of making decisions purely on short-term price movements.
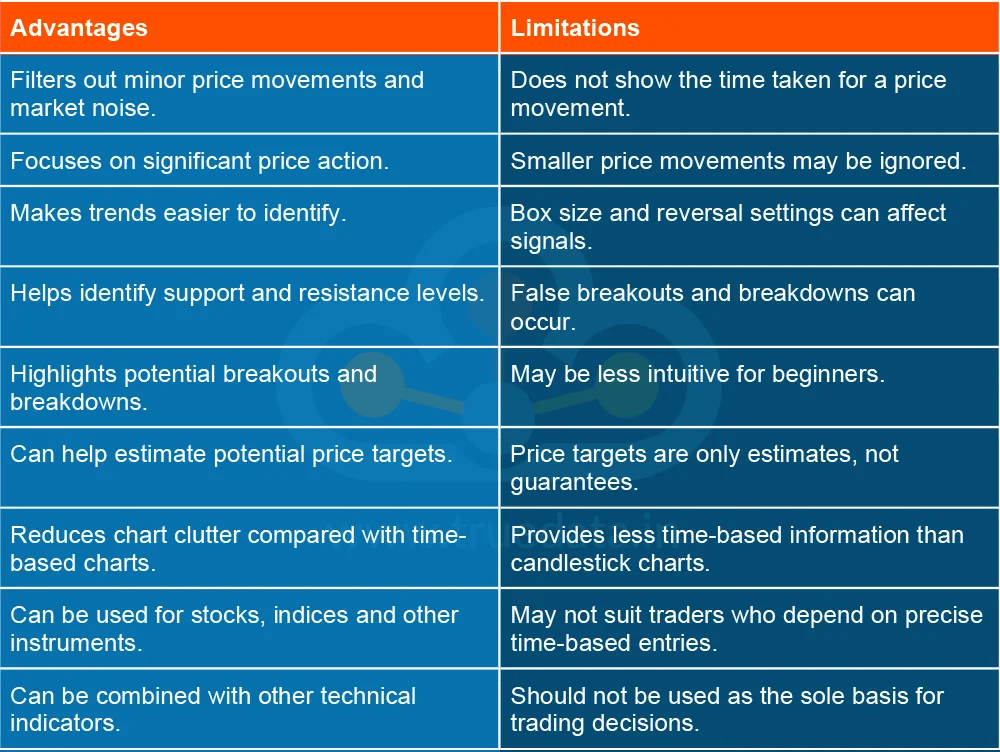
Point and Figure (P&F) charts offer a different way to study price movements because they focus on price rather than time. However, like any technical analysis tool, they have both benefits and limitations.

Point and Figure charts offer traders a simple, price-focused way to study market movements by filtering out smaller fluctuations and focusing on significant trends, breakouts and reversals. Traders in India can use P&F charts to analyse stocks, indices and other instruments and identify potential support, resistance and trading opportunities. However, the choice of box size and reversal setting can affect the signals, so P&F analysis is best used along with other technical tools and proper risk management rather than as a standalone trading method.
This article explains a traditional yet important chart pattern in trading and its nuances. Let us know your thoughts on the topic or if you need further information, and we will address it soon.
Till then, Happy Reading!
Read More: Ichimoku Charts - What Is the Ichimoku Cloud Technical Analysis Indicator
Interpreting market movements is at the heart oftechnical analysis. Traders ofte...
Have you ever wondered how experienced traders can quickly tell whether a stock ...
If you are a trader, then you would have definitely heard the term Fibonacci ret...