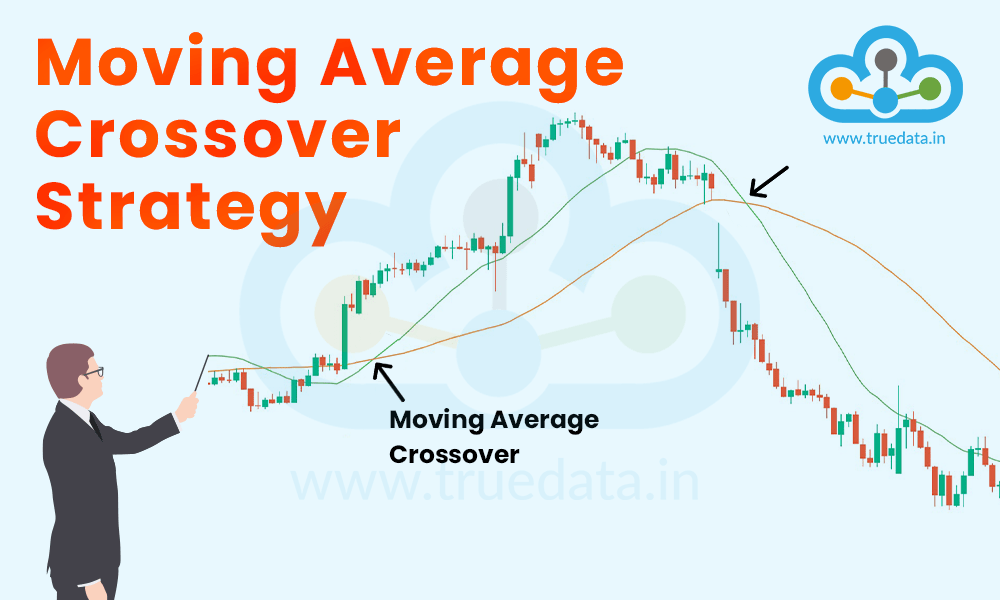
Technical analysis in stock markets is like playing a complex game with many rules. However, the bottom line is analysing the price and volume patterns. While there are many resources used to analyse them, here we will talk about the moving average crossover strategy. So, have you heard about this strategy and used it? Check out this blog to learn all about the moving average crossover strategy and how to use it effectively for trading.
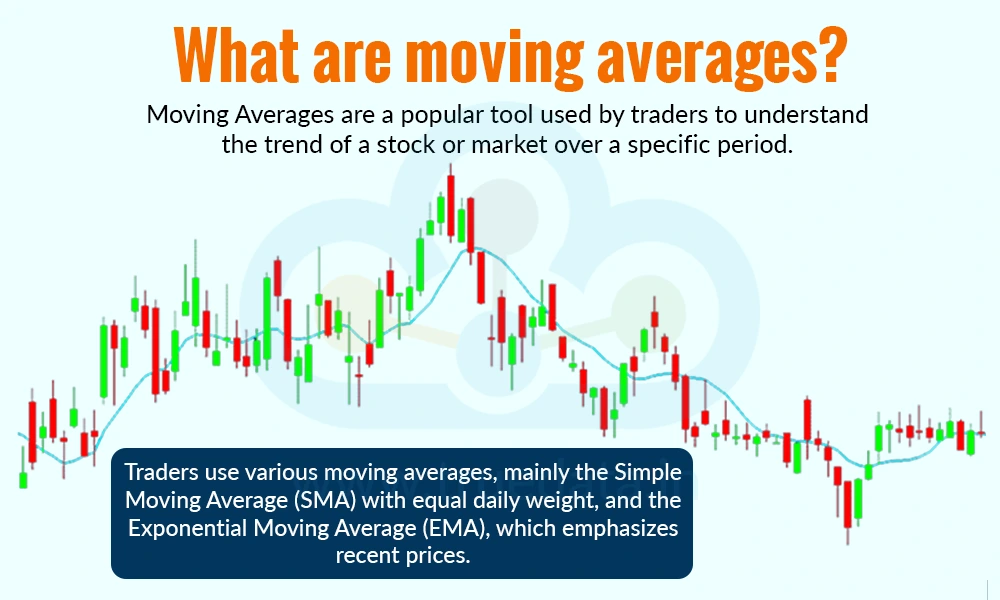
Moving averages are a popular tool used by traders to understand the trend of a stock or market over a specific period. In simple terms, a moving average takes the average price of a stock over a number of days and ‘smooths’ out the daily ups and downs to give a clearer picture of the overall direction. For example, if you use a 20-day moving average, it will calculate the average closing price of a stock for the last 20 days and update this average each day. This helps traders see whether the price is generally going up, going down, or staying flat. There are many types of moving averages used by traders. However, the most common types include the Simple Moving Average (SMA), which gives equal weight to each day, and the Exponential Moving Average (EMA), which gives more importance to recent prices. Traders use moving averages to decide when to buy or sell, often watching for points where the price crosses above or below the moving average line as signals for entry or exit.
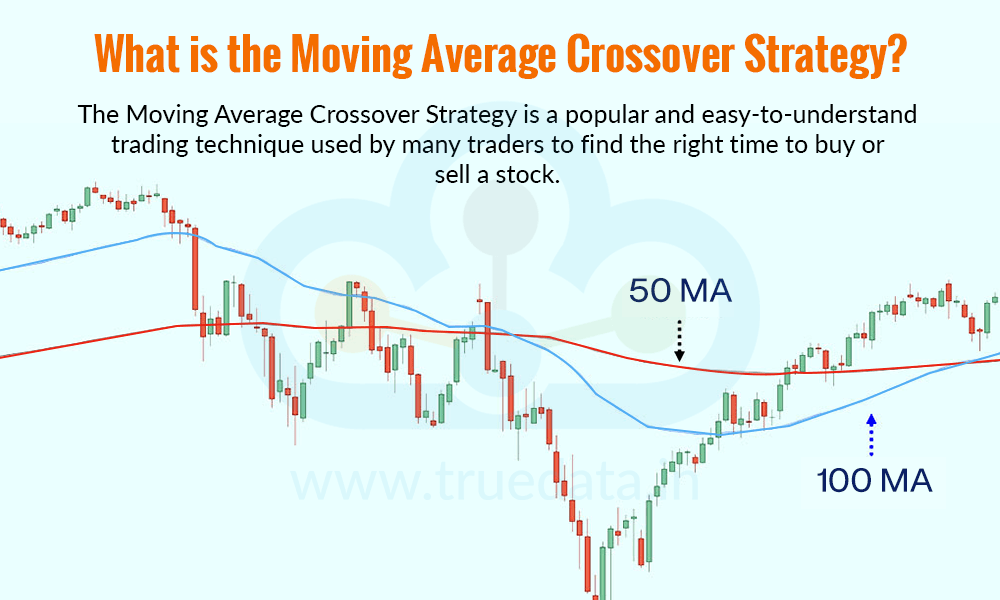
The Moving Average Crossover Strategy is a popular and easy-to-understand trading technique used by many traders to find the right time to buy or sell a stock. It works by using two moving averages, i.e., one short-term (like 10 or 20 days) and one long-term (like 50 or 100 days). When the short-term average crosses above the long-term average, it is called a bullish crossover or golden cross, and it may be a signal to buy, as the price could be starting a new uptrend. When the short-term average crosses below the long-term average, it is called a bearish crossover or death cross, and it may be a sign to sell or avoid the stock, as the price might be starting to fall. This strategy is important because it helps traders make decisions based on trends instead of emotions or guesswork. It is widely used for trading stocks, indices, and even commodities like gold, helping traders manage risk and improve their chances of success.
There are many types of moving average crossover strategies that help traders understand the market movements and make strategic decisions. Some of these moving average crossover strategies are explained hereunder.
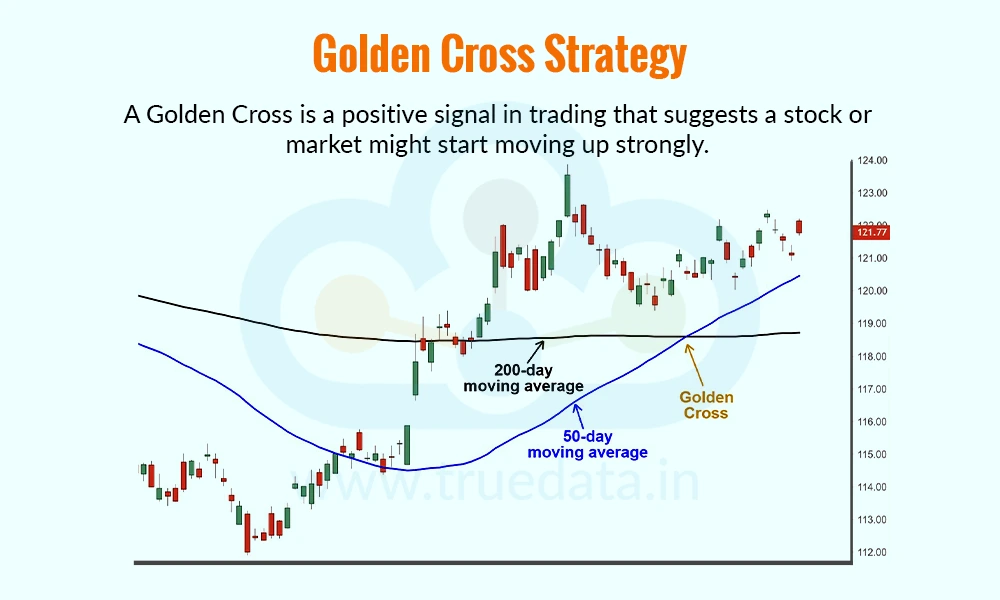
A Golden Cross is a positive signal in trading that suggests a stock or market might start moving up strongly. It happens when the 50-day moving average (which shows the average price over the last 50 days) goes above the 200-day moving average (which shows the average price over the last 200 days). This means recent prices are improving and gaining strength compared to the longer-term trend. A Golden Cross is considered a strong buy signal for traders, especially in well-known stocks or indices like the Nifty 50. It helps traders spot long-term investment opportunities, as it often indicates the beginning of a new upward trend. Many traders and investors use this signal to build or increase their positions in large-cap stocks when the market shows signs of recovery or growth.
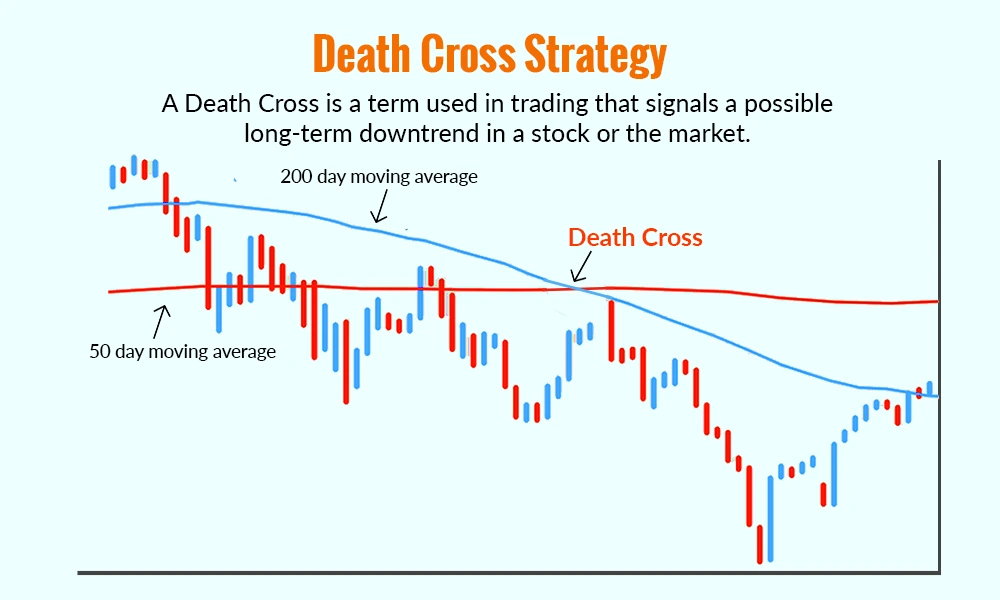
A Death Cross is a term used in trading that signals a possible long-term downtrend in a stock or the market. It happens when the 50-day moving average (which shows the average price over the last 50 days) falls below the 200-day moving average (which shows the average price over the last 200 days). This crossover suggests that recent prices are getting weaker compared to the longer trend, which can be a warning that the stock might continue to fall. This is seen as a sell signal by traders, i.e., a time to consider exiting positions or booking profits to avoid larger losses. It helps protect investments when the market shows signs of weakness. Many traders use this signal along with other tools to make smarter decisions.
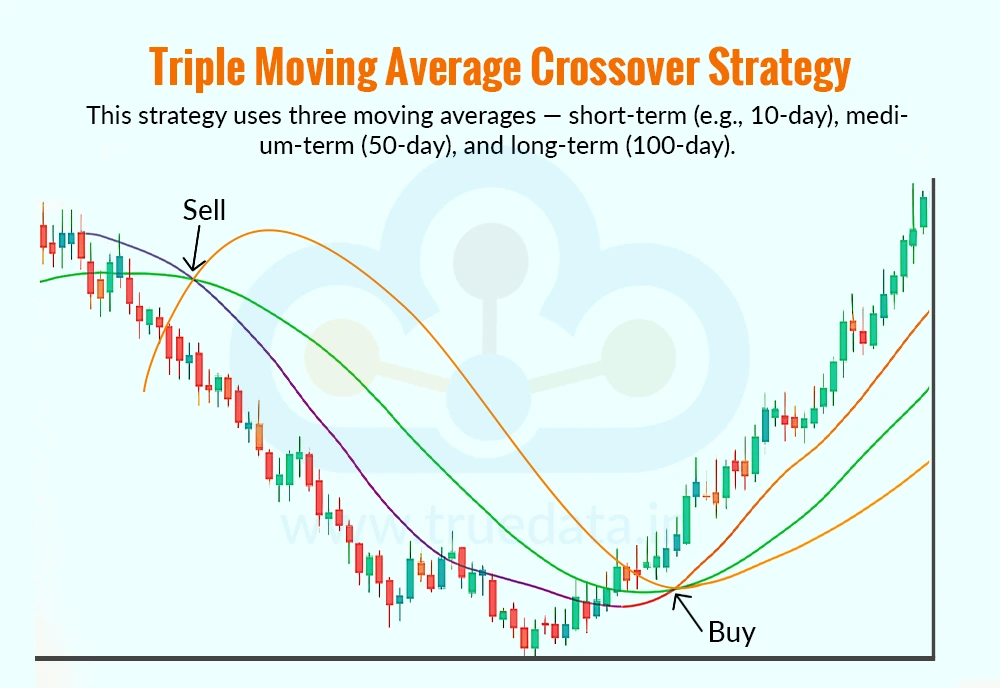
This is a slightly more advanced strategy that uses three different moving averages, i.e, usually a short-term, medium-term, and long-term moving average. A common setup could be the 10-day, 50-day, and 100-day moving averages.
A buy signal happens when the short-term average is above the medium-term, and both are above the long-term. This confirms that the trend is strong and all timeframes are aligned in the upward direction.
A sell signal is generated when the short-term average is below the medium-term, and both are below the long-term. This shows a strong downtrend.
This strategy gives stronger confirmation and reduces false signals. It is useful for position traders who hold trades for a few weeks or months and want more reliable trend confirmation before making big decisions.
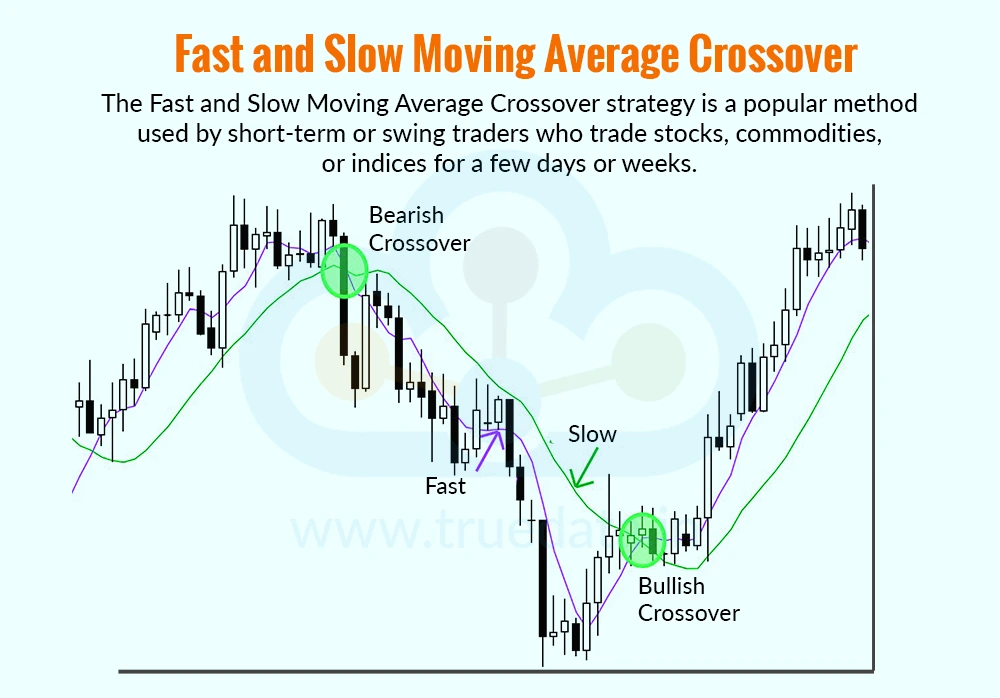
The Fast and Slow Moving Average Crossover strategy is a popular method used by short-term or swing traders who trade stocks, commodities, or indices for a few days or weeks. In this strategy, traders use two types of Exponential Moving Averages (EMAs), i.e., a fast-moving average like the 9-day EMA and a slow-moving average like the 21-day EMA.
A buy signal is generated when the fast-moving average (shorter period) crosses above the slow-moving average (longer period). This shows that prices are picking up speed and may continue to rise.
A sell signal occurs when the fast-moving average crosses below the slow-moving average. This suggests a slowing or reversal of the upward trend.
This crossover strategy reacts faster to price changes compared to the Golden Cross or Death Cross, making it ideal for active traders who want to take advantage of quick price movements.
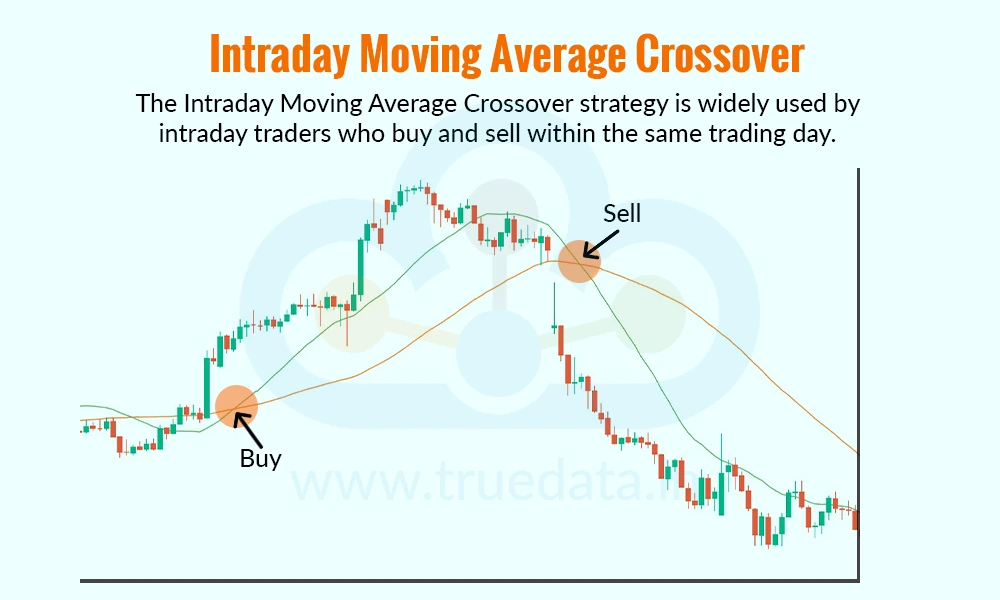
The Intraday Moving Average Crossover strategy is widely used by intraday traders who buy and sell within the same trading day. This method uses short time frames like 5-minute, 15-minute, or 30-minute charts to catch quick price movements. For example, if the 5-minute moving average goes above the 15-minute moving average, it can be a signal to buy, as prices may rise in the short term. If the 5-minute average falls below the 15-minute average, it may be a signal to sell or exit the trade to avoid losses. This strategy works well for fast-moving instruments like stocks, Nifty options, or Bank Nifty, where prices can change quickly within minutes. Intraday crossover strategies help traders take advantage of small price swings, but they require quick decisions, real-time data, and strict risk management to avoid big losses.
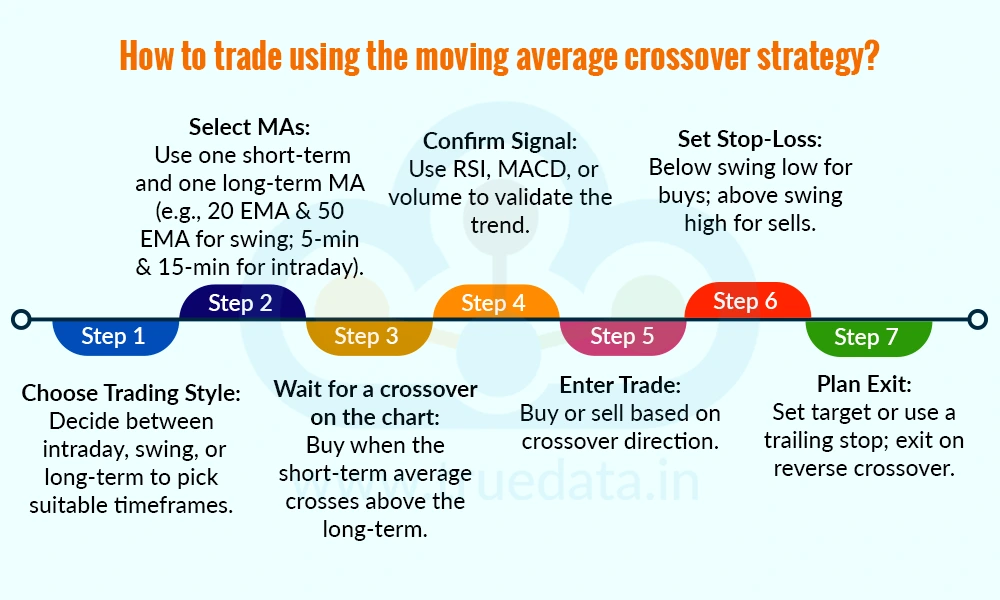
The steps to trade using the moving average crossover strategy are,
Determine the trading style or trading approach (whether they want to do intraday trading or short-term, swing trading or medium-term, or long-term investing) to select the correct time frame for the moving averages.
Choose two moving averages, namely, one short-term and one long-term. For example, a 20-day EMA and a 50-day EMA can be used for swing trading. Intraday traders might use a 5-minute EMA and a 15-minute EMA.
Watch the chart and wait for a crossover to happen.
A buy signal happens when the short-term moving average crosses above the long-term moving average.
A sell signal happens when the short-term moving average crosses below the long-term moving average.
Confirm the trend using other indicators like RSI, MACD, to avoid false signals or check if the volume is increasing during the crossover.
Once the confirmation signal is received, place a buy or sell order based on the direction of the crossover. Enter a long position for a buy signal, and for a sell signal, consider exiting or shorting the stock.
Always set a stop-loss to protect your capital. Place the stop loss just below the recent swing low for a buy trade, while for the sell trade, place it just above the recent swing high.
Decide your target price or use a trailing stop-loss to lock in profits as the price moves in your favour, and also exit the trade if the moving averages give a reverse crossover signal.
After understanding the meaning and importance of the moving average crossover strategy, let us now focus on the pros and cons of using the same. This will help traders use the strategy effectively and make informed portfolio decisions.
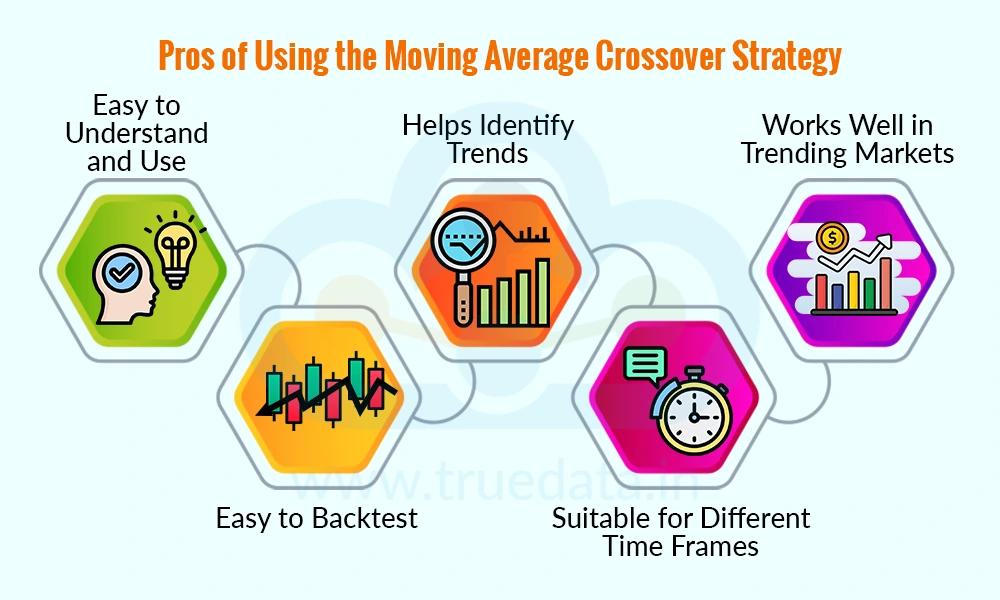
Some of the benefits of using the moving average crossover strategy are,
Easy to Understand and Use - The strategy is simple, even for beginners. Traders just need to look at when one moving average crosses another to get a clear buy or sell signal, and there is no need for complex calculations.
Helps Identify Trends - This strategy helps traders spot the start of a new trend. It can show when a stock or index is likely to move up or down, allowing traders to ride big moves in the market.
Works Well in Trending Markets - The crossover strategy works best when the market is moving strongly in one direction (up or down), like during a bull run or a market correction.
Easy to Backtest - Traders can easily test this strategy using historical charts to see how it would have performed in the past. This helps build confidence before using real money.
Suitable for Different Time Frames - Whether someone is an intraday trader, a swing trader, or a long-term investor, they can adjust the moving average periods to match their trading style.
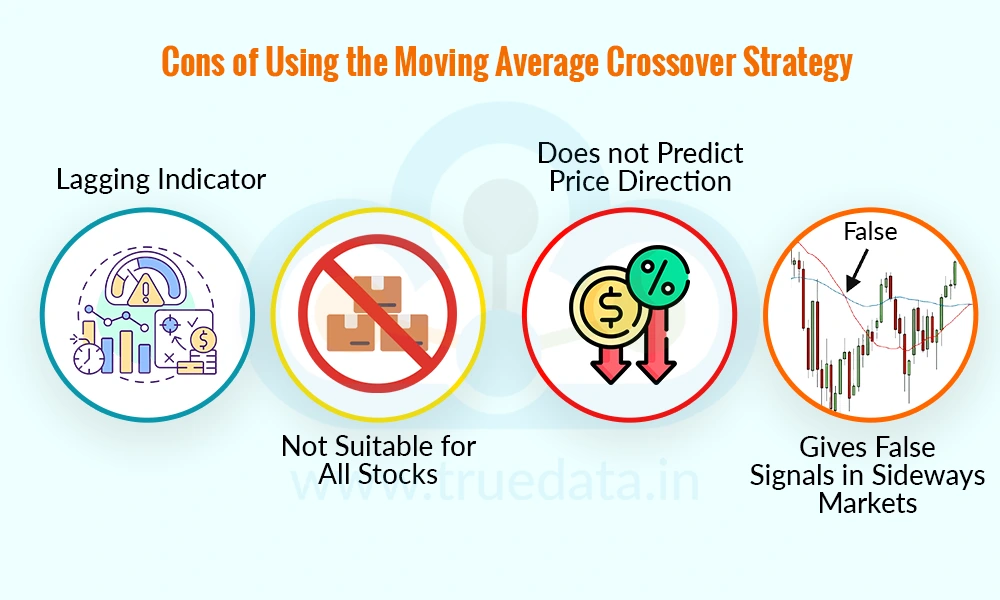
A few limitations or risks in using the moving average crossover strategy are,
Lagging Indicator - Moving averages are based on past prices, so signals can come late. Traders might enter or exit trades after the move has already started or is nearly over.
Not Suitable for All Stocks - This strategy may not work well on low-volume or highly volatile stocks, which can produce random price swings and misleading crossovers.
Does not Predict Price Direction - Moving averages follow the price, and they do not predict where it will go. So, traders should not fully depend on them without understanding the market context or news.
Gives False Signals in Sideways Markets - The moving averages often cross each other in a sideways or range-bound market, leading to false signals and small losses, which can be frustrating for traders.
The Moving Average Crossover Strategy is a simple and useful method for traders to spot buy and sell signals based on trend direction. While it is easy to understand and use for trading, traders still need to understand it thoroughly to use it efficiently and also avoid any pitfalls along the way. When used with discipline and supporting indicators, this strategy can become a helpful part of any trader’s toolkit.
This article explains a fundamental strategy in trading. Let us know your thoughts on the topic or if you need further information on the same, and we will address it.
Till then, Happy Reading!
Read More: Engulfing Candlestick Patterns
Traders in stock markets use various tools to evaluate a trading opportunity for...
What is Simple Moving Average (SMA)? SMA is essentially the mean, or normal, of...
Introduction Real Time Data from NSE, BSE & MCX is distributed to various d...