The stock market in India is a rollercoaster! One day it is soaring high, and the next, it is taking a nosedive. While seasoned investors often seem to know when to jump in or step out, many retail investors are left scratching their heads, unsure whether to buy, sell, or just hold tight. What if there were a simple way to gauge the mood of the market, i.e., whether it is driven by fear or greed, so you could make smarter investment decisions? That is where the Fear and Greed Index comes in. Heard about it? Check out this blog to know all about the fear and greed index and how to use it effectively to make a robust investment portfolio.
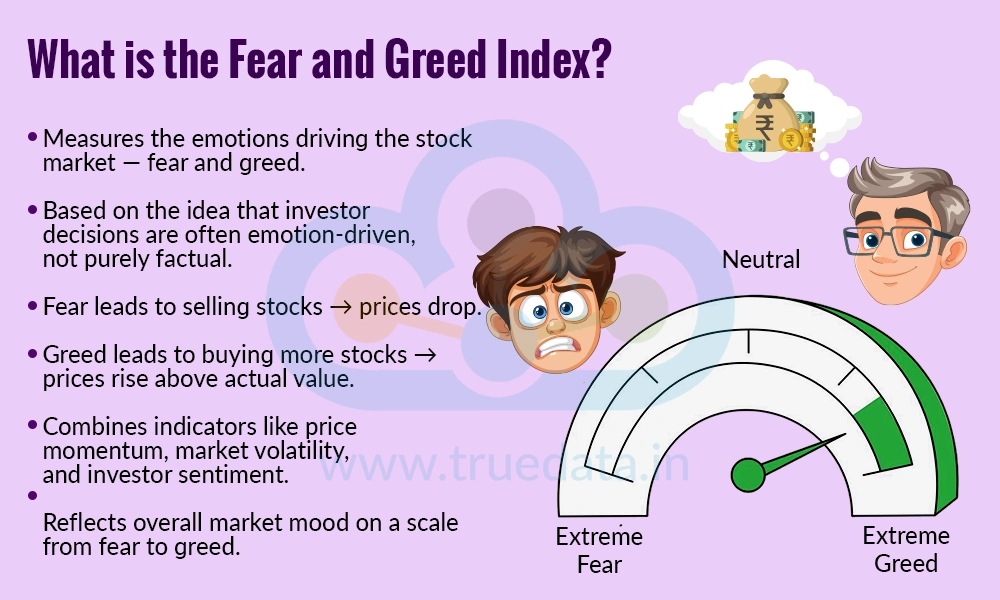
The Fear and Greed Index is a tool that measures the emotions driving the stock market at any given time. It is based on the idea that investors’ decisions are often influenced by their feelings rather than just facts. When the market is dominated by fear, people tend to sell their stocks, even if the companies are performing well, leading to lower prices. On the other hand, when greed takes over, investors buy more stocks, often pushing prices higher than their actual value. The index combines several indicators, such as stock price momentum, market volatility, and investor sentiment, to give a number that reflects whether the market is leaning more towards fear or greed. This index can act as a helpful guide for investors to understand the overall mood of the market and make informed decisions, rather than being swayed by panic or over-enthusiasm.
The calculation of the Fear and Greed Index is based on several factors that can shape the market sentiment. These components that influence the fear and greed index are explained below.
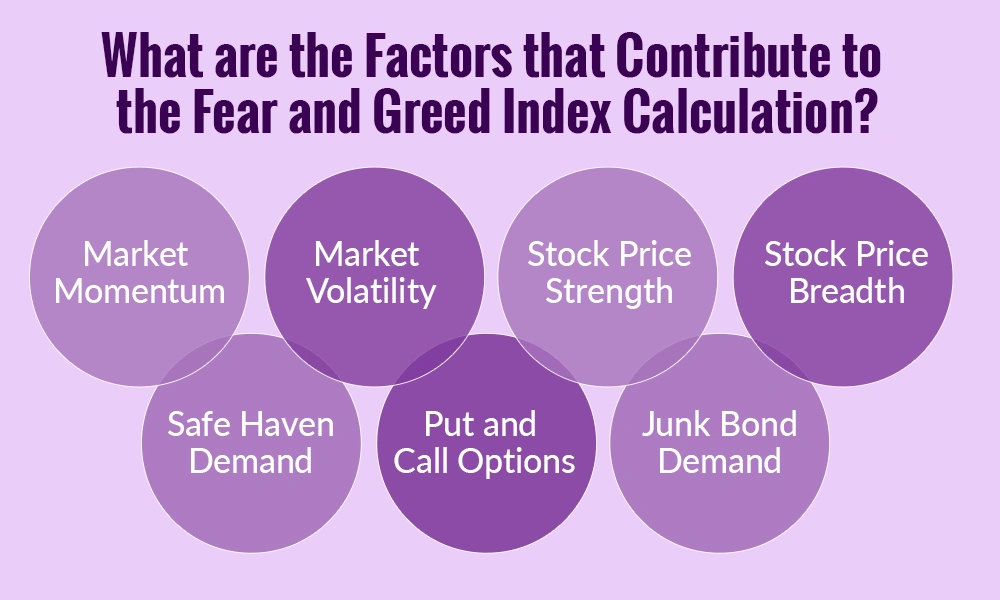
Market momentum looks at how the stock market has been moving recently. If stock prices are rising steadily, it may show that investors are becoming greedy, hoping to earn more profits. Conversely, if prices are falling quickly, it can indicate fear, as investors rush to sell their stocks. This factor helps understand whether the market is currently confident or anxious.
Volatility refers to how much and how quickly stock prices move up or down. Higher volatility usually signals fear because investors feel uncertain and are unsure about the future. Low volatility, where prices move steadily, may indicate greed, as investors are confidently buying stocks without worrying much about risks.
This factor measures the performance of individual stocks. If a large number of stocks are reaching new highs, it often shows optimism and greed among investors. On the other hand, if many stocks are hitting new lows, it reflects fear. For investors, paying attention to major indices like Nifty 50 or Sensex can give a good idea of overall stock strength.
This looks at the number of stocks that are rising versus those that are falling. If more stocks are going up than down, it shows optimism and greed. If more stocks are falling, it indicates fear. This can be observed in the performance of various sectors like IT, banking, or FMCG to see where investors are putting their money.
Investors often shift their money to safe assets like gold, government bonds, or fixed deposits during uncertain times. When more people are investing in safe havens, it reflects fear in the market. On the other hand, when investors move money away from safe assets into stocks, it shows confidence and greed.
Options are contracts that investors use to bet on stock prices going up or down. The ratio of ‘put’ options (bets on price drops) to ‘call’ options (bets on price rises) gives insight into market sentiment. A higher number of put options shows fear, while more call options suggest greed and optimism.
This factor looks at the demand for riskier investments like lower-rated corporate bonds. When investors are willing to buy riskier bonds, it indicates greed and confidence. When they avoid these bonds, preferring safer options, it shows fear.
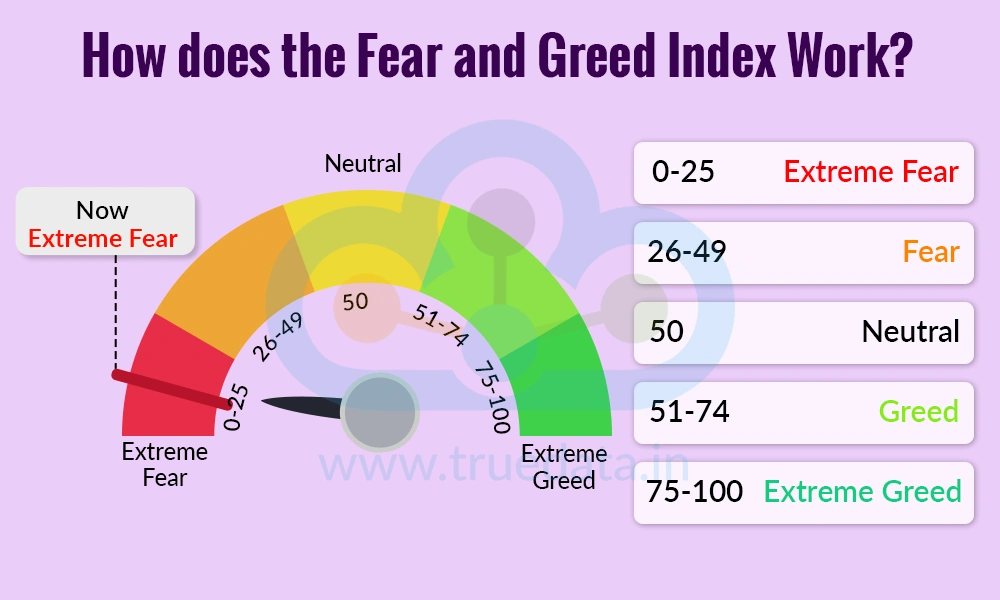
The Fear and Greed Index is calculated by looking at several market indicators, such as stock price trends, market volatility, investor sentiment, safe-haven demand, and options trading. Each indicator gives a signal of whether the market is leaning toward fear or greed. Each of the seven components of the index is given a score, usually on a scale of 0 to 100.
0-50 generally indicates fear in the market.
50-100 suggests greed in the market.
The scores from all components are then combined to create a single overall score of the Fear and Greed Index. The range of the score and what it indicates is given below.
0-25 = Extreme fear - Investors are very worried, and stock prices may be lower than their real value.
26-49 = Fear - The market shows caution; people are selling more than buying.
50 = Neutral - The market is balanced, neither overly fearful nor greedy.
51-74 = Greed - Investors are optimistic and buying more, pushing stock prices higher.
75-100 = Extreme greed - Over-optimism is dominating, and stock prices may be overvalued.
Interpreting the Index -
When the index shows fear, it may indicate a buying opportunity for long-term investors, as stock prices are often lower than their actual value.
When the index shows greed, it warns that the market may be overvalued, and investors should be cautious about buying at high prices.
The index is not a perfect predictor but serves as a sentiment gauge, helping investors avoid emotional decisions during extreme market conditions.
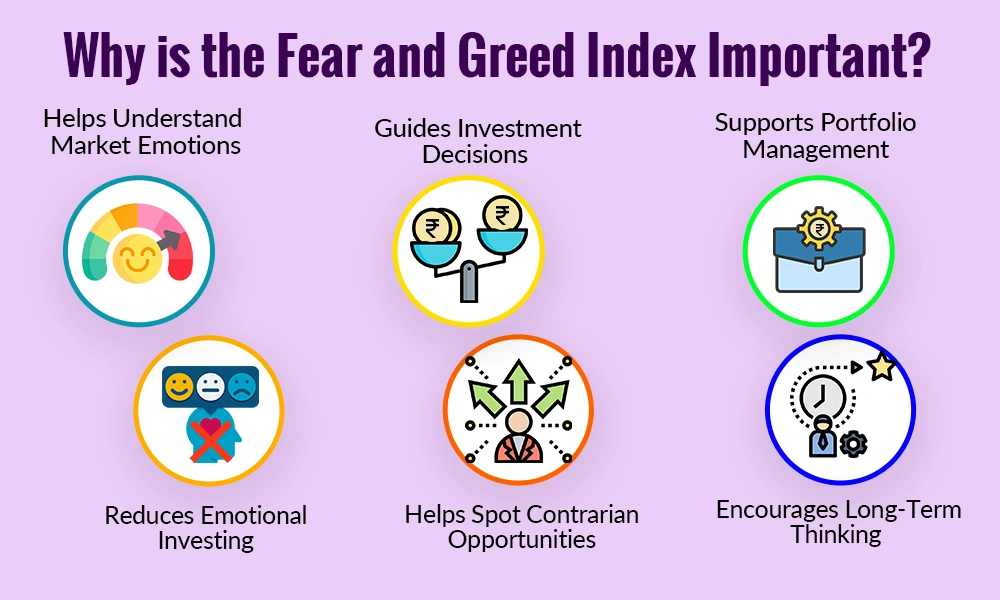
The Fear and Greed Index is a simple yet powerful tool that helps investors make informed decisions. The importance of the Fear and Greed Index is explained below.
Helps Understand Market Emotions -
The stock market is not only driven by facts and numbers but also by investor emotions. The Fear and Greed Index helps measure whether investors are feeling fearful or greedy. For investors, understanding these emotions can prevent making impulsive decisions, like panic selling during a market drop or overbuying when prices are too high.
Guides Investment Decisions -
By showing whether the market is leaning toward fear or greed, the index acts as a guide for investors. For example, extreme fear may indicate good buying opportunities when stocks are undervalued. Extreme greed, on the other hand, warns that the market might be overbought, and caution is needed. This helps investors plan their buying and selling more wisely.
Supports Portfolio Management -
The index helps investors maintain a balanced portfolio. For example, during periods of greed, investors might consider taking some profits or https://www.truedata.in/blog/the-importance-of-diversifying into safer assets like gold or bonds. During periods of fear, they may find opportunities to invest in quality stocks at lower prices, improving long-term returns.
Reduces Emotional Investing -
Many investors make mistakes by letting emotions control their decisions. The Fear and Greed Index provides an objective measure of market sentiment. By relying on this index, investors can take a step back from the hype or panic and make rational choices based on data rather than emotions.
Helps Spot Contrarian Opportunities -
The index allows investors to think differently from the crowd. When most people are fearful and selling, the market may offer bargains. Conversely, when greed dominates, it may signal a time to be cautious. For investors, this contrarian approach can help buy quality stocks at lower prices and avoid overpaying during market rallies.
Encourages Long-Term Thinking -
The index reminds investors that short-term emotions drive the market, but long-term growth depends on fundamentals. By monitoring fear and greed, investors can resist impulsive actions and stay focused on their long-term financial goals, like retirement planning or wealth creation.
After understanding the meaning of the Fear and Greed Index, it is also important to consider the merits and limitations of using this index effectively.
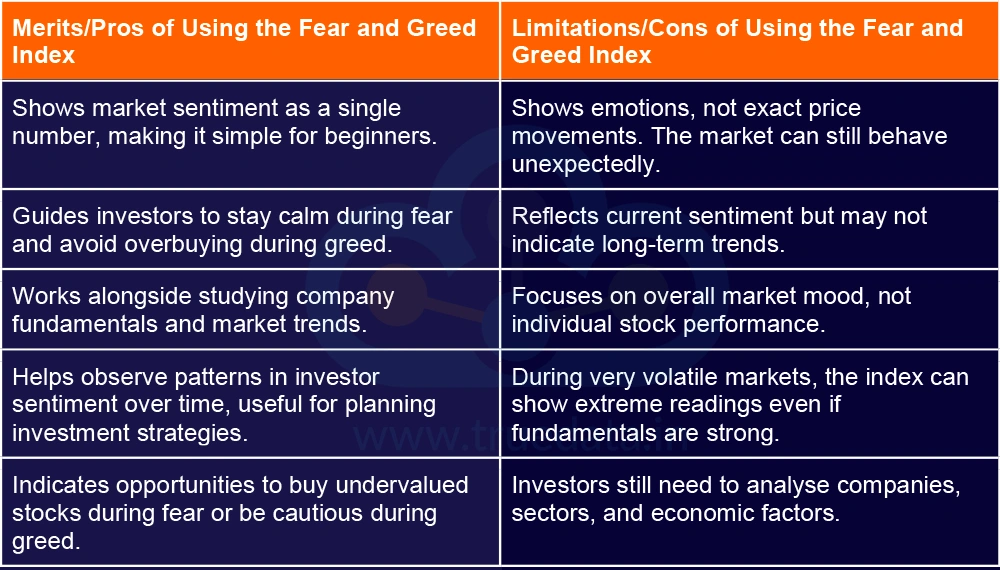
The Fear and Greed Index is a useful tool that helps investors understand the emotions driving the stock market, i.e., whether fear is making people sell or greed is pushing them to buy, thereby giving a clear picture of overall market sentiment. While it cannot predict exact market movements and should not replace research, it serves as a guide to make informed decisions, manage risk, spot opportunities, and avoid emotional investing. Thus, using the index alongside careful analysis can help build a balanced, long-term portfolio and navigate market ups and downs with confidence.
This article focuses on smart investing by leveraging the market mood and thus ensuring that investors are not caught in the wind of extreme market volatility. Let us know your thoughts on the topic or if you need further information on the same, and we will address it soon.
Read More: What is Dollar Index and How Does it Work?
When we take our first step into the trading game, we choose the best resource...
Analysing the price direction is the holy grail of trading. To achieve this, t...
The key tosuccessful trading is understanding price variations and the degree of...