When markets turn volatile, it can be difficult to understand what traders are really expecting next. Is the market becoming overly cautious, or is optimism building beneath the surface? This is where the Put-Call Ratio (PCR) can offer a useful clue. By comparing put and call activity, PCR helps gauge market sentiment and understand whether fear, confidence, or uncertainty is shaping the market. But how should you read this ratio, and can it really help you spot potential market trends? Dive into this blog to explore the meaning and calculation of PCR and its use as part of your market analysis.

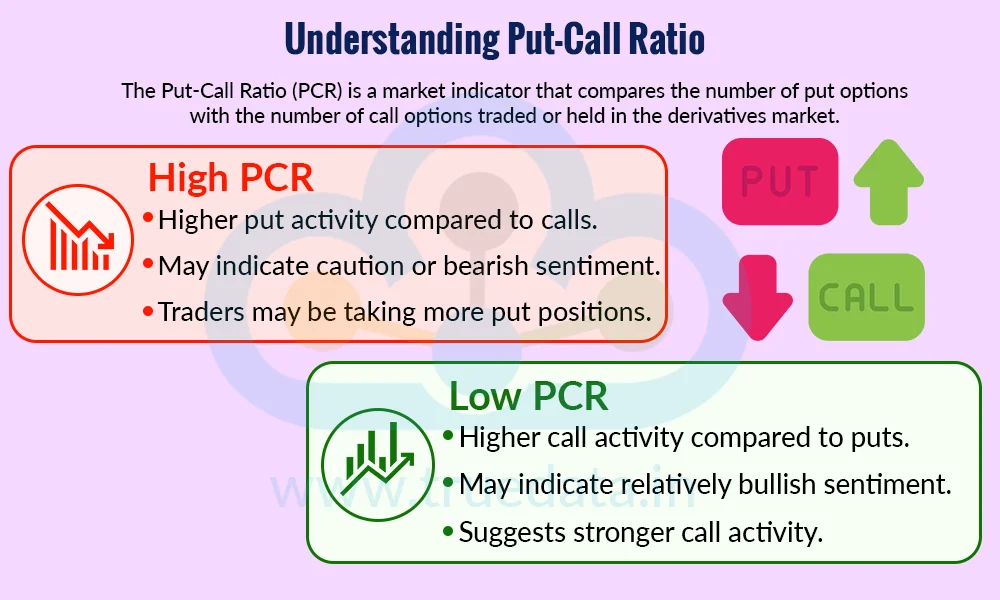
The Put-Call Ratio (PCR) is a market indicator that compares the number of put options with the number of call options traded or held in the derivatives market. It is mainly used to understand the overall sentiment of options traders. A put option gives the buyer the right to sell an asset at a specified price, while a call option gives the buyer the right to buy it. PCR is calculated by dividing put activity by call activity. A higher PCR may suggest that traders are taking more positions in puts and could indicate greater caution or bearish sentiment, while a lower PCR may point to stronger call activity and relatively more bullish sentiment. However, PCR should not be viewed as a standalone buy or sell signal because a high or low ratio can have different meanings depending on market conditions, expiry, and whether the data is based on open interest or trading volume. PCR is often used along with price trends, open interest, volume, and other technical indicators to get a broader view of market sentiment, particularly for indices such as the Nifty 50 and Bank Nifty.
The Put-Call Ratio (PCR) is calculated by comparing the activity in put options with the activity in call options. Traders and investors can calculate PCR mainly in two ways, i.e., using Open Interest (OI) or trading volume. The formula to be used depends on the analysis direction.

This formula focuses on the open interest in put and call options to calculate the PCR. Open interest shows the total number of option contracts that are still open and have not been closed or settled. The formula to calculate the PCR is,
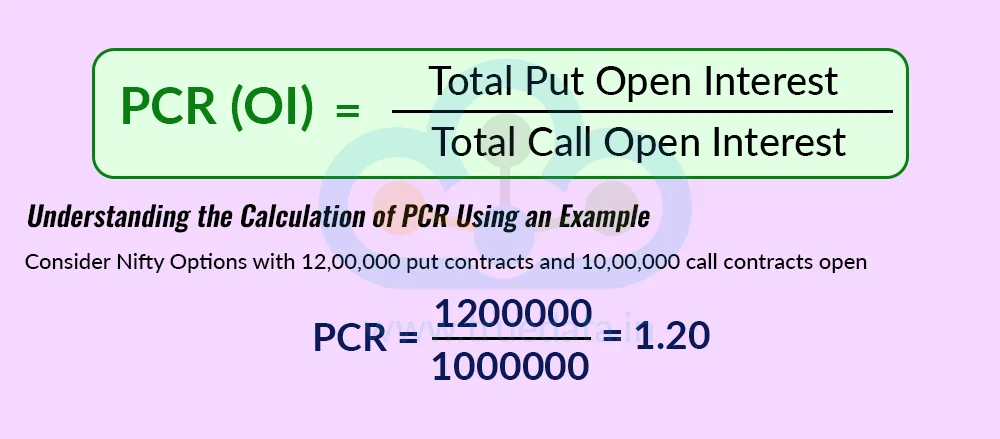
PCR (OI) = Total Put Open Interest / Total Call Open Interest
Understanding the Calculation of PCR Using an Example
Consider Nifty Options with 12,00,000 put contracts and 10,00,000 call contracts open
PCR = 1200000/1000000 = 1.20
This means there are 1.20 put contracts for every 1 call contract. A PCR above 1 means put open interest is higher than call open interest, while a PCR below 1 means call open interest is higher.

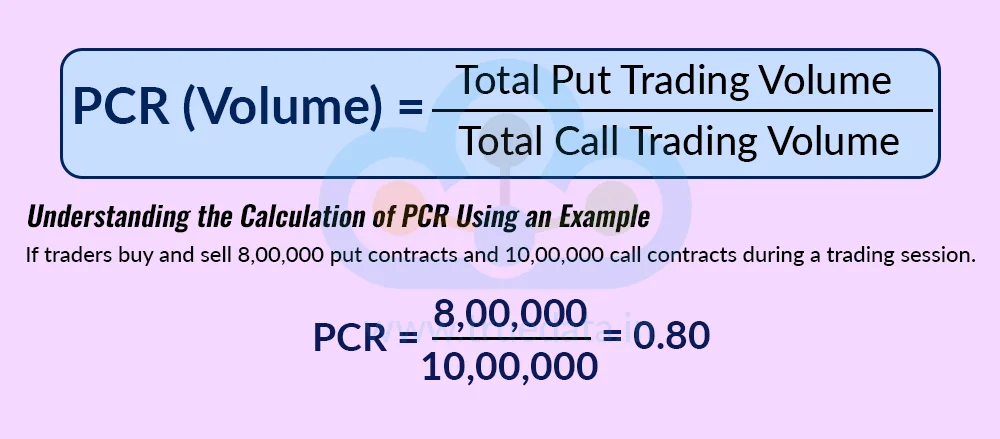
PCR can also be calculated using the number of put and call contracts traded during a particular period. The formula to calculate the PCR is,
PCR (Volume) = Total Put Trading Volume / Total Call Trading Volume
Understanding the Calculation of PCR Using an Example
If traders buy and sell 8,00,000 put contracts and 10,00,000 call contracts during a trading session.
PCR = 8,00,000 / 10,00,000 = 0.80
This means 0.80 put contracts were traded for every 1 call contract during that period.
For options-market analysis, OI-based PCR is widely used to understand positioning, while volume-based PCR can provide a view of current trading activity. A higher PCR indicates more put activity relative to call activity, while a lower PCR indicates call activity is relatively higher. However, PCR does not automatically mean that a high ratio is bullish or a low ratio is bearish. The interpretation depends on factors such as whether the options are being bought or sold, the strike prices involved, market trends, expiry, and the overall positioning of traders. Therefore, PCR should be used in combination with other factors like support and resistance levels, and other technical indicators rather than relying on the ratio alone.

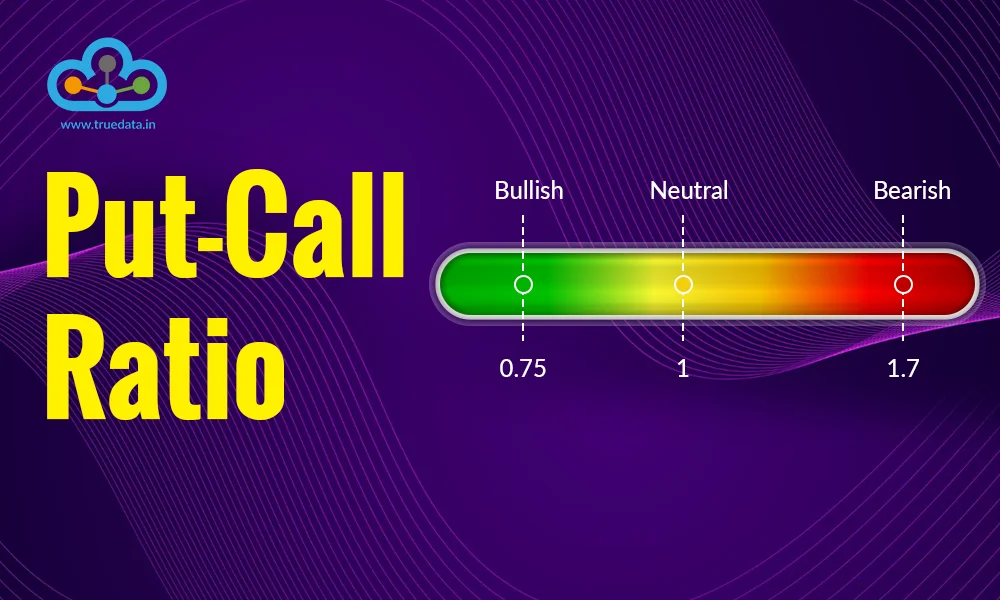
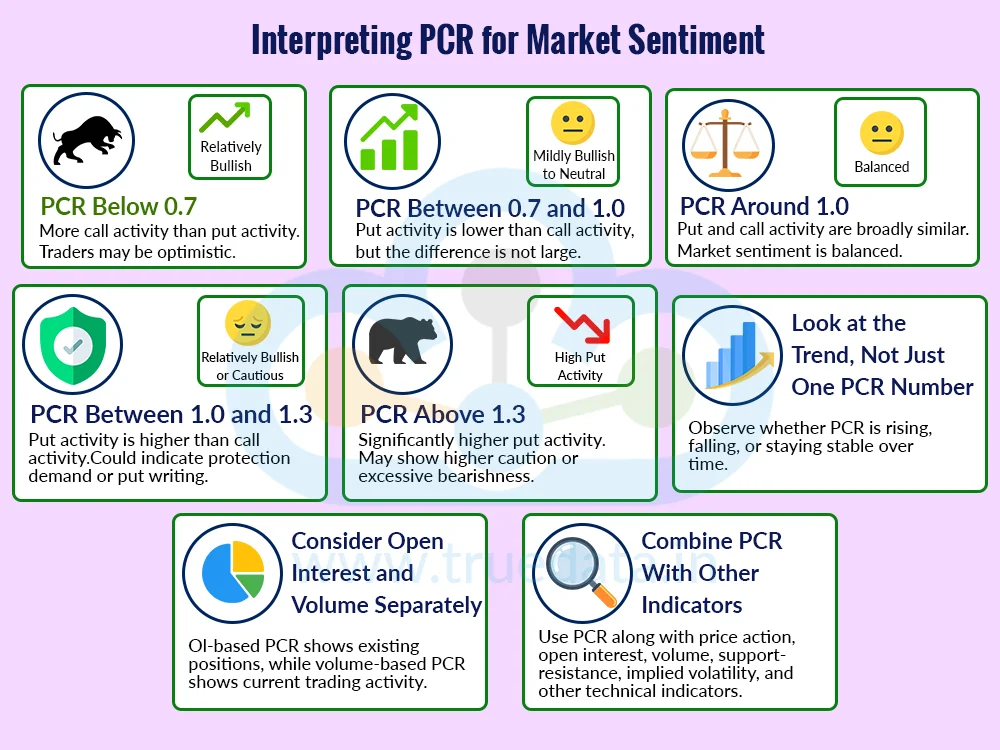
The Put-Call Ratio (PCR) can indicate the mood of the options market. However, there is no single PCR level that always means ‘buy’ or ‘sell’. The interpretation can vary depending on the index or stock, market conditions, expiry, and whether the ratio is based on open interest or volume. The interpretation of this ratio is explained below.
PCR Below 0.7 (Relatively Bullish Sentiment) - A PCR below 0.7 generally means there is more call activity than put activity. This may indicate that traders are relatively optimistic about the market. However, an extremely low PCR can sometimes suggest that optimism has become excessive, which may increase the risk of a market reversal.
PCR Between 0.7 and 1.0 (Mildly Bullish to Neutral) - When PCR is between 0.7 and 1.0, put activity is lower than call activity, but the difference is not very large. This can indicate mildly positive or balanced sentiment. Traders may look at price trends and other indicators to determine the likely direction.
PCR Around 1.0 (Balanced Sentiment) - A PCR close to 1 means put and call activity are broadly similar. This suggests that the options market is relatively balanced, with neither side showing a clear dominance. It may also indicate uncertainty about the market's next move.
PCR Between 1.0 and 1.3 (Relatively Bullish or Cautious) - A PCR above 1 means put activity is higher than call activity. Depending on how the positions were created, this can indicate greater demand for downside protection or bullish positioning through put writing. Therefore, a PCR in this range should not automatically be considered bearish.
PCR Above 1.3 (High Put Activity) - A high PCR indicates that put activity is significantly greater than call activity. This may reflect higher caution, demand for protection, or increased put writing. In some situations, very high PCR readings can also indicate that bearishness has become excessive and may act as a contrarian signal.
Look at the Trend, Not Just One PCR Number - A single PCR reading may not tell the complete story. It can be more useful to observe whether PCR is rising, falling, or staying stable over time. For example, a steadily rising PCR, along with a stable or rising market, may have a different meaning than a rising PCR during a sharp market decline.
Consider Open Interest and Volume Separately - Investors should check whether the PCR is based on open interest or trading volume. OI-based PCR reflects existing option positions, while volume-based PCR reflects current trading activity. The two can sometimes give different signals.
Combine PCR With Other Indicators - PCR works best as one part of a broader analysis. Traders can combine it with price action, changes in open interest, trading volume, support and resistance levels, implied volatility, and other technical indicators before making a trading decision.

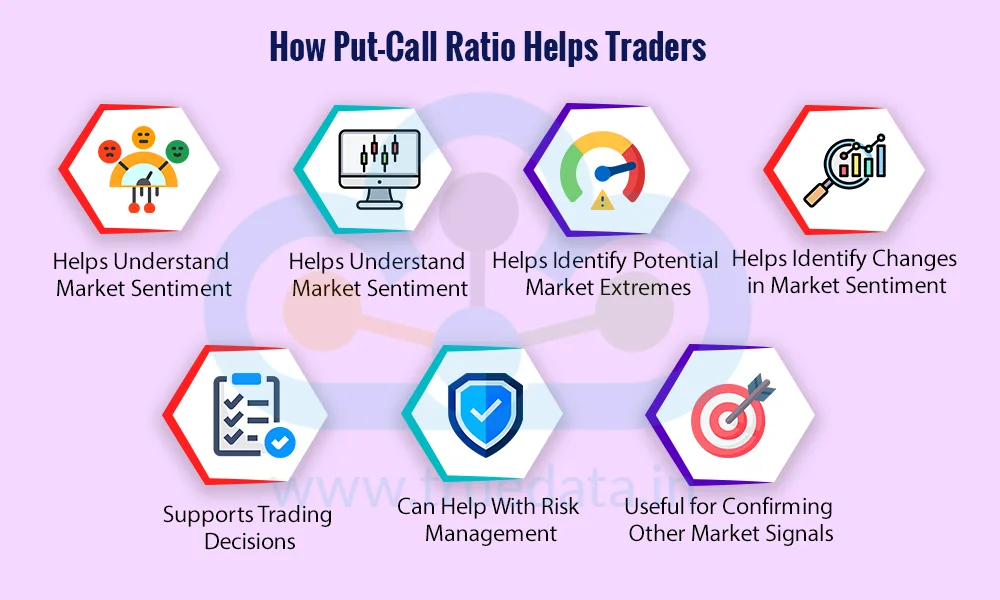
The Put-Call Ratio (PCR) is an important indicator as it provides a quick view of sentiment in the options market. By comparing put and call activity, PCR can help indicate whether market participants are positioning more towards the downside, the upside, or remaining relatively balanced. It can be particularly useful when analysing indices and individual stocks with active options trading.
PCR can provide clues about the overall mood of options traders. A relatively high PCR means put activity is greater than call activity, while a relatively low PCR means call activity is higher. This can help investors understand whether the market is showing greater caution, optimism, or uncertainty. However, PCR should not be treated as a direct measure of bullish or bearish sentiment because puts can be bought for protection as well as sold as part of a bullish strategy.
PCR can help traders understand how put and call positions are distributed in the options market. When used with open interest data, it can provide additional insight into where traders are building positions. For example, a significant increase in put open interest around certain Nifty strikes may help traders identify areas that could act as potential support, although the actual impact depends on whether those options are being bought or sold and how positions change over time.
Extremely high or extremely low PCR readings can sometimes indicate that market sentiment has become heavily tilted in one direction. For example, an unusually high PCR may show that put activity has increased significantly, possibly because traders are becoming very cautious. In some situations, such extreme readings can act as a contrarian signal, suggesting that the market may be approaching a point where sentiment could change. However, this is not a guaranteed reversal signal.
The direction in which PCR is moving can sometimes be more useful than a single PCR reading. A steadily increasing PCR may indicate that put activity is rising relative to calls, while a falling PCR suggests that call activity is becoming relatively stronger. Watching these changes alongside the movement of Nifty or a stock can help traders identify shifts in market positioning.
For options traders, PCR can be one useful input when deciding whether to investigate a potential bullish, bearish, or range-bound setup. Instead of relying only on price movement, traders can compare PCR with changes in open interest, volume, implied volatility, and other technical indicators. This broader approach can help provide better context before entering a trade.
PCR can also be useful for investors who want to understand the level of caution in the derivatives market. A sharp rise in put activity may indicate increased demand for downside protection, which can alert investors to changing market expectations. It should not be used to predict a fall on its own, but it can encourage investors to review their portfolio risk and other market signals.
PCR is generally more useful when it confirms what other indicators are showing. For example, if price action, volume, open interest and PCR are all pointing towards stronger bullish positioning, the combined picture may be more meaningful than PCR alone. Similarly, if they give conflicting signals, traders may choose to wait for greater clarity rather than acting on PCR in isolation.

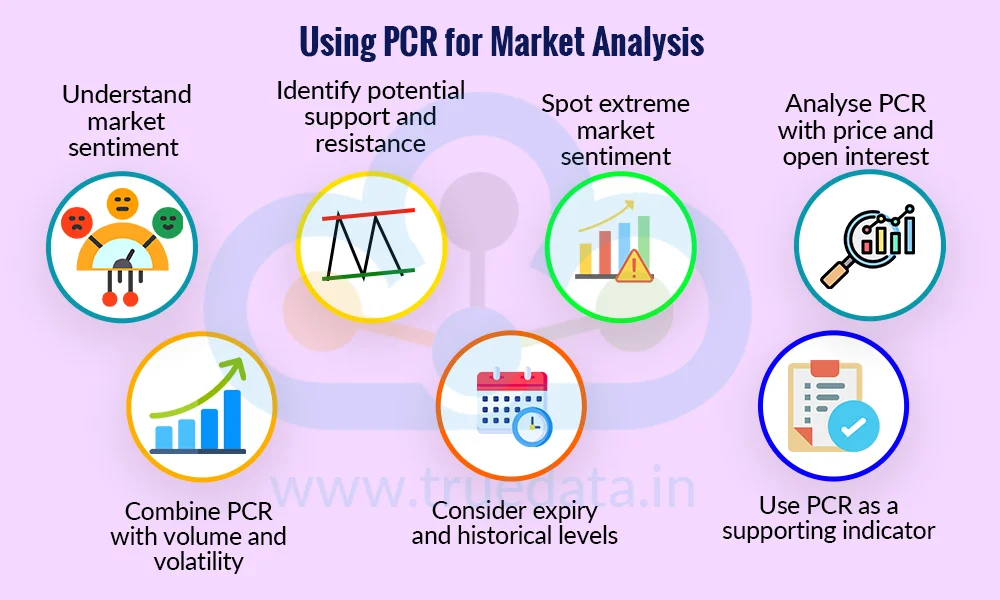
Put-Call Ratio (PCR) can be used in the following ways.
Understand market sentiment - Investors can use PCR to get a broad idea of whether options market participants are relatively bullish, bearish, cautious, or uncertain. A rising or falling PCR can also highlight changes in market sentiment.
Identify potential support and resistance - Traders can study put and call open interest at different strike prices. Higher put open interest at a strike may indicate a potential support area, while higher call open interest may point to a potential resistance area. However, this should be confirmed with other market data.
Spot extreme market sentiment - Very high or very low PCR readings may show that sentiment has become heavily tilted in one direction. In some situations, extreme readings can act as a contrarian signal, but they should not be treated as guaranteed signs of a market reversal.
Analyse PCR with price and open interest - Traders can compare PCR with price movement and changes in open interest in Nifty, Bank Nifty, or individual stocks. This can help them understand whether options positioning supports or contradicts the current market trend.
Combine PCR with volume and volatility - Comparing PCR with trading volume and implied volatility can provide a clearer picture of current options activity and market expectations. This is particularly useful for options traders assessing potential bullish, bearish, or range-bound setups.
Consider expiry and historical levels - PCR can change quickly as an options expiry approaches. Investors should therefore consider the expiry date, market conditions, and the stock or index's historical PCR range instead of treating a fixed PCR level as universally bullish or bearish.
Use PCR as a supporting indicator - PCR is most useful when combined with price action, open interest, volume, implied volatility, support and resistance, and other technical or fundamental factors. It should not be used alone to make a buy, sell, or options-trading decision.

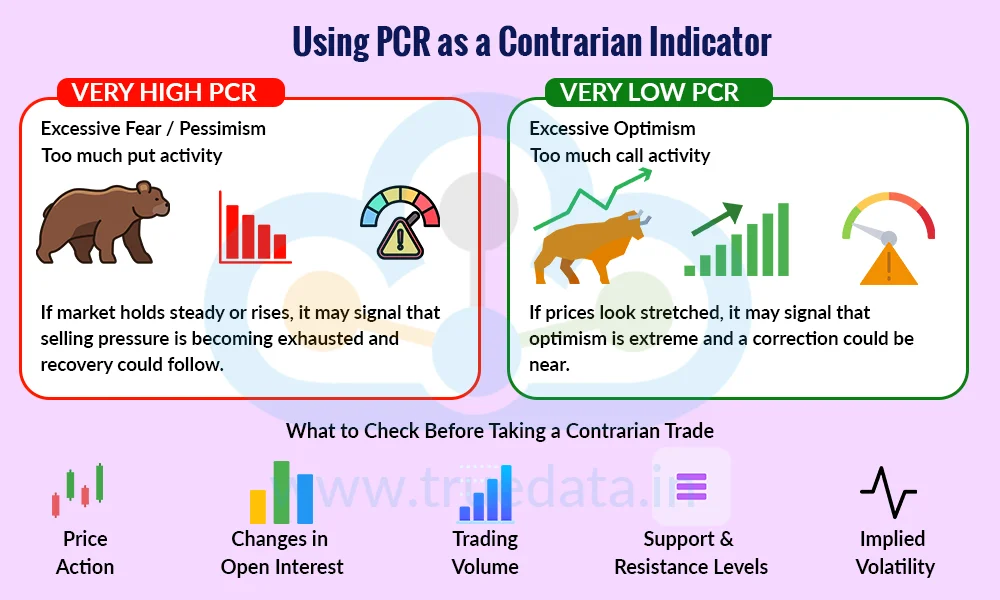
The Put-Call Ratio (PCR) can sometimes be used as a contrarian indicator, which means traders look for situations where market sentiment may have become too extreme and consider whether the opposite market move could follow. For example, a very high PCR may indicate that put activity has become unusually strong, suggesting that traders are highly cautious or bearish. If the market is still holding firm despite this extreme pessimism, some traders may view it as a possible sign that selling pressure is becoming exhausted and look for a potential recovery. Similarly, a very low PCR may indicate excessive optimism or heavy call activity. If prices also appear stretched, traders may become alert to the possibility of a correction.
However, PCR should not be used on its own to predict a reversal. A high PCR can result from increased put writing, put buying for protection, or other strategies, while a low PCR can have several interpretations as well. Traders can therefore compare extreme PCR readings with price action, changes in open interest, trading volume, support and resistance levels, and implied volatility before considering a contrarian trade. It is also more useful to compare the current PCR with its historical range for the specific index or stock, rather than relying on a fixed number as an automatic reversal signal.

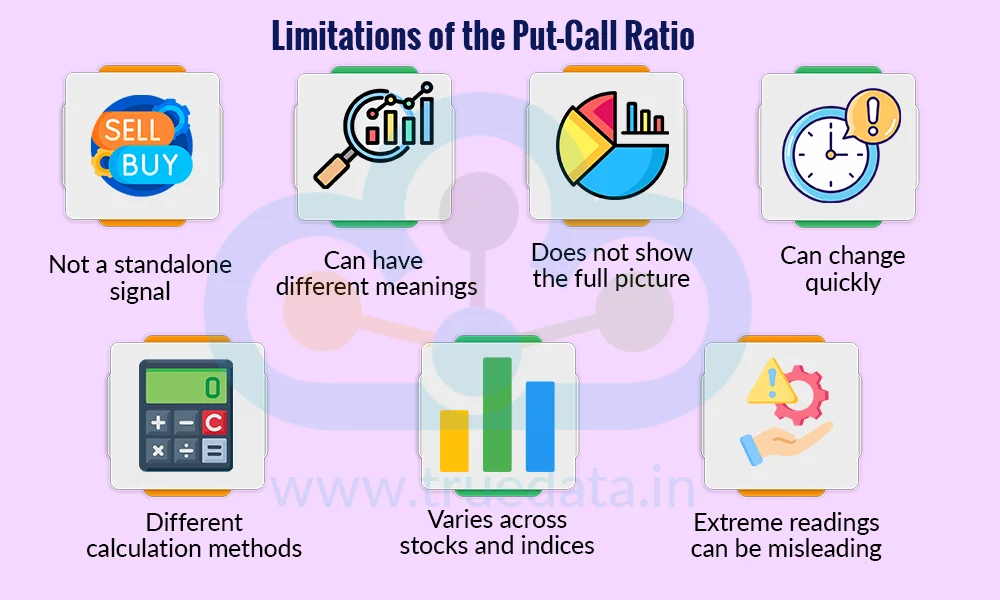
The limitations of the PCR indicator include,
Not a standalone signal - PCR should not be used alone to make buy, sell, or trading decisions.
Can have different meanings - A high PCR does not always mean the market is bearish, and a low PCR does not always mean it is bullish. The meaning depends on whether traders are buying or selling puts and calls.
Does not show the full picture - PCR only compares put and call activity and does not capture all factors affecting the market.
Can change quickly - PCR may change sharply due to market movements, news, or approaching expiry, especially in index options.
Different calculation methods - PCR based on open interest and volume can give different readings, so investors should know which measure is being used.
Varies across stocks and indices - A PCR level that is normal for one stock or index may be unusual for another.
Extreme readings can be misleading - Very high or low PCR may sometimes indicate a contrarian opportunity, but it does not guarantee a market reversal.
The Put-Call Ratio (PCR) is a useful indicator that can help in understanding options market sentiment and identify possible shifts in market positioning. However, PCR is not a guaranteed predictor of market direction and should not be used as a standalone buy or sell signal. By combining PCR with price action, open interest, volume, implied volatility, and other technical or fundamental factors, it can be used more effectively as part of a broader market analysis and to make more informed decisions.
You can also check out our innovative product Sheets by TrueData to get the Put-Call Ratio on real-time data and understand how this ratio helps analyse live data to explore trading opportunities.
This article explains the meaning and use of the Put-Call Ratio and its use in technical analysis. Let us know your thoughts on the topic or if you need further information on the same, and we will address it soon.
Till then, Happy Reading!
Read More: Max Pain Theory - Does It Really Work?
Options trading has become one of the hottest topics in the Indian stock markets...
When we talk about trading, which security is the most common one that comes to ...
India is increasingly becoming a dominant options trading market with the highes...