 Charts and candlesticks are the two main tools used in technical analysis by traders on a daily basis. This helps them understand the price and volume patterns of security. Harami candlesticks are among the popular candlestick patterns that can be used by traders to understand the overall market position or that of a particular security. Given here is the meaning of this term and related concepts of the same. Read More: What is an open high open low strategy?
Harami candlestick pattern is a term used in technical analysis to describe a specific pattern formed by two consecutive candlesticks on a price chart. The word "Harami" is derived from Japanese and means "pregnant." This name is used because the pattern resembles a pregnant woman with a small body nestled inside a larger body. The Harami pattern typically indicates a potential reversal in the price trend. The Harami pattern suggests a potential shift in market sentiment. When it appears after an extended uptrend or downtrend, it may indicate a possible trend reversal. It consists of two candlesticks placed one after the other where the first candlestick is a large one. This indicates a significant move in price and its body engulfs the second candlestick. The second candlestick is relatively smaller and is entirely contained within the range of the first candlestick.
There are two main types of Harami Candlestick that traders can identify and trade accordingly. Given here are the types of Harami Candlesticks and their implications for traders.
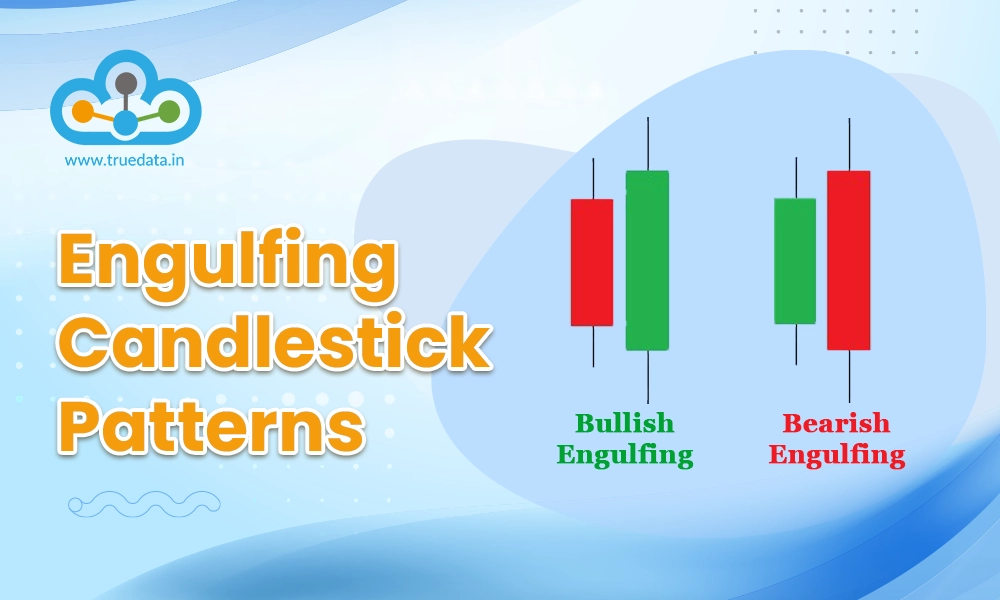
 A bullish harami candlestick pattern is recognized when it occurs during a downtrend in the stock market. The pattern consists of two candles, with the first candle being larger and colored red to indicate a bearish or downward movement in the price. This first candle is often referred to as the "mother candle." On the following day, a smaller green candle is formed. The important characteristic of this second candle is that its size should not exceed 25% of the body of the previous day's candle. In other words, it is a relatively small candle compared to the mother candle. If the stocks open higher on the second day, the smaller green candle may extend halfway up the body of the previous day's candle. This upward movement indicates that buyers are gaining strength and potentially reversing the previous downtrend. The bullish harami pattern, with a red mother candle followed by a smaller green candle, suggests a possible reversal from a bearish trend to a bullish trend. It indicates that selling pressure is weakening, and buyers may be stepping in, potentially driving the price upward.
 A bearish harami candlestick pattern occurs during an uptrend in the stock market. The pattern consists of two candles, with the first candle being larger and colored green to indicate a bullish or upward movement in the price. This first candle is often referred to as the "mother candle." On the second day of the trading session, a smaller red candle is formed. The important characteristic of this second candle is that its entire body is contained within the range of the previous day's green candle. Additionally, the second day's trading session opens with a price lower than the previous day's closing price, resulting in a gap down. The gap down opening on the second day further supports the bearish sentiment, as it signifies a significant decrease in the price compared to the previous day's closing. The bearish harami pattern signifies the potential takeover of bearish sentiment in the market and a potential reversal from a bullish trend to a bearish trend. The fact that the smaller red candle is entirely within the range of the larger green candle indicates that buying pressure is diminishing and selling pressure is potentially increasing.
 Harami candlestick patterns are easy to identify and can provide entry and exit points for traders. Given here is the way to identify harami candlestick patterns and trade using these patterns.

Some of the benefits of using the harami candlestick pattern are mentioned hereunder.
The Harami pattern is considered a reversal signal, suggesting a potential change in the direction of the price trend. It occurs when a small candle, representing a period of indecision, appears within the range of the previous larger candle. This indicates that the momentum of the current trend may be slowing down, and a reversal could be forthcoming. Traders who spot this pattern early may be able to position themselves to take advantage of the potential trend reversal.
The Harami pattern is relatively easy to identify on a price chart. It consists of two candles. The first candle is a larger one, representing the existing trend, while the second candle is smaller and completely contained within the range of the previous candle. This containment is important as it highlights the potential shift in sentiment.
One advantage of the Harami pattern is that it allows for tight risk management. Traders can place their stop-loss orders near the high or low of the previous candle, depending on whether it is a bullish or bearish Harami. This approach helps limit potential losses if the reversal signal fails and the price continues in its previous direction. Additionally, by placing the stop-loss near the high or low of the previous candle, traders can achieve favorable risk-reward ratios.
Some of the limitations of using the harami candlestick patterns are mentioned hereunder.
While the Harami pattern can be a reliable reversal signal, it is not infallible, and false signals can occur. Not every Harami pattern will lead to a significant reversal in the price trend. In some cases, the price may continue in its previous direction or enter a period of consolidation. Traders should be cautious and not rely solely on the Harami pattern but instead consider it as part of a broader analysis.
The Harami pattern alone does not provide precise timing information for entering or exiting trades. It signals a potential reversal, but it does not indicate exactly when the reversal will occur. Traders need to use additional tools, such as trendlines, support, and resistance levels, or other technical indicators, to confirm the pattern and identify suitable entry or exit points. Combining the Harami pattern with other signals can improve the timing of trades.
The effectiveness of the Harami pattern can vary depending on the market context. It is crucial to consider other factors and indicators when analyzing the pattern. For example, the overall market trend, volume, and support/resistance levels can provide valuable context for interpreting the Harami pattern. A bullish Harami pattern in a strong downtrend may have less significance compared to one occurring in an uptrend or near a major support level. It is essential to analyze the broader market context to increase the reliability of the Harami pattern.
It is generally recommended to wait for confirmation before taking action based solely on the Harami pattern. Confirmation involves waiting for additional price action or using other indicators to support the reversal signal. This approach helps reduce the number of false signals and increases the probability of successful trades. Confirmation can come in the form of subsequent candlestick patterns, breakouts, or indicators showing a shift in momentum.
Candlestick patterns are often considered to be tricky and difficult to interpret by traders especially new traders who are still gaining their footing in the market. However, harami candlesticks are among the easily identifiable and interpretable candlestick patterns. This makes them quite popular among traders (seasoned or beginners) and also provides them with quick entry and exit points. Hope this article was able to provide valuable information relating to harami candlestick patterns and make them more accessible for trading. Let us know what you think of this candlestick pattern and if you have used it in your trades. Also, do let us know if you want any information on any specific candlestick pattern and we will take it up in the coming blogs. Till then Happy Reading!
Marisha Bhatt is a financial content writer @TrueData.
She writes with the sole aim of simplifying complex financial concepts and jargon while attempting to clarify technical and fundamental analysis concepts of the stock markets. The ultimate goal is to spread vital knowledge and benefit the maximum audience. Her Chartered Accountant background acts as the knowledge base to help clarify crucial concepts and create a sound investment portfolio.
Candlestick patterns are among the most basic and common tools traders use to cr...
Stock markets have been under a lot of pressure in the past week and investors ...
Stock investing and trading are becoming primary and secondary sources of income...