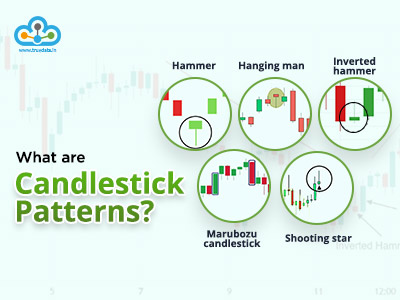
 Stock markets have been under a lot of pressure in the past week and investors have lost millions in multiple trading sessions. However, this has not deterred traders and investors, and are taking this as a lesson to understand the markets better. Candlestick patterns are a crucial technical analysis tool that is used to understand market volatility and price and volume movements. We have discussed a few popular candlestick patterns in our previous article. Given here are a few more double candlestick patterns that are quite popular among traders and can be used to analyse the stock markets.
 Double candlestick patterns are a technical analysis tool that is used in identifying current trends and potential trend reversals. These patterns are formed by two or more consecutive candlestick patterns indicating a change in the market sentiment and the prevailing trend. There can be bullish double candlestick patterns as well as bearish double candlestick patterns and can be used in identifying trading opportunities.
Some of the popular double candlestick patterns and their details are mentioned hereunder.
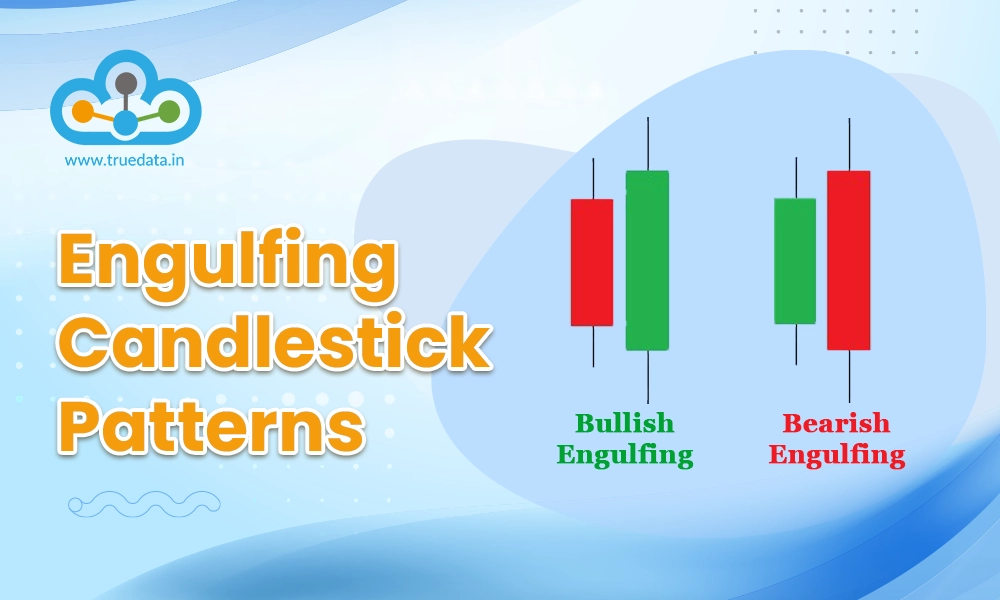
 The engulfing candlestick pattern is formed by using two candles. Under this pattern, the second candle completely engulfs the first candle. This implies that the range of the second candle is larger than the first candle. Engulfing patterns can be bullish or bearish depending on the price movements. These patterns are considered strong reversal patterns and are commonly used by traders in identifying potential trend reversals in the market.
A bullish engulfing pattern is seen when the small bearish candlestick is followed by a larger bullish candlestick. The larger candlestick completely covers the previous bearish candlestick which indicates that the bulls have taken charge of the market and there could be a bullish trend reversal.
This candlestick pattern is the exact opposite of the bullish candlestick pattern. Under this pattern, a small bullish candlestick is covered or engulfed by the larger bearish candlestick which is an indication that the sellers have taken charge of the market and there could be a bearish trend reversal.
 The name ‘Harami’ comes from the Japanese language which literary means ‘pregnant’ and the harami candlestick pattern resembles a small woman that is with a small body and a larger body which is inside it. The meaning of bullish and bearish harami candlestick patterns are given below.
In this pattern, the first candlestick pattern is a large bearish candle which is followed by a smaller bullish candle. The smaller candle is completely contained or covered within the previous candle’s range. This pattern indicates the weakening seller pressure and buyers taking over leading to a potential bullish trend reversal
In this pattern, the first candlestick pattern is a large bullish candle followed by a smaller bearish candle. The smaller candle is completely contained in the previous candle’s range. This pattern indicates a weakening pressure on the buyers and the increasing dominance of the sellers leading to a potential bearish trend reversal.
 This is another candlestick pattern that is formed using two successive candles and is formed at the end of an uptrend. This candle is a signal of the potential reversal of an uptrend. The first candle is a long bullish candle and the second candle is a bearish one. The second candle has to open above the high of the previous day's candlestick and close below the midpoint of the previous bullish candlestick. This pattern indicates buyers are in control to push the prices higher at the open but is followed by the dominance of the sellers pushing the prices down. This shift in prices indicates a reversal of the uptrend. The gap between the two candlesticks indicates how powerful the reversal of the trend will be.
 This candlestick pattern is formed over two consecutive trading sessions and is known as the bullish reversal pattern formed towards the end of the downtrend. This candlestick pattern is similar to the dark cloud cover pattern, the only difference is that the dark cloud pattern is a bearish reversal pattern while the piercing pattern is a bullish reversal pattern. Under this pattern, the first candlestick is a long bearish one on the first trading session which is followed by a long bullish candle on the second day. The bullish candle has to open below the low of the bearish candle formed on the previous day. This pattern indicates the dominance of the sellers on the previous day but bulls coming in and asserting their control on the second day. This pushes the prices back up and indicates a reversal of the downtrend.
 This is a Japanese candlestick pattern and is known as a trend reversal pattern. These patterns are formed by multiple candlesticks that have the same high or low prices. A tweezer top pattern is formed when two or more successive candles have the same higher price. This indicates that the bulls are also finding it difficult to push the prices further high which can result in a possible reversal of the pattern and the end of the uptrend. A tweezer bottom pattern is the opposite of the tweezer top pattern and is formed when two or more successive candles have the same lower price level. This indicates that the bears are also finding it difficult to push the prices further down which can result in a possible reversal of the pattern and the end of the downtrend.
Double candlestick patterns are often used by traders to analyse the market situation and take suitable trading decisions. These candlestick patterns usually occur in the same trading session or multiple trading sessions therefore, it is important to use other technical indicators to confirm the pattern and the movement of the real-time market data to have a healthy and profitable portfolio. We hope this article has been instrumental in providing the basic meaning and details of various double candlestick patterns. Let us know if you have used any of these or if you want to know about any specific pattern in detail. Till then Happy Reading!
Marisha Bhatt is a financial content writer @TrueData.
She writes with the sole aim of simplifying complex financial concepts and jargon while attempting to clarify technical and fundamental analysis concepts of the stock markets. The ultimate goal is to spread vital knowledge and benefit the maximum audience. Her Chartered Accountant background acts as the knowledge base to help clarify crucial concepts and create a sound investment portfolio.
nice post mam. thanks
We are glad you like our post Sir. Stay connected with TrueData for more such engaging content!
Good post. interesting to know about candlestick patterns
We are glad you found the post interesting! Thank you for appreciating our work!
excellent blog for explore topics about trading strategies, candlestick patterns. nicely explored
Candlestick patterns are among the most basic and common tools traders use to cr...
Stock investing and trading are becoming primary and secondary sources of income...
The world oftechnical analysis is filled with many tools like candlestick patter...