
Ask any trader how they read market moves, and chances are they will mention candlestick patterns. These patterns do not just show price action, but they often hint at what might come next. One powerful signal traders watch for is a trend reversal. And that is where the Three White Soldiers pattern comes in. Have you come across it before? Check out this blog where we break down this pattern and how to use it for successful trading.

The Three White Soldiers pattern is a bullish candlestick pattern that signals a possible shift from a downtrend to an uptrend. It appears when three strong, consecutive green (or white) candles form on a price chart, each opening within or near the previous candle’s body and closing higher than the last. This steady upward movement shows that buyers are gaining control and pushing prices up with confidence. This pattern is often seen as a sign that market sentiment is turning positive after a period of decline, making it a useful indicator for spotting potential buying opportunities. However, it is always better to confirm this pattern with other indicators like volume or support levels before making a decision.

The Three White Soldiers pattern shows that buyers are stepping in strongly for three sessions in a row, which can indicate the start of a new upward trend. The steps or factors to identify this pattern are,
Look for a prior downtrend - The pattern should appear after falling prices, as it signals a possible reversal from a downtrend to an uptrend.
Three consecutive bullish (green) candles - Traders should see three strong green candles forming one after another. Each candle represents a session where the closing price is higher than the opening price.
Each candle opens within the previous candle’s body - The second and third candles should open within (or very close to) the body of the previous candle. This shows steady buying interest without large gaps.
Each candle closes higher than the previous one - Every candle should close above the last candle’s close, forming a clear upward staircase pattern.
Long candle bodies with small or no wicks - The candles should have relatively long bodies and small upper/lower shadows. This indicates strong buying pressure throughout the session.
Increasing or strong trading volume (confirmation) - Higher trading volume during these candles adds strength to the pattern, showing that more participants are supporting the upward move.
Minimal pullbacks during the pattern - There should not be significant downward movement within these three candles. A smooth upward move makes the pattern more reliable.
Watch for nearby resistance levels - If the pattern forms just below a strong resistance level, the upward move may face hurdles. Always check support and resistance before acting.

The Three White Soldiers pattern is mainly used as a signal that a falling market may be turning bullish. However, instead of acting immediately, traders usually wait to see if the upward momentum continues. This helps avoid false signals, especially in volatile markets. The steps to trade using the three white soldiers pattern are explained below.
Confirm the Pattern Before Entering a Trade - Even though the pattern looks strong, it is important to confirm it. Traders often wait for the next candle to close higher or for the price to break an important resistance level. This confirmation increases confidence that the trend is actually reversing and not just a temporary bounce.
Deciding the Right Entry Point - A common approach is to enter the trade slightly above the high of the third candle. This suggests that buying momentum is still strong. Some traders also prefer entering in parts (instead of all at once) to manage risk better, especially if the market is moving quickly.
Use Volume as a Confirmation Tool - Volume plays an important role in validating this pattern. If the three candles are supported by increasing or strong trading volume, it shows that many participants are backing the move. Low volume, on the other hand, may indicate a weaker signal.
Managing Risk with Stop-Loss - Risk management is crucial in trading. Traders typically place a stop-loss below the low of the first candle or below the entire pattern. This ensures that if the market moves against the trade, losses are limited. Protecting capital is always more important than chasing profits.
Combine with Other Indicators - The pattern works best when used along with other tools like support and resistance levels, moving averages, or indicators such as RSI. This combination helps traders make more informed decisions rather than relying on a single pattern.
Consider the Overall Market Context - It is also always crucial to look at the bigger picture. If the pattern appears after a long correction or during positive market news, it becomes more reliable. However, if it forms near a strong resistance level, the price may struggle to move higher.

Similar to any other trading pattern, this pattern is also not free from limitations. A few prime limitations of using this pattern include,
This pattern is not 100% accurate and can fail, especially in volatile or news-driven markets.
Traders should confirm the pattern with volume, indicators, or resistance breakout before taking action.
This pattern can appear after a short-term bounce, not a real reversal, i.e., it can sometimes show a temporary upward move in a larger downtrend.
After three strong bullish candles, the stock may already be overbought, increasing the chances of a pullback.
It does not consider news, earnings, global cues, or macro factors that can impact prices.
Volume may not always support the move, and without strong volume, the upward move may lack strength and fail quickly.
The Three White Soldiers pattern is a useful candlestick signal that can help traders spot a possible shift from a downtrend to an uptrend. It reflects strong buying momentum and can offer good entry opportunities when identified correctly. However, it is not foolproof, and traders should always confirm the pattern using volume, support and resistance levels, or other indicators before taking a position.
This article explains a key candlestick pattern and how to interpret it. Let us know your thoughts on the topic or if you need further information on the same and we will address it soon.
Till then, Happy reading!
Read More: Three Black Crows Patterns and Trading Strategies
Marisha Bhatt is a financial content writer @TrueData.
She writes with the sole aim of simplifying complex financial concepts and jargon while attempting to clarify technical and fundamental analysis concepts of the stock markets. The ultimate goal is to spread vital knowledge and benefit the maximum audience. Her Chartered Accountant background acts as the knowledge base to help clarify crucial concepts and create a sound investment portfolio.

The red and green candlesticks on a chart may look like chaos at first glance. B...
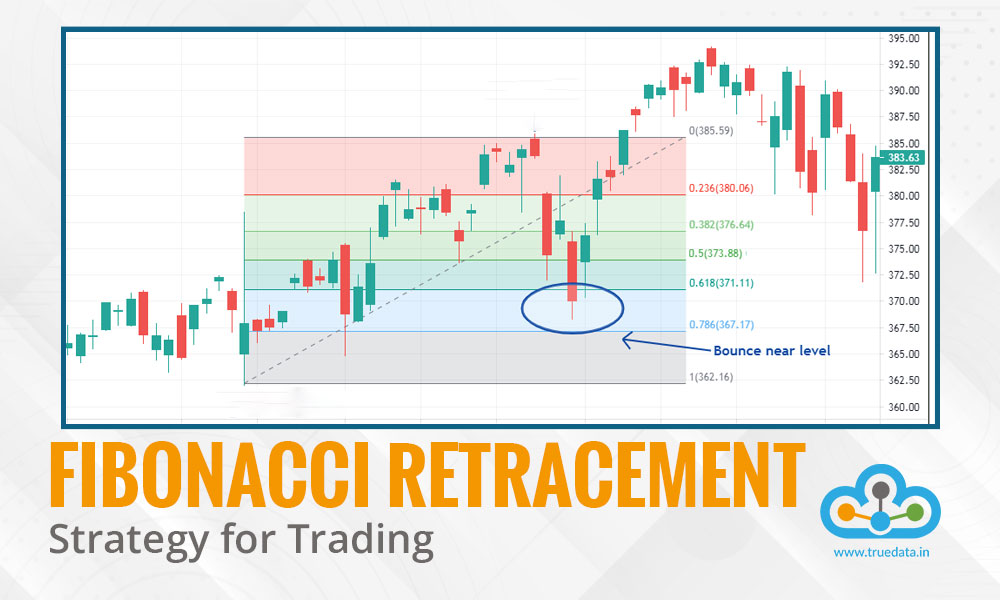
If you are a trader, then you would have definitely heard the term Fibonacci ret...

Have you seen a stock rising for quite some time and then suddenly pausing or re...