
Technical analysis of stocks can often feel like navigating a maze of price and volume movements. Charts and candlestick patterns act as guiding tools, helping traders decode market trends, spot potential reversals, and identify smart entry or exit points. Among these patterns, the Dark Cloud Cover stands out as a key signal of changing market sentiment. It offers valuable insights into possible bearish reversals, helping traders take timely action to safeguard their portfolio. Dive into this blog to understand the Dark Cloud Cover candlestick pattern and learn how to trade it effectively for better decision-making.

A Dark Cloud Cover candlestick pattern is a bearish reversal pattern that signals a possible change in trend from an uptrend to a downtrend. It usually forms over two trading sessions. On the first day, there is a strong bullish (green) candle, showing that buyers are in control and prices are rising. The next day, the market opens higher than the previous day’s close, creating the impression that the uptrend will continue. However, during the day, sellers take charge and push the price down, making the candle close below the midpoint of the previous green candle. This shift from buyer strength to seller pressure indicates that the bullish momentum is weakening, and a possible trend reversal could occur. Traders often see this pattern as an early warning to book profits, reduce long positions, or look for short-selling opportunities, especially when it appears near a resistance level or after a strong rally.

The Dark Cloud Cover candlestick pattern is formed through a clear sequence of price movements that show a shift in market sentiment from bullish to bearish. The steps in the formation of this pattern are explained below.
Ongoing Uptrend -
The pattern usually appears after a steady upward movement in stock prices.
Traders are confident, and buying pressure keeps pushing the prices higher.
First Candle - Strong Bullish Candle
On the first day, a large green (bullish) candle forms, showing that buyers are in full control.
The stock opens lower and closes near the day’s high, confirming strong buying interest.
Second Candle - Bearish Reversal Candle
The next day, the stock opens above the previous day’s high, creating a gap up.
This makes traders believe that the uptrend will continue.
However, during the day, selling pressure increases, and the price starts to fall sharply.
Closing Below the Midpoint
By the end of the second day, the candle closes below the midpoint of the first candle’s body.
The close below the halfway mark confirms the Dark Cloud Cover pattern.
It shows that sellers have taken control, and the earlier bullish momentum is weakening.
Confirmation on the Next Day
Traders usually look for a third candle with a lower close to confirm that a bearish reversal has started.
If this happens, it adds more strength to the pattern’s signal.

The dark cloud cover pattern indicates the potential shift in the market sentiment. The interpretation and the use of this pattern are explained hereunder.
The Dark Cloud Cover pattern is a warning signal of a possible trend reversal from bullish to bearish. It usually appears after a strong uptrend when buyers have been in control for some time. The pattern indicates that the buying momentum is weakening and sellers are beginning to take charge. This shift often hints that the stock price could start moving downward in the coming sessions. Traders use this signal to prepare for a possible fall and to plan their trades more cautiously.
The formation of the second candle with a sharp decline from the day’s high is a sign of increasing selling pressure. It means traders who had earlier bought at higher levels are now starting to book profits or exit their positions, expecting prices to drop. This selling activity can trigger a broader downward movement, especially if the pattern appears near a resistance zone or after a long rally.
This pattern shows a clear change in market mood. The first bullish candle reflects optimism and confidence among buyers, while the second bearish candle shows that sellers have overpowered buyers. When the price closes below the midpoint of the previous candle, it confirms that sellers are gaining control. This shift in sentiment often makes traders rethink their long positions and signals that the market’s enthusiasm may be fading.
At its core, the Dark Cloud Cover represents the psychological battle between buyers and sellers. Buyers start with confidence, pushing prices higher, but sellers quickly take control, creating doubt and fear in the market. This emotional shift is what leads to the pattern’s bearish indication. Recognising it early helps traders make timely decisions, protect profits, and minimise losses.
While the pattern is a strong bearish indicator, experienced traders know it is not a standalone signal. It becomes more reliable when followed by another bearish candle or when supported by technical indicators like RSI, MACD, or volume spikes. A confirmed Dark Cloud Cover pattern gives traders confidence to initiate short positions or tighten stop losses on existing long trades.

The steps to trade using the dark cloud cover pattern are highlighted below.
Identify the Pattern Clearly - The trader should first confirm that the pattern appears after a clear uptrend. The pattern must have two candles, i.e., the first one bullish (green) and the second one bearish (red), that closes below the midpoint of the previous candle’s body. It is important to make sure it is not forming in a sideways or weak trend, as that may reduce accuracy.
Wait for Confirmation - The trader should not enter a trade immediately after spotting the pattern. A third candle that closes lower or a rise in trading volume on the bearish day helps confirm that sellers are in control. Confirmation gives more confidence that a trend reversal is likely.
Decide the Entry Point - After confirmation, a trader can plan to enter a short position (sell) when the price falls below the low of the second bearish candle. This shows that selling pressure is continuing and the downtrend is gaining strength.
Set a Stop-Loss - Risk management is crucial. The stop-loss should be placed just above the high of the second candle. This protects the trader from losses if the market suddenly turns bullish again.
Plan the Target - The trader can set a profit target based on the next support level or by using technical indicators like moving averages or Fibonacci retracements. It is also wise to book partial profits if the stock shows signs of reversal or volume drops sharply.
Use Additional Indicators - To improve accuracy, the trader can combine the pattern with RSI, MACD, or volume analysis. For example, if RSI is showing overbought levels or MACD gives a bearish crossover along with the pattern, it strengthens the bearish signal.
Avoid False Signals - The trader should avoid trading this pattern during low-volume sessions or in a flat market. The pattern works best when it appears near a major resistance level or after a strong rally, where reversal chances are higher.
Now that we have seen the meaning and significance of the dark cloud cover pattern, let us understand the benefits and limitations of using this pattern for better understanding and practical use of the pattern.

The Dark Cloud Cover candlestick pattern is a useful and easy-to-understand bearish reversal signal that helps traders identify when an uptrend may be losing strength. It reflects a clear shift in market sentiment from buyers to sellers and gives traders an early warning to protect profits, plan exits, or look for short opportunities. While it offers strong insights into market psychology and works well with other indicators like RSI, MACD, and volume analysis, it should not be used in isolation. Traders get the best results when they confirm the pattern with additional signals, resistance zones, or follow-up candles. Overall, the Dark Cloud Cover pattern serves as a valuable tool for short-term and swing traders, helping them make smarter, well-timed trading decisions in a changing market.
This article discusses a crucial candlestick pattern and guides how to use it effectively. Let us know your thoughts on this topic or if you need further information on the same.
Till then, Happy Reading!
Read More: What is the Pinbar Candlestick Pattern and How to Trade it?
Marisha Bhatt is a financial content writer @TrueData.
She writes with the sole aim of simplifying complex financial concepts and jargon while attempting to clarify technical and fundamental analysis concepts of the stock markets. The ultimate goal is to spread vital knowledge and benefit the maximum audience. Her Chartered Accountant background acts as the knowledge base to help clarify crucial concepts and create a sound investment portfolio.
Good infographics and content
Thank you Sir! Glad you like our work. Stay tuned for more interesting content on TrueData!
excellent blog post
Thank you Sir! Watch this space for more informative and quality content on TrueData!
Helpful. Keep sharing. Thanks
Thank you for appreciating our work! Keep reading and engaging with TrueData for more quality content!
Good read
Thank you Sir! Glad you like our work!
how to track bearish patterns live
Traders can track bearish patterns live by watching price charts in real time, using tools like candlestick patterns, volume, and key resistance levels on trading platforms. Combining charts with indicators like RSI or moving averages can help spot weakness early and trade with confidence. We hope this resolves your query. You can reach us at [email protected] for further details on the topic.
how to find entry options??
The dark cloud cover is a bearish reversal candlestick pattern, and traders often look for it near resistance with confirmation from strong selling volume. A common entry is below the low of the second candle, with a stop-loss above the high of that candle for risk control. We hope this addresses your query. Keep reading and engaging with TrueData for more informative content on diverse topics!
The main advantage of the dark cloud cover candlestick pattern lies in its function as a robust technical analysis instrument that offers an early indication of a possible bearish trend reversal following a distinct uptrend. This indication assists traders in managing risk, safeguarding profits, and recognizing potential short-selling opportunities.
Well said Sir! The dark cloud cover candlestick pattern is a useful early warning sign that helps traders protect profits, manage risk, and prepare for possible downside after a strong uptrend. Thank you for sharing your thoughts on the topic. Keep reading and sharing your thoughts on our other topics too. We are looking forward to hearing more from you!
Helpful..do more blog about trading indicator s
Thank you! We’re glad you found it helpful, will share more content on trading indicators.
I often get confused between bearish candlestick patterns. The comparison and breakdown in this article helped me understand when a Dark Cloud Cover signal becomes significant.
Thank you for your feedback! We are glad the comparison helped clear up the differences between bearish candlestick patterns. Understanding when a Dark Cloud Cover pattern appears and confirming it with other indicators can help traders make more informed decisions.
Hello, Ma'am. The practical trading tips and risk management suggestions add value beyond simply explaining the pattern. Great read for active traders.
Thank you for your kind feedback! We are glad you found the practical trading tips and risk management insights useful. Keep reading and sharing your thoughts on our other topics too. We are looking forward to hearing more from you!
The explanation of why traders wait for confirmation before entering a trade was very helpful.
Thank you for your feedback! We are glad you found that section helpful. Waiting for confirmation can help traders avoid false signals and improve the reliability of trading decisions when using candlestick patterns like the Dark Cloud Cover.
The visuals and explanations work well together. It makes spotting the pattern much easier when reviewing charts.
Thank you for your feedback! We are glad the visuals and explanations worked well together for you. Stay tuned for more interesting content on TrueData!
Thanks for sharing this blog on Wattpad. A concise yet detailed explanation of a commonly used bearish reversal pattern. Worth reading for anyone learning technical analysis.
Thank you for reading our blog on Wattpad and for your kind feedback! We are glad you found the explanation clear and useful. Keep reading and sharing your thoughts on our other topics too. We are looking forward to hearing more from you!
Informative blog
Thank you for your valuable feedback! Watch this space for more interesting content on TrueData!
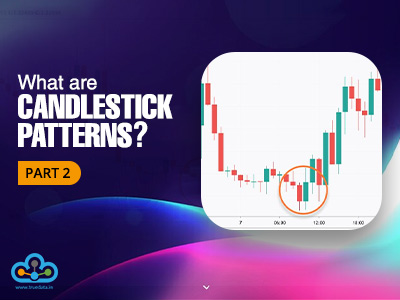
Candlestick patterns are among the most basic and common tools traders use to cr...
We have discussed candlestick patterns and their importance in trading in our p...
Stock markets have been under a lot of pressure in the past week and investors ...