
The stock markets are always in a constant dance of ebb and surge of the market sentiment which pushes the market prices of various securities. Traders use many fundamental and technical analysis tools to gauge this market movement and make suitable trading decisions. One of the most common factors observed by them is the 52-week high and low price of any security or the index as a whole. So what is this 52-week high and low factor and why is it important? Check out this blog to know the meaning of this term and how it affects a trading portfolio.
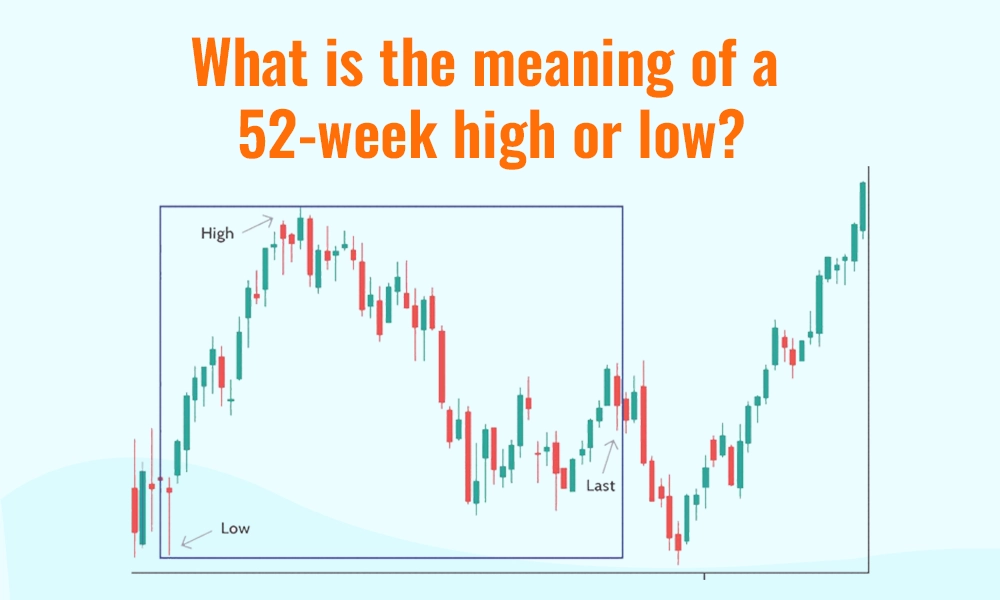
A 52-week high/low refers to the highest or lowest price that a particular stock or security has reached over the past 52 weeks, which is roughly one year. This metric is significant for traders and investors because it provides a snapshot of the stock's performance over a substantial period, highlighting its volatility and potential trends. If a stock is near its 52-week high, it indicates strong performance and possibly increased investor interest or positive news. Conversely, if it's near its 52-week low, it might suggest poor performance, potential undervaluation, or negative news. Investors often use this information to make decisions about buying, selling, or holding stocks, as it helps them understand the stock's historical price range and market sentiment.
The 52-week high or low factor is an important metric of technical analysis indicating the price movements of a stock or the index within a year. The importance of this metric is explained as under.
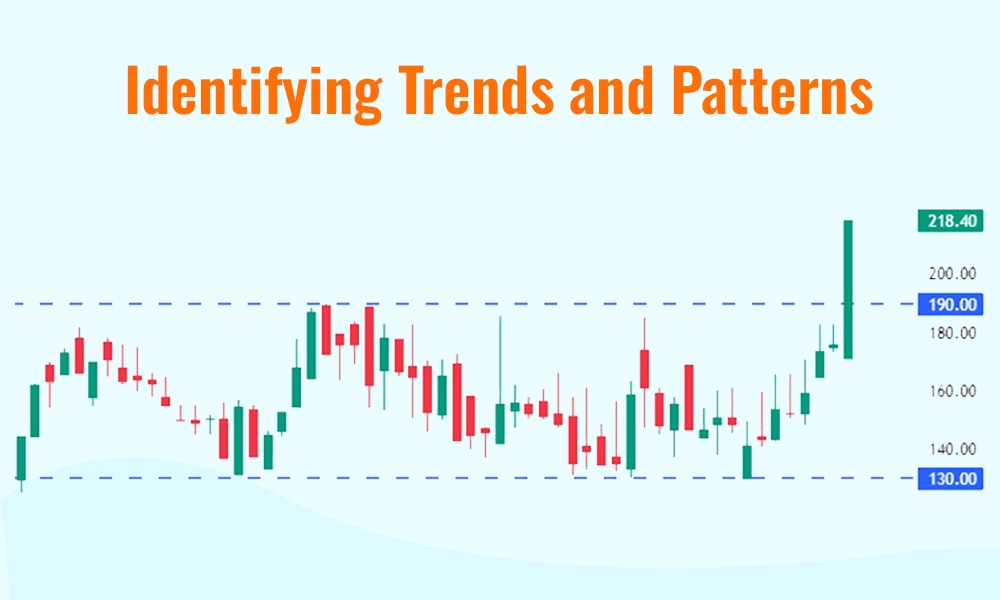
Tracking the 52-week highs and lows can help traders and investors identify trends and patterns in stock prices. If a stock consistently hits new 52-week highs, it may indicate a strong upward trend and a robust growth trajectory. On the other hand, repeated 52-week lows could signal a downward trend and potential trouble. Recognising these trends is vital for making informed decisions, as it helps investors anticipate future price movements and strategise accordingly.
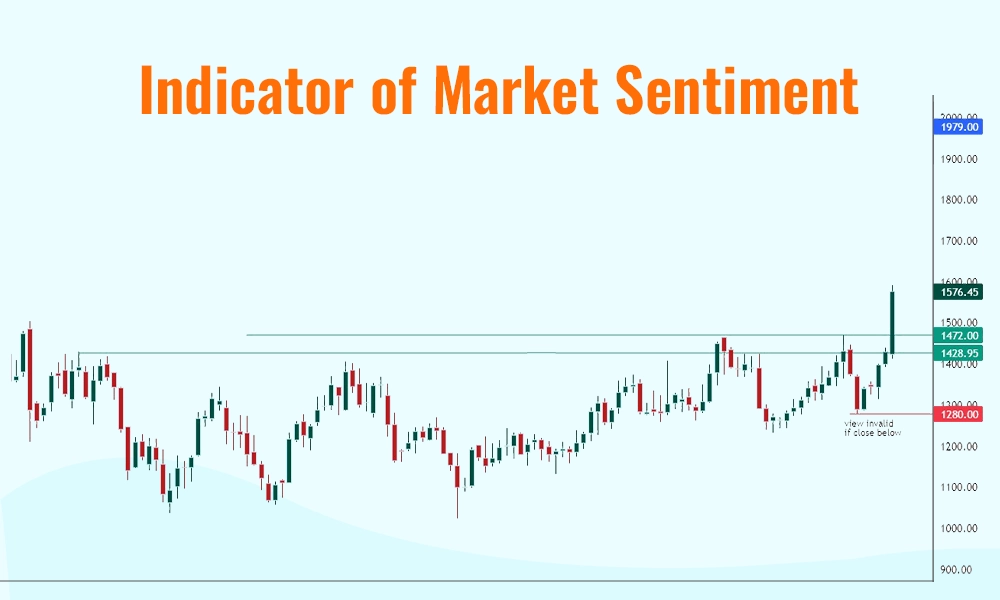
A 52-week high/low also acts as an indicator of market sentiment. When a stock reaches its 52-week high, it means the stock is performing well and has garnered positive attention from investors. This high level of interest often stems from good news about the company, strong financial performance, or favourable market conditions. Conversely, a 52-week low can indicate negative sentiment, perhaps due to poor company performance, adverse news, or unfavourable market trends. Understanding these highs and lows helps traders and investors gauge how the broader market feels about a particular stock.
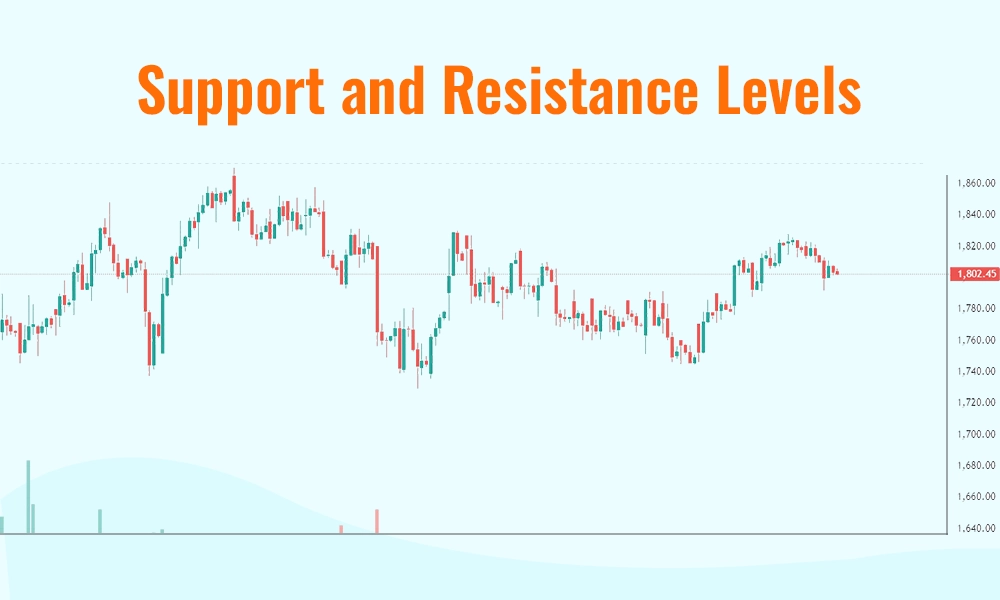
The 52-week high and low often serve as key support and resistance levels. A 52-week high can act as a resistance level, where the stock price struggles to go beyond. Similarly, a 52-week low can act as a support level, which the stock price has difficulty falling below. Traders use these levels to make strategic decisions. For example, traders might sell a stock as it approaches its 52-week high, anticipating resistance, or buy it near its 52-week low, expecting support.
Many trading and investment strategies are built around the concept of 52-week highs and lows. For example, some investors might adopt a momentum strategy, buying stocks that are breaking through their 52-week highs and expecting the upward trend to continue. Others might use a contrarian strategy, buying stocks at their 52-week lows and betting on a potential recovery. Recognising the significance of these price points allows traders and investors to align their strategies with their risk tolerance and investment goals.
The 52-week high and low also have a psychological impact on traders and investors. Stocks reaching their 52-week high are often seen as attractive and might drive a fear of missing out (FOMO) among investors, leading to increased buying. Conversely, stocks at their 52-week low might appear to be bargains, enticing value investors to buy in hopes of a turnaround. Understanding this psychological influence can help investors make more rational decisions rather than reacting emotionally to market movements.

52-week highs indicate a strong upward trend and 52-week lows show a strong downward trend. The use of 52-week highs and lows in trading is explained here.
Consider buying stocks that reach a new 52-week high, indicating potential growth.
Consider selling stocks that hit a new 52-week low, indicating a potential decline.
Use these levels as indicators for support (52-week low) and resistance (52-week high).
52-week highs suggest bullish sentiment while 52-week lows suggest a bearish sentiment.
Confirm highs or lows with high trading volumes for stronger signals.
Traders should not solely rely on 52-week high/low and use other indicators too for confirmation
Investigate reasons behind the highs or lows for better decision-making and monitor them to set stop-loss and take-profit levels.
Avoid buying at a 52-week high if the stock seems overvalued and avoid selling at a 52-week low if the stock seems undervalued.
Consider the overall market conditions and long-term potential of the stock.
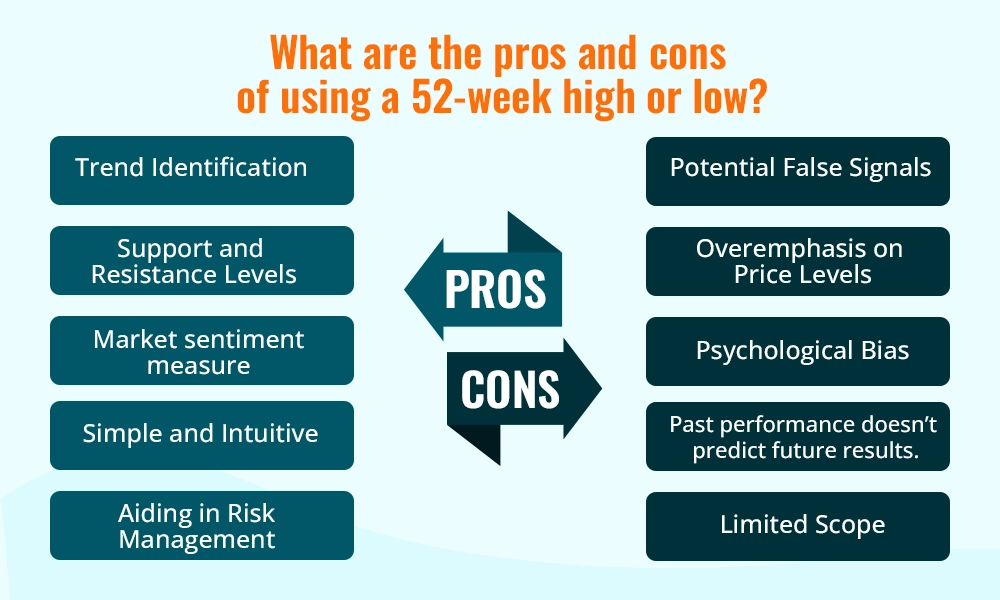
The 52-week high/low is a strong indicator of the performance of the stock or index during the defined period. While this measure provides an insight into the market movements and possible trends traders should also be aware of the pros and cons of using this tool to make informed decisions. Here is a comprehensive list of the same for better understanding.
Trend Identification - Using the 52-week high/low helps traders and investors identify whether a stock is in an upward or downward trend based on its price history.
Support and Resistance Levels - The 52-week high and low provide key price points that can guide buying and selling decisions, acting as support and resistance levels.
Market sentiment measure - These metrics reflect investor sentiment and market perception of stock, indicating whether it is in favour or out of favour with investors.
Simple and Intuitive - The concept of the 52-week high and low is easy for investors to understand and use without requiring complex analysis or technical knowledge.
Aiding in Risk Management - These metrics assist in setting stop-loss orders and protecting investments by identifying key levels where investors might want to exit a position to limit losses.
Potential False Signals - Stocks may hit their highs or lows due to temporary market conditions or anomalies, which can lead to false conclusions about their overall performance.
Overemphasis on Price Levels - Focusing too much on these price points may cause investors to overlook other important factors, such as the company's financial health and market conditions.
Psychological Bias - The psychological impact of 52-week highs and lows can lead to emotional trading decisions, such as fear of missing out (FOMO) or panic selling, rather than rational analysis.
Past Performance is Not Indicative of Future Results - Historical highs and lows do not guarantee future performance, as market conditions and company fundamentals can change, affecting future price movements.
Limited Scope - Relying on a single metric like the 52-week high/low provides a limited view and may not give a complete picture of a stock's potential or risks involved.
May Not Capture the Underlying Value - Highs and lows do not always reflect the true intrinsic value of a stock, which may be influenced by broader economic factors, market trends, or company-specific issues.
52-week high and low is a simple to understand and use concept that helps in making sense of the price movements and making suitable trading or investing decisions. This indicator, although very common, should not be used as the sole measure of trend identification or shaping the portfolio as it can lead to potential losses. Therefore, investors and traders should use this measure in correlation with other indicators to have a robust investment or trading portfolio.
We hope this blog was able to refine the concept of the 52-week high and low and its importance in stock markets in a better manner. Let us know if you have any queries on this topic or need information on similar technical analysis concepts and we will take them up in our coming blogs.
Till then happy Reading!
Read More: What is an Open High Open Low Strategy?

When we take our first step into the trading game, we choose the best resource...

Analysing the price direction is the holy grail of trading. To achieve this, t...

What is one of the deciding factors while investing in a stock? It is its valuat...