 Traders use various fundamental and technical analysis tools to understand a security’s price and volume movements. These indicators not only help in understanding the current market trends but also can help in understanding possible trend reversals enabling suitable trading positions. One of the many popular technical analysis indicators often used by traders is the MACD. given here is the meaning of MACD and related details of the same.
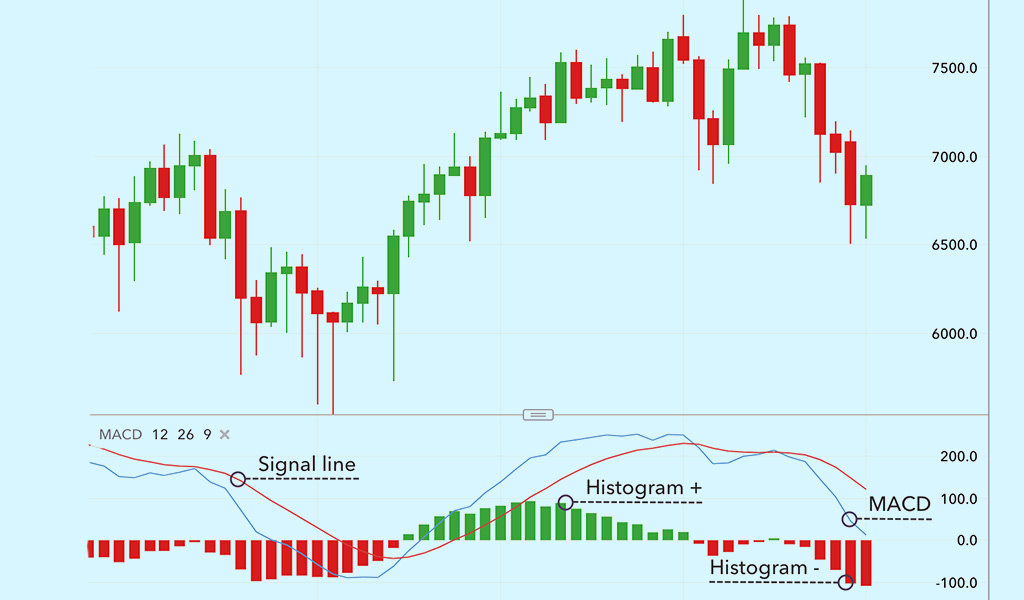 MACD is the abbreviation for Moving Average Convergence Divergence and is an oscillator indicator of technical analysis. This indicator is used to identify the trends and momentum in the financial markets and can be used for different securities like stocks, commodities, and currencies. The MACD indicator uses two lines: the MACD line and the signal line. The MACD line is calculated by subtracting the 26-period Exponential Moving Average (EMA) from the 12-period EMA. The signal line is a 9-period EMA of the MACD line. These lines are plotted on the chart to understand the movement of the trend and take suitable trading action. Furthermore, traders and investors also look for divergences between the MACD line and the price of the underlying asset, which can signal potential trend reversals.
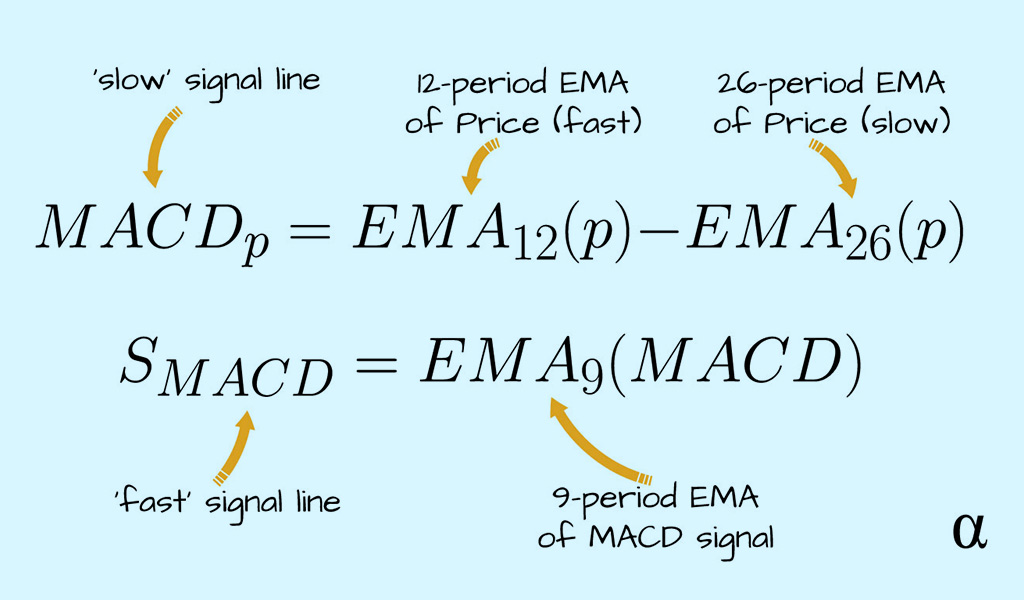 The MACD is quite easy to calculate and interpret for an average trader. Traders can calculate the MACD (Moving Average Convergence Divergence) indicator using the following formula.
The histogram acts as the visual representation of the difference between the MACD line and the signal line. When the MACD line is above the signal line, the histogram will be positive, indicating bullish momentum. When the MACD line is below the signal line, the histogram will be negative, indicating bearish momentum.
The MACD indicator can be used for taking trading positions, understanding the trend direction, the momentum of the security, and the potential buy and sell signals. Traders can interpret the MACD indicator in the following manner to navigate the stock markets.
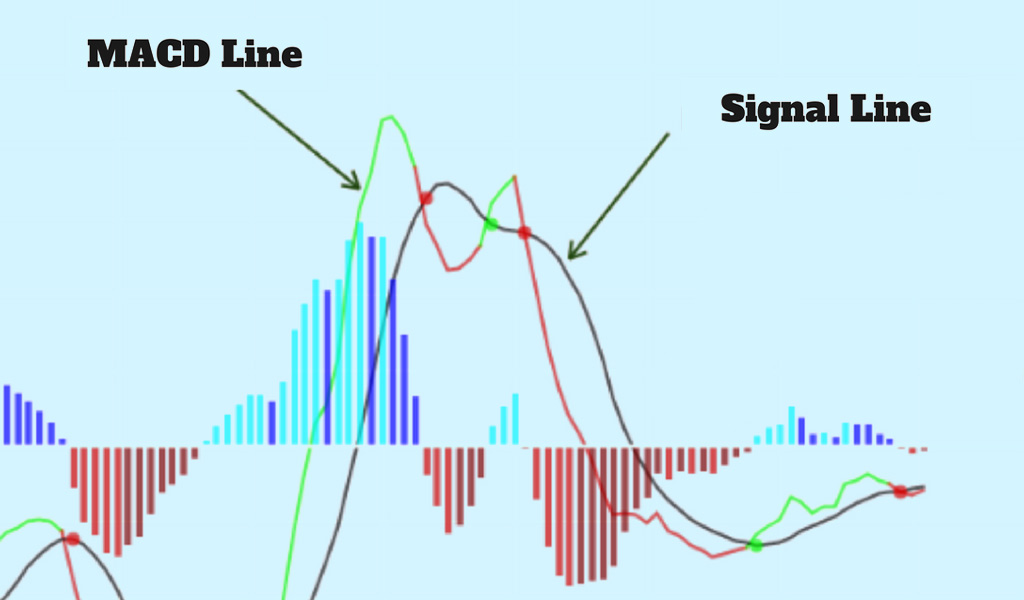 When the MACD line is above the signal line, it suggests that the asset is seeing an uptrend, and when the MACD line is below the signal line, it suggests that the asset is seeing a downtrend. Traders can use this information to successfully determine the direction of the trend and take suitable trading positions accordingly.
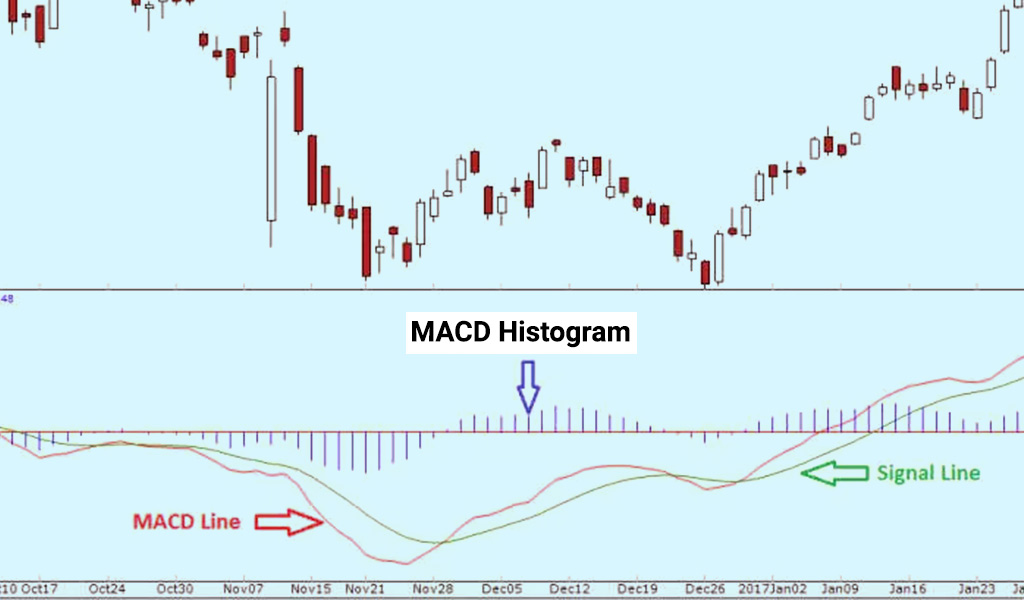 The histogram is a visual representation of the difference between the MACD line and the signal line. When the MACD line is above the signal line, the histogram will be positive, which indicates bullish momentum. When the MACD line is below the signal line, the histogram will be negative, which indicates a bearish momentum.
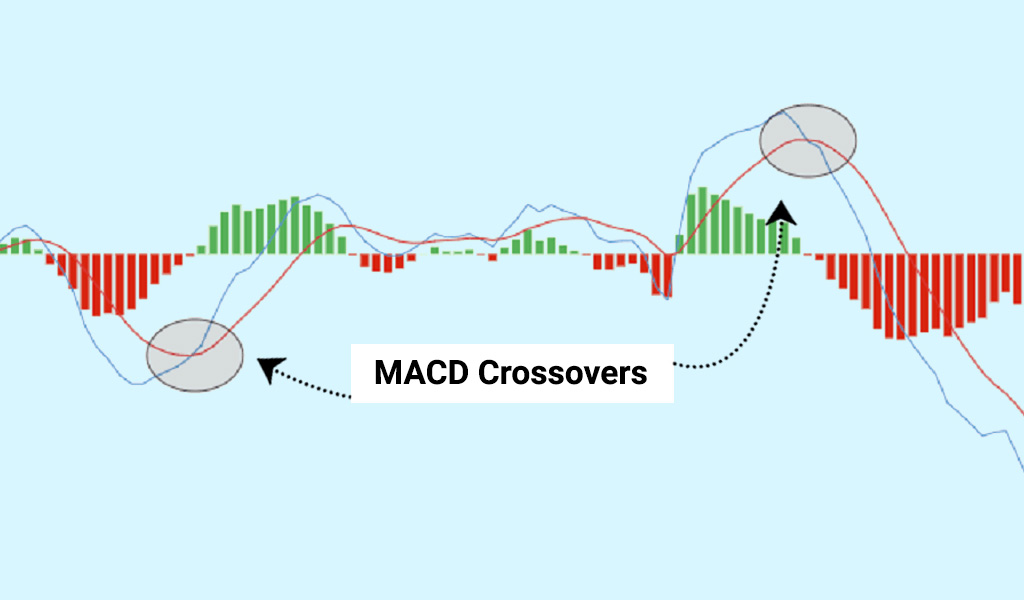 Traders often look for crossovers between the MACD line and the signal line as potential buy/sell signals. A bullish crossover occurs when the MACD line crosses above the signal line, which can indicate a potential buy signal. A bearish crossover occurs when the MACD line crosses below the signal line, which can indicate a potential sell signal.
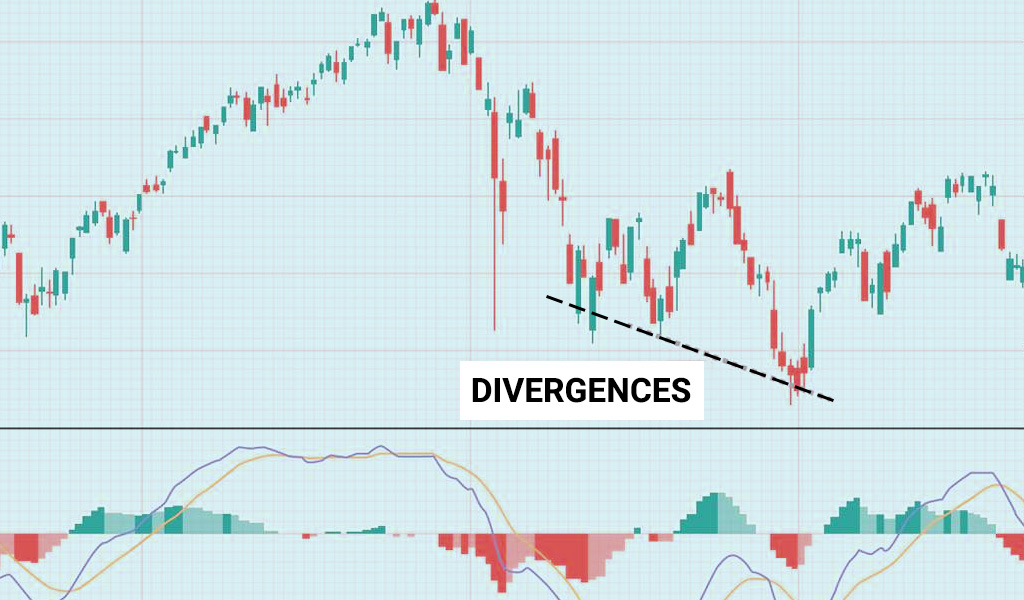 Traders can look for divergences between the MACD indicator and the price of the asset. Such divergence can suggest potential trend reversals and opportunities for short-term gains for traders.
 The MACD indicator is a popular technical analysis indicator and like any other indicator it has its own set of pros and cons. These benefits and limitations of the MACD indicator are listed below.
The major benefits of the MACD indicator include,
Some of the basic limitations of MACD indicator include,
The MACD indicator is a popular choice for most traders in understanding the movement of the trend and curating a successful trading portfolio. Traders should however understand that this is a lagging indicator and therefore, it is important to use other indicators to confirm the trend analysis and take suitable actions. Let us know what you think of the MACD indicator and if you regularly use it to understand the stock markets and their fluctuations. Watch this space for information on more such technical indicators and how to use them for successful trading. Till Then Happy Reading!
The key tosuccessful trading is understanding price variations and the degree of...
It is a fact that technical analysis is the basis of analysing stocks. What does...

When we take our first step into the trading game, we choose the best resource...