
The use of technical analysis tools is a vital part of trading to ensure that traders understand market trends and make informed decisions. Pivot points are among such integral tools that help traders understand the price movements and make sense of the chaos. Do you know how to use pivot points for trading? Check out this blog to understand the meaning and nuances of pivot points for successful trading.

Pivot Points are important price levels used by traders to understand the market’s direction and find possible support and resistance levels. They are calculated using the previous day’s high, low, and closing prices. The main pivot point (P) is the average of these three values. This value is then used to calculate the other levels, like support (S1, S2) and resistance (R1, R2) are calculated. These levels help traders decide where to enter or exit trades, especially in intraday trading. If the price is above the pivot point, it is considered a bullish (buying) signal, and if it is below, it is a bearish (selling) signal.

Calculating pivot points can be highly useful for traders as it can help them spot suitable entry and exit positions, especially in intraday trading. The most common method used to calculate the pivot points is the Standard Pivot Point formula. This formula uses the three key price points to calculate the pivot points, namely, the previous day's high, the previous day's low and the previous day’s closing price. These price points are then averaged to get the pivot point, which is further used to calculate key support and resistance levels.
The formula to calculate pivot points and thereafter the key support and resistance levels is explained below.
P = (High + Low + Close) / 3
Where,
P = Pivot Point
The formula to calculate the key support and resistance levels using pivot points is,
First Resistance (R1) = (2 × Pivot) − Low
First Support (S1) = (2 × Pivot) − High
Second Resistance (R2) = Pivot + (High − Low)
Second Support (S2) = Pivot − (High − Low)
These levels act as the ‘road sign’ for the price chart. The interpretation of the pivot point and further the support and resistance levels is explained below.
Main Pivot Point (P) Shows the Trend
If the price is above the pivot point, the market is likely bullish (buyers are strong).
If the price is below the pivot point, the market is likely bearish (sellers are strong).
Support Levels (S1, S2)
These are price levels below the pivot point.
S1 is the first support; if the price falls here, it may bounce back.
S2 is the next strong support. If S1 breaks, S2 may act as the next buying level.
Resistance Levels (R1, R2)
These are price levels above the pivot point.
R1 is the first resistance; if the price moves here, it may reverse.
R2 is the next level. If R1 breaks, R2 is the next possible selling zone.
Price Between S1 and R1 = Sideways or Range-Bound Market
This means the market is not strongly trending. Many intraday traders book quick profits in this zone.
Breakout Strategy
If price breaks above R1 with high volume, it may go toward R2 – a sign to buy.
If the price falls below S1, it may go to S2 – a sign to sell.
We have seen the calculation of the standard or classic pivot points above. However, there are other variations to this tool as well that cater to different types of traders. These types include,
Fibonacci Pivot Points use Fibonacci ratios (like 0.382, 0.618, 1.000) to calculate support and resistance levels. These ratios come from the Fibonacci sequence, a popular mathematical pattern used in trading to predict how far the price may go. Traders have to first calculate the standard pivot point (same as the classic method), and then apply the Fibonacci levels to the price range (High - Low). This gives more precise and spaced-out support/resistance levels. Fibonacci Pivot Points are very helpful for traders when the market is in a strong trend or is volatile, as they show possible zones where the price may pause or reverse.
The formula to calculate Fibonacci Pivot Points is,
Pivot Point (P) = (High + Low + Close) ÷ 3
Resistance 1 (R1) = P + (High − Low) × 0.382
Resistance 2 (R2) = P + (High − Low) × 0.618
Resistance 3 (R3) = P + (High − Low) × 1.000
Support 1 (S1) = P − (High − Low) × 0.382
Support 2 (S2) = P − (High − Low) × 0.618
Support 3 (S3) = P − (High − Low) × 1.000
Camarilla Pivot Points are great for short-term or fast-paced intraday trading. They provide multiple levels of support and resistance that are very close to the current market price, allowing quick trade setups. They are calculated using a different formula that focuses on closing prices and uses multipliers like 1.1/12, 1.1/6, etc., making the levels tighter. This helps traders capture small but quick price movements, especially in stocks or Bank Nifty. Camarilla is a favourite among scalp traders or fast intraday players, who need tight entry/exit levels and work with small price ranges.
The formula to calculate Camarilla Pivot Points is,
Pivot Point (P) = (High + Low + Close) ÷ 3
Resistance 1 (R1) = Close + (High − Low) × 1.1 / 12
Support 1 (S1) = Close − (High − Low) × 1.1 / 12
There are up to R4 and S4 with different multipliers under Camarilla Pivot Points.
Woodie’s Pivot Points give more importance to the closing price of the previous day. This means it reflects what traders felt at the end of the trading day, making it more reactive to recent market sentiment. The main pivot is calculated by giving double weight to the closing price, unlike the classic method, which treats all three prices equally. This gives slightly different levels than standard pivot points, which some traders find more accurate for short-term trading. Traders who use closing-based setups or trade around market open often prefer Woodie’s method for a fresh view of trend strength.
The formula to calculate Woodie’s Pivot Points is,
Pivot Point (P) = (High + Low + 2 × Close) ÷ 4
R1 = (2 × P) − Low
S1 = (2 × P) − High
Demark Pivot Points are a unique and slightly advanced method. They focus on the relationship between opening and closing prices to determine the market trend. Based on whether the market closed higher, lower, or flat, the pivot point is calculated differently. This method provides only one support and one resistance level, rather than multiple levels. It is useful for spotting potential breakouts or reversal zones, especially when traders want to keep their charts simple. Demark pivots are more popular among advanced or positional traders who want a cleaner chart and focus on major price movements, not intraday noise.
The formula to calculate the Demark Pivot Points
If Close < Open - X = High + (2 × Low) + Close
If Close > Open - X = (2 × High) + Low + Close
If Close = Open - X = High + Low + (2 × Close)
Then,
Pivot Point (P) = X ÷ 4
Resistance = X ÷ 2 − Low
Support = X ÷ 2 − High

Pivot points help traders analyse the market conditions to make quick decisions and shape their portfolio. The importance and use of pivot points can be explained hereunder.
Pivot Points give a quick idea of the market trend. If the price is trading above the pivot point, it shows a bullish (upward) trend. If it’s below, the market is considered bearish (downward). This helps traders decide whether to look for buying or selling opportunities.
Pivot Points automatically provide key levels called Support (S1, S2) and Resistance (R1, R2). These are important price zones where the market may reverse or pause. Traders use these levels to place entry, exit, and stop-loss orders with better accuracy.
Intraday traders, especially in Nifty and Bank Nifty, rely on fast decisions. Pivot Points are ideal for this as they are calculated from the previous day's prices and can guide trades right from the market opening.
Pivot Points are easy to calculate using just the High, Low, and Close of the previous day. Also, they are readily available on broker sites or trading apps, making them highly accessible for traders to make informed trading decisions.

The steps to trade using the pivot points are explained below.
If the market opens above the Pivot Point (P), it can indicate a bullish trend where traders can look for buying opportunities.
If it opens below the Pivot Point, it can indicate a bearish trend where traders can look for selling opportunities.
When the price comes close to S1 or S2 and shows signs of bouncing up (like a green candle), it can be a good buying zone.
Place a stop-loss slightly below the support level.
When the price goes near R1 or R2 and starts falling, it is often a selling signal.
Place a stop-loss slightly above the resistance level.
If the price breaks above R1 with strong volume, it may move toward R2, traders should consider buying the breakout.
If the price breaks below S1, it may fall toward S2, traders should consider short selling.
Combine with tools like RSI, MACD, or Moving Averages to confirm signals.
If traders buy near Pivot or S1, consider booking profits at R1 or R2.
If traders sell near R1, book profits at Pivot or S1.
Points to remember -
On high-volatility days (like budget day or RBI announcement), prices may break multiple pivot levels.
On low-volatility days, prices may stay between S1 and R1, which is ideal for quick intraday trades.
Intraday traders use daily pivot points.
Swing traders can use weekly pivots.
Positional traders may follow monthly pivot levels for long-term decisions.

Pivot points can be used in several trading strategies and in combination with trading indicators to assess and analyse the prevailing market conditions and make suitable trading decisions.
This strategy is used when the price breaks above a resistance (like R1) or falls below a support (like S1). If the breakout happens with high volume, it can signal a strong move. Traders often buy when the price breaks above R1 or sell when it breaks below S1. Stop-loss is placed just outside the breakout level, and the next pivot level (R2 or S2) is used as the target.
In this strategy, traders look for price reversal signals near the pivot levels. For example, if the price touches S1 and starts rising, it could be a buy signal. Similarly, if it hits R1 and drops, it may be a sell signal. This strategy works well in range-bound or sideways markets and is commonly used by intraday traders.
Many traders combine Pivot Points with Moving Averages (like 20 EMA or 50 EMA). If the price is above the pivot and also above the moving average, it confirms a bullish trend. If both are below, it shows a bearish trend. This combination helps filter out false signals and confirms the strength of the trend.
RSI is used to measure market strength. When RSI is above 50 and price is above the Pivot Point, it supports a buy trade. If RSI is below 50 and price is below the Pivot, it supports a sell trade. Traders use this combo to avoid emotional trades and improve trade accuracy.
Some traders look for candlestick reversal patterns (like Doji, Hammer, Engulfing) near pivot levels. For example, a bullish engulfing candle near S1 could be a strong buy signal. These patterns help confirm the price action near pivot zones.
Traders use pivot points from different timeframes for stronger confirmation. For example, use daily pivots for intraday trades and weekly pivots for swing trades. If both show support at the same level, it becomes a stronger zone to trade from.
Pivot Points are a simple yet powerful tool that helps traders understand the market direction and identify key levels for entry, exit, and stop-loss. Pivot points can be used in diverse forms of trading, whether intraday, swing trading or positional trading, making it a dynamic resource that is easily accessible and available for traders to help them build successful trading portfolios.
We hope this article is able to provide valuable details on an important topic of technical analysis and its use for traders. Let us know your thoughts on this topic or if you need further information on the same, and we will address it.
Till then, Happy Reading!
Read More: What is the Pinbar Candlestick Pattern and How to trade it?
Marisha Bhatt is a financial content writer @TrueData.
She writes with the sole aim of simplifying complex financial concepts and jargon while attempting to clarify technical and fundamental analysis concepts of the stock markets. The ultimate goal is to spread vital knowledge and benefit the maximum audience. Her Chartered Accountant background acts as the knowledge base to help clarify crucial concepts and create a sound investment portfolio.
how to use pivot points with 100 success rate
hello, Pivot points aid in technical analysis by indicating support and resistance levels but do not ensure 100 success in trading strategies.
Yes Sir, that is a correct analysis. Pivot points are helpful for spotting support and resistance levels, but like any tool, they do not guarantee success; hence, it is important to always use them with other indicators for better results.
There is no 100 success rate with pivot points or any trading tool, as markets are always uncertain. The use of pivot points with other indicators and proper risk management can significantly improve your chances of success. We hope this resolves your query! Keep reading and engaging more with TrueData for more interesting content.
hello, Pivot points aid in technical analysis by indicating support and resistance levels but do not ensure 100 success in trading strategies.
Thanks for sharing your thoughts! Yes, pivot points are quite an important tool in technical analysis, but they do not ensure a 100 success rate in trading strategies. Let us know your thoughts on our other topics too.. We are waiting to hear more from you!
Good and useful for beginners in trading
Thank you, we are glad the blog resonates so well with you. Let us know your thoughts on our other topics too. We are looking forward to hearing more from you!
The most comprehensive explanation regarding the pivot points indicator. thanks truedata
Thank you so much for your kind words of appreciation! It is feedback like this that encourages us to keep striving to provide quality content for our readers! Keep reading and engaging with TrueData for more informative content on diverse topics!
What is the accuracy of pivot point strategy?I mean on percentage basis
The accuracy of a pivot point strategy can vary widely depending on the market, timeframe, and how it is combined with other indicators. It is difficult to give a fixed percentage, but it is best used as a guide rather than a guaranteed prediction.
Good blog
Thank you so much!
Very informative read. The practical explanation of S1, S2, R1, and R2 levels makes it easier for new traders to understand entry and exit zones.
Thank you! Glad the explanation of S1, S2, R1, and R2 levels helped simplify entry and exit zone concepts for new traders. Appreciate your feedback!
Good Blog. The combination of pivot points with candlestick patterns and indicators was explained really well. This approach can definitely improve trade confirmation accuracy.
Thank you! Glad you found the explanation useful. Combining pivot points with candlestick patterns and indicators can indeed help traders make more confident and accurate trade decisions.
Excellent overview of pivot points and their role in market analysis.
Thank you for your feedback! We are glad you found the overview helpful.
I appreciate that the blog also discusses common mistakes and the importance of using pivot points alongside other indicators. That's practical advice for traders.
Thank you for your thoughtful feedback! You are absolutely right, pivot points work best when combined with other indicators such as volume, moving averages, or price action analysis. Avoiding common mistakes and using multiple confirmations can help traders improve the reliability of their trading decisions.
Thanks for simplifying such a technical topic. Looking forward to more articles on practical options trading strategies.
Thank you for your feedback! We are glad you found the explanation of Pivot Points easy to understand. We will continue sharing more practical articles on trading strategies and market analysis to help traders build their knowledge and confidence.
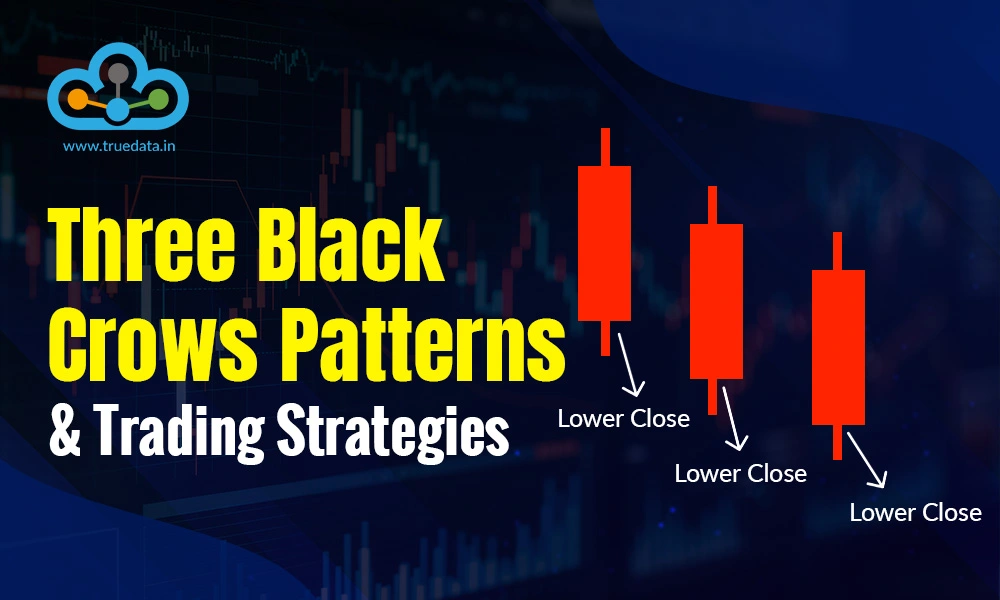
The red and green candlesticks on a chart may look like chaos at first glance. B...
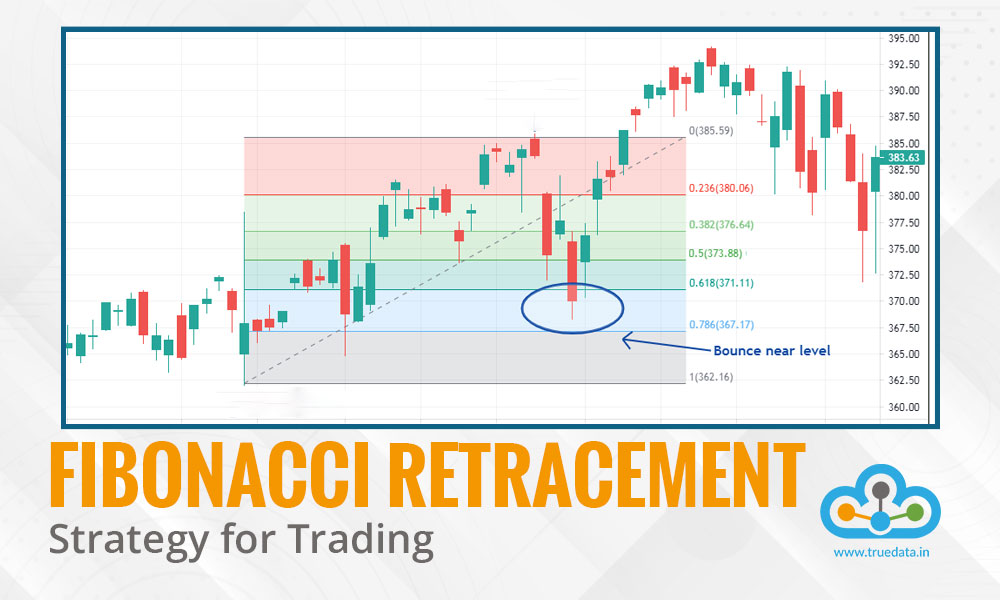
If you are a trader, then you would have definitely heard the term Fibonacci ret...

In the world of high-speed trading, success often hinges on capitalising on even...