 The technical aspect of stock trading is fast-paced and focuses on the daily price and volume movements of the stocks or other assets to make effective trading decisions. Candlesticks are one of the key tools of technical analysis that traders use on a daily basis in order to have a better understanding of the stocks and the markets in general. One of the popular candlestick patterns that are often used by traders is the Morning Star candlestick pattern. Check out this blog to know about this candlestick pattern and how to use it to make trading decisions. Read More: Stochastic oscillator - All you need to know
 The Morning Star candlestick pattern is a bullish reversal pattern commonly used in technical analysis by traders. It is a versatile candlestick pattern that can be used in multiple securities like stock, currency pair, or commodity. It typically appears on price charts and signifies a potential shift in market sentiment from bearish (downward) to bullish (upward). This pattern involves three candles to form the pattern. These three candles are broken down in the following manner.
 This pattern is easy to identify and understand and therefore can be used by beginners and seasoned traders as well. The steps to identify the morning star candlestick pattern are explained below.
 The Morning Star candlestick pattern is a powerful technical indicator that provides valuable information to traders in India and worldwide. This pattern typically forms after a downtrend and serves as a bullish reversal signal, suggesting a potential shift from a bearish (downward) market sentiment to a bullish (upward) one. Here's a detailed explanation of what the Morning Star pattern indicates.
The Morning Star pattern is a three-candlestick pattern that appears after a downtrend. The first candle is a long bearish (downward) candle, indicating that sellers have been in control. The second candle is a small-bodied candle that shows indecision in the market, often referred to as a "doji" or a small spinning top. The third candle is a long bullish (upward) candle, signalling that buyers are gaining control. This transition from a strong bearish sentiment to a bullish one suggests a potential reversal of the downtrend.
As mentioned, the first candle represents strong selling pressure, and the second candle suggests uncertainty or a tug-of-war between buyers and sellers. The third candle, a bullish one, demonstrates that buyers have gained the upper hand. This shift in sentiment from bearish to bullish is a critical aspect of the Morning Star pattern.
Traders view the Morning Star pattern as a signal to consider entering a long (buy) position. However, it's essential to wait for confirmation and not enter the trade prematurely. This pattern is seen as an opportunity to take advantage of potential upward price movement following a downtrend.
While the Morning Star pattern is a strong bullish reversal signal, it doesn't guarantee a reversal. Traders often use it in conjunction with other technical analysis tools, such as trendlines, support and resistance levels, and oscillators, to increase their confidence in the potential reversal. It's a tool that suggests a higher probability of a bullish reversal, but it should be part of a broader trading strategy.
Setting a stop-loss order is crucial to managing risk when trading the Morning Star pattern. Traders typically place their stop-loss just below the low of the first bearish candle in the pattern. This level serves as a safety net to limit potential losses if the anticipated reversal does not materialize.
After identifying the Morning Star pattern and confirming the reversal, traders can set target prices based on various technical analysis techniques. Common methods include measuring the distance from the lowest point of the pattern to the highest point and projecting it upward. Targets help traders determine where to take profits as the price moves upward.
Although not a strict requirement, analyzing trading volume can enhance the reliability of the Morning Star pattern. Ideally, the first bearish candle should have a high volume, indicating strong selling pressure. The third bullish candle may have increasing volume, confirming the shift in sentiment as more buyers enter the market. Volume analysis can provide valuable insights into the strength of the reversal.
The morning star candlestick pattern is a prominent pattern in identifying trend reversal and thereby aiding traders in their trading decisions. However, it is important to note that this pattern should be supported by significant volume to successfully identify the same and implement the trading strategy or identify entry and exit points. While the Morning Star pattern itself is a strong signal, traders should wait for additional confirmation. This can come from subsequent bullish candles or other technical indicators, such as moving averages or momentum oscillators, that support the reversal signal. The more confirmation, the stronger the case for a reversal. We hope this blog was able to help you understand the basics of the morning star candlestick pattern. Do let us know if you need further details on this topic or any other candlestick pattern. Till then Happy Reading!
Marisha Bhatt is a financial content writer @TrueData.
She writes with the sole aim of simplifying complex financial concepts and jargon while attempting to clarify technical and fundamental analysis concepts of the stock markets. The ultimate goal is to spread vital knowledge and benefit the maximum audience. Her Chartered Accountant background acts as the knowledge base to help clarify crucial concepts and create a sound investment portfolio.
Types of posts about candlestick patterns in your blog was great.
Thank you! We are happy these posts could provide you with valuable information. Keep exploring the blog, and also feel free to suggest any topics that you would like us to take up next!
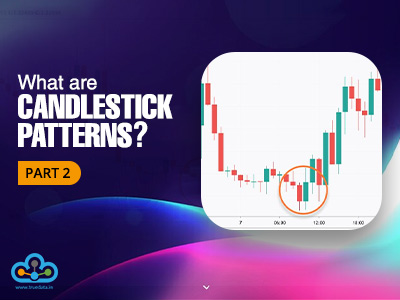
Candlestick patterns are among the most basic and common tools traders use to cr...
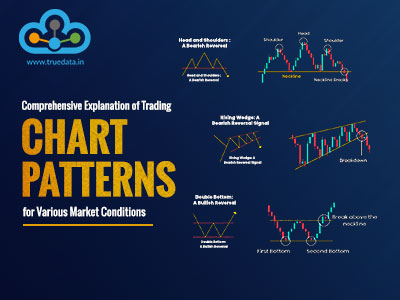
The use of technical analysis for trading is vital for creating a successful tr...
Stock markets have been under a lot of pressure in the past week and investors ...