
Technical analysis is the study of the price and volume movement of a stock or a security. To have an effective analysis of these key factors, traders use many technical indicators to spot suitable entry and exit points while sticking to their trading plan. However, do you know that many traders do not use any of the fancy technical indicators but rely solely on the price action trading for technical analysis of their target securities? So what is this price action trading and how is it useful to traders? Here is all you need to know about price action trading to advance in your technical analysis journey.
Read More: How to Select Stocks for Intraday Trading?
Price action trading is a strategy employed by traders and involves the analysis and decision-making based on the real-time price movements of financial instruments, as opposed to relying on indicators or technical analysis tools. Traders practising this approach closely observe and interpret candlestick patterns, chart formations, and support/resistance levels to make informed trading decisions. By concentrating on the unadulterated price movements, traders aim to identify potential shifts in trends, breakout points, or crucial levels that present buying or selling opportunities. This methodology underscores the significance of comprehending market psychology and interpreting price patterns to derive insights into potential future price movements.
Price action trading is alternatively known as 'clean chart trading,' 'naked trading,' or 'raw/natural trading.' Some of the popular price action trading strategies are explained hereunder.

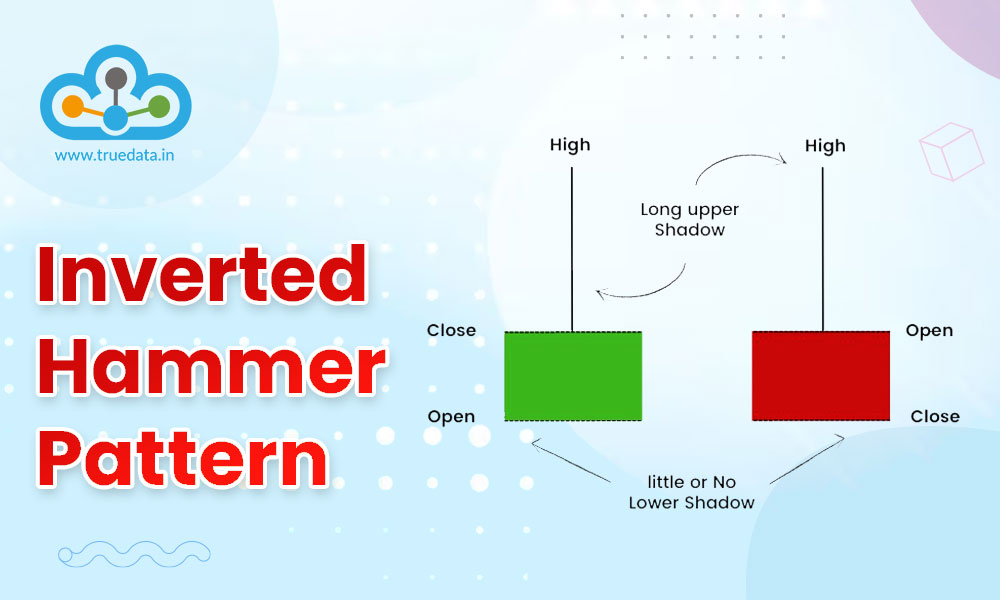
The Pin Bar strategy is a cornerstone of price action trading, relying on the identification of specific candlestick patterns known as pin bars. A pin bar is characterised by a long tail or wick, which represents a rejection of higher or lower prices by the market. Traders employing this strategy often look for pin bars at key support or resistance levels, interpreting them as potential signals for a reversal in the current trend. The long wick signifies a strong rejection of the price at that level, providing traders with insights into market sentiment and potential upcoming price movements. The strategy involves entering trades based on the perceived significance of these pin bar formations in predicting trend reversals.

The Inside Bar strategy revolves around identifying a specific candlestick pattern where the current candle's price range is contained within the high and low of the preceding candle. This pattern suggests a period of consolidation or indecision in the market. Traders using this strategy wait for a breakout, entering a trade when the price moves beyond the high or low of the inside bar. The breakout is seen as an indication of the potential continuation of the prevailing trend. This strategy is effective in capturing momentum in the market, providing traders with a clear entry signal based on the resolution of the inside bar pattern.

The Head and Shoulders pattern is a recognizable reversal pattern in price action trading. Traders identify this pattern by recognizing three peaks on a price chart, namely, a higher peak (head) between two lower peaks (shoulders). The neckline, formed by connecting the lows of the two shoulders, becomes a critical level. A break below the neckline is considered a bearish signal, suggesting a potential reversal to the downside. Conversely, a break above the neckline is seen as a bullish reversal signal. Traders using this strategy anticipate trend reversals based on the distinctive pattern formation.

The Engulfing Candlestick strategy involves recognizing engulfing patterns, where a larger candle completely engulfs the previous one. A bullish engulfing pattern occurs when a green candle fully engulfs the preceding red candle, suggesting a potential upward reversal. Conversely, a bearish engulfing pattern, where a red candle engulfs the previous green one, indicates a potential downward reversal. Traders using this strategy interpret these patterns as strong signals of a shift in market sentiment and often use them to make buying or selling decisions, depending on the type of engulfing pattern observed.

Support and resistance levels are fundamental concepts in price action trading. Traders identify key levels on a price chart where the price has historically reversed direction. The strategy involves buying at support levels and selling at resistance levels, taking advantage of potential price bounces. Breakouts or breakdowns from these levels can also signal potential trend changes, and traders using this strategy incorporate these observations into their decision-making process. This approach emphasises the importance of historical price levels in influencing future market movements.

Trendline trading is a strategy that relies on drawing trendlines on a price chart to identify the prevailing trend. Traders connect successive higher lows in an uptrend or lower highs in a downtrend to form trendlines. The strategy involves entering trades when the price bounces off a trendline, considering it a confirmation of the trend's strength. Trendline trading helps traders align their positions with the overall market direction, providing a visual guide to potential entry and exit points based on the dynamics of the established trend.

Trend continuation patterns are a subset of price action strategies that focus on identifying formations suggesting the continuation of an existing trend. Examples include flags, pennants, and rectangles, which typically occur during periods of consolidation within a trend. Traders using this strategy interpret these patterns as signals that the prevailing trend is likely to resume after a brief consolidation. This allows them to position themselves for potential continuation of the established market direction.

Range trading is a strategy employed by traders to capitalise on price oscillations within a defined range. Traders identify key support and resistance levels, between which the price tends to fluctuate. The strategy involves buying at support and selling at resistance, taking advantage of the price bouncing between these established boundaries. Range trading is particularly suitable when there is no clear trend in the market, and traders aim to profit from the predictable price movements within the identified range.

Incorporating Fibonacci retracement levels into price action analysis is a strategy that draws on mathematical ratios to identify potential reversal points in a trend. Traders using this approach apply Fibonacci levels to significant price swings, looking for retracements at key levels such as 38.2%, 50%, and 61.8%. These levels act as potential support or resistance zones, influencing trading decisions. Traders may enter or exit positions based on the proximity of the price to these Fibonacci retracement levels, adding a quantitative dimension to their price action analysis.
Price action trading involves a clear understanding of various concepts of technical analysis like identifying trading signals, employing suitable risk management techniques, sound ability to read price charts and candlestick patterns, etc. A brief trading plan for implementing price action trading is explained hereunder.
Traders can start by keenly observing and analysing real-time price movements without relying on conventional indicators.
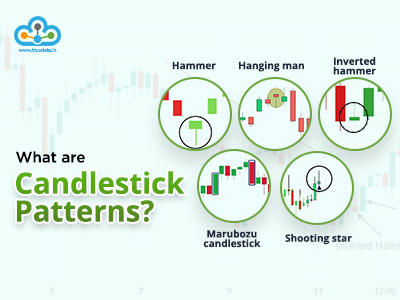
Price action traders pay close attention to candlestick patterns, interpreting them for insights into market sentiment and potential reversals.
Traders can also identify and analyse chart patterns, such as triangles and head and shoulders, to anticipate future price movements.
The focus should be on determining key support and resistance levels on charts to comprehend potential reversal areas.
Traders should also conduct a thorough analysis of the prevailing trend, aligning strategies with the market trend for entry or exit points as well as actively monitor breakouts, recognizing critical points where the price signals a potential shift in the trend.
Risk management in price action trading is of paramount importance, therefore, traders should implement effective risk management strategies, including setting stop-loss orders for disciplined trading.
Price action trading also involves understanding the overall market psychology to anticipate the reactions of other participants to observed price movements.
The key to successful price action trading is patience, avoiding impulsive decisions, and adhering to the chosen strategy for long-term success. Furthermore, traders should also commit to continuous learning, adapting to market changes, and refining strategies for resilience and adaptability in their trading plans.
For effective price action trading, it is also important to understand the advantages and the pitfalls of the same. A brief analysis of the pros and cons of price action trading is tabled below.

Price action trading is referred to as the purest form of trading which relies solely on the trader’s understanding of the market sentiment and the ability to gauge future price movements. It is therefore a riskier form of trading, especially for novice traders. However, with gradual success in creating a sound trading portfolio, traders can gain enough understanding of their target securities and the overall market to successfully execute price action trading.
We hope this blog was able to provide valuable insights into price action trading and simplify it further. Let us know if you have any queries or need more information on this topic and we will address them.
Till then Happy Reading!
Marisha Bhatt is a financial content writer @TrueData.
She writes with the sole aim of simplifying complex financial concepts and jargon while attempting to clarify technical and fundamental analysis concepts of the stock markets. The ultimate goal is to spread vital knowledge and benefit the maximum audience. Her Chartered Accountant background acts as the knowledge base to help clarify crucial concepts and create a sound investment portfolio.

The dollar exchange rate is constantly in the news and is often seen as a measu...

When we take our first step into the trading game, we choose the best resource...
Trend trading is one of the most popular forms of trading for a trader, especial...
Stock investing and trading are becoming primary and secondary sources of incom...