 The stock markets for the past many weeks have been crossing one milestone after the other. Experts say that Indian stock markets are clearly in an uptrend and it is here to stay till the market corrects itself or there is major news that will rock the markets. Trend traders are therefore buzzing in action trying to capitalise on this trend and make the most of it. So what is trend trading and can a new trader maximise their returns through trend trading? Read on to know the meaning of trend trading and how you can use it to create a successful trading portfolio. Read More: How to select stocks for intraday trading?
The term "trend" refers to the general direction in which the price or value of an asset is moving over a certain period of time. It represents the prevailing sentiment and momentum in the market, indicating whether the price is primarily going up (uptrend), down (downtrend), or moving sideways (range-bound or consolidating). Trend trading is a strategy commonly employed by investors and traders to take advantage of the directional movement or trend of a specific asset, such as stocks, currencies, or commodities. The primary objective of trend trading is to identify established trends and capitalise on the momentum present in the market. The strategy revolves around the belief that assets or securities tend to move in sustained trends.Trend traders seek to align themselves with the prevailing trend and profit from its continuation.
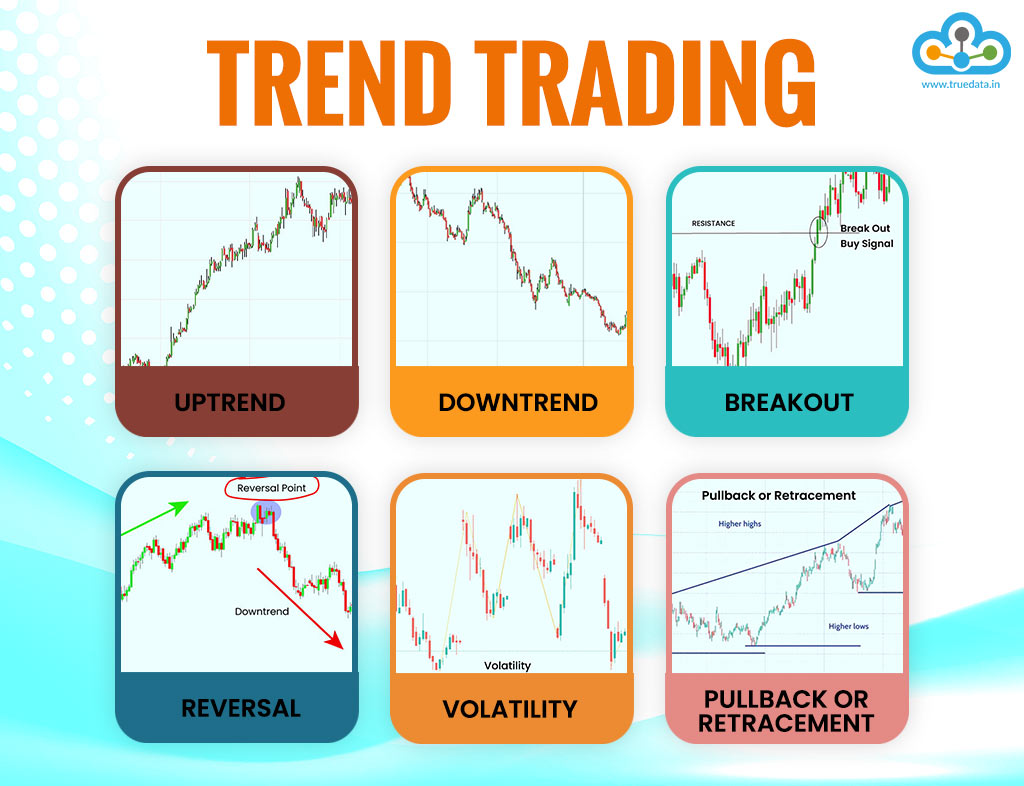
As a new trader, it's essential to understand the various trends that can occur in the market. These trends reflect the direction and movement of asset prices over time. Market trends can occur across various timeframes, ranging from short-term intraday trends to long-term trends spanning months or even years. As a trader, it's essential to identify and analyse the prevailing trend in the timeframe relevant to your trading strategy. Here are some key trends that you should be aware of:
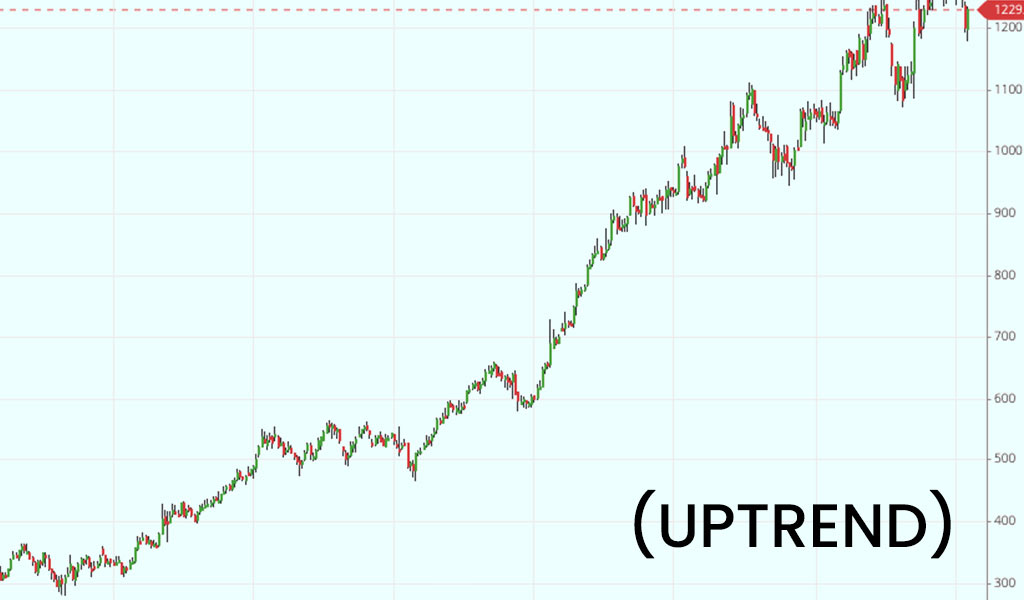 An uptrend occurs when the price of an asset consistently moves higher over a specific period. It signifies a bullish market sentiment, with buyers dominating and pushing prices upward. During an uptrend, higher highs and higher lows are commonly observed on price charts.
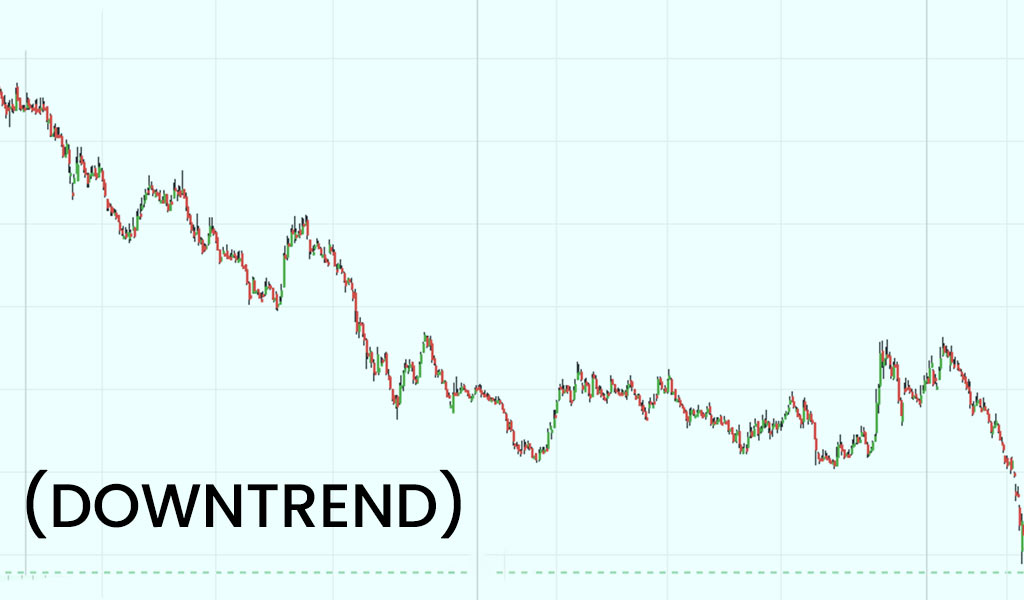 A downtrend, on the other hand, happens when the price of an asset consistently declines over time. It reflects a bearish market sentiment, where sellers outnumber buyers, resulting in downward price movement. Lower highs and lower lows are typically seen during a downtrend.
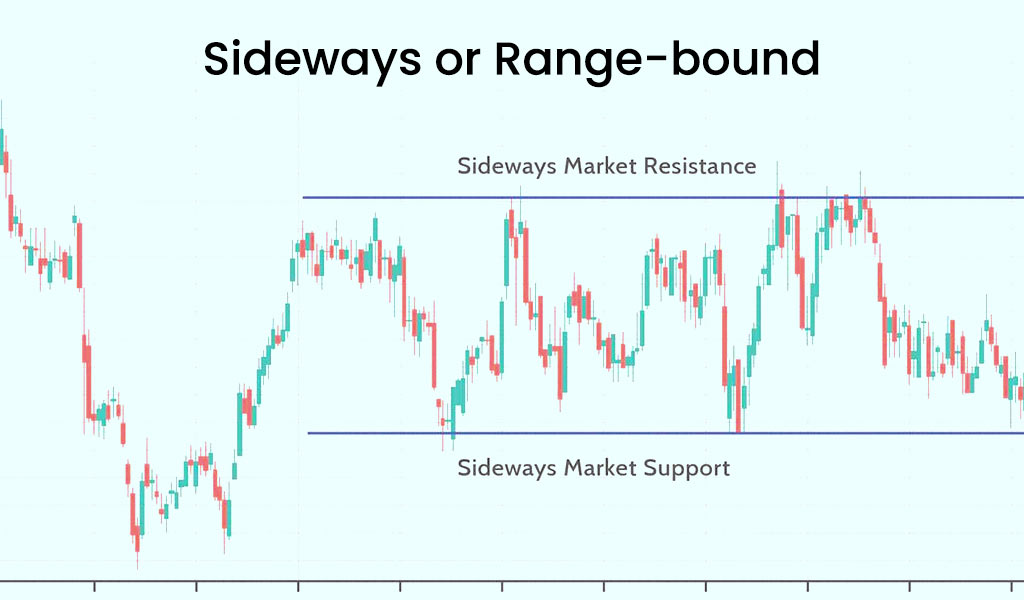 In a sideways or range-bound trend, the price of an asset remains relatively flat, trading within a specific range. This occurs when the buying and selling pressures are balanced, resulting in a period of consolidation. During this trend, the price fluctuates between a support level (lower boundary) and a resistance level (upper boundary), creating a trading range.
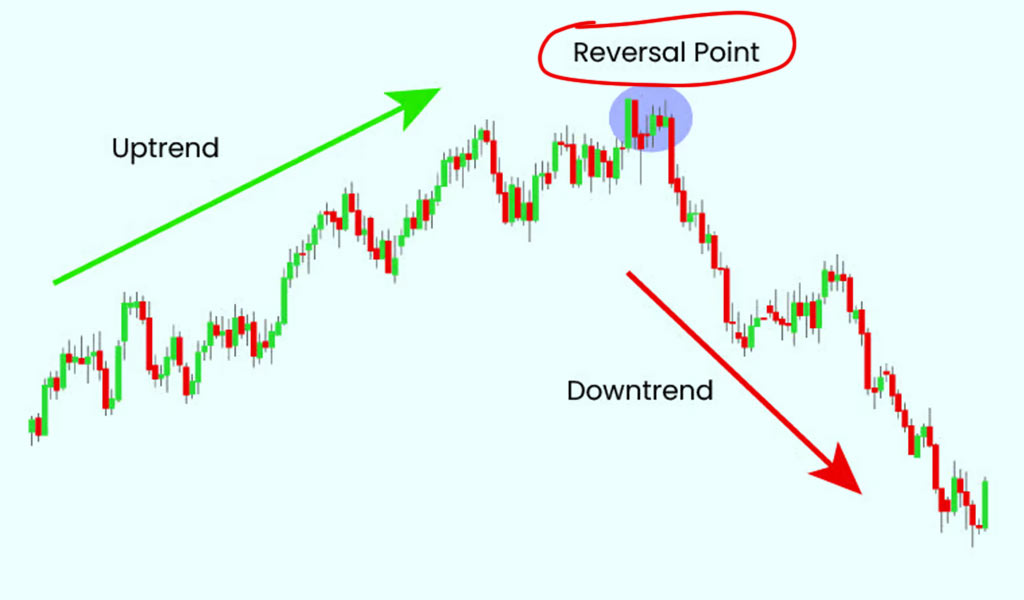 A reversal trend signifies a change in the prevailing direction of an asset's price movement. For example, an uptrend may reverse into a downtrend or vice versa. Reversal trends often occur after an extended period of one particular trend and can present opportunities for traders to enter new positions.
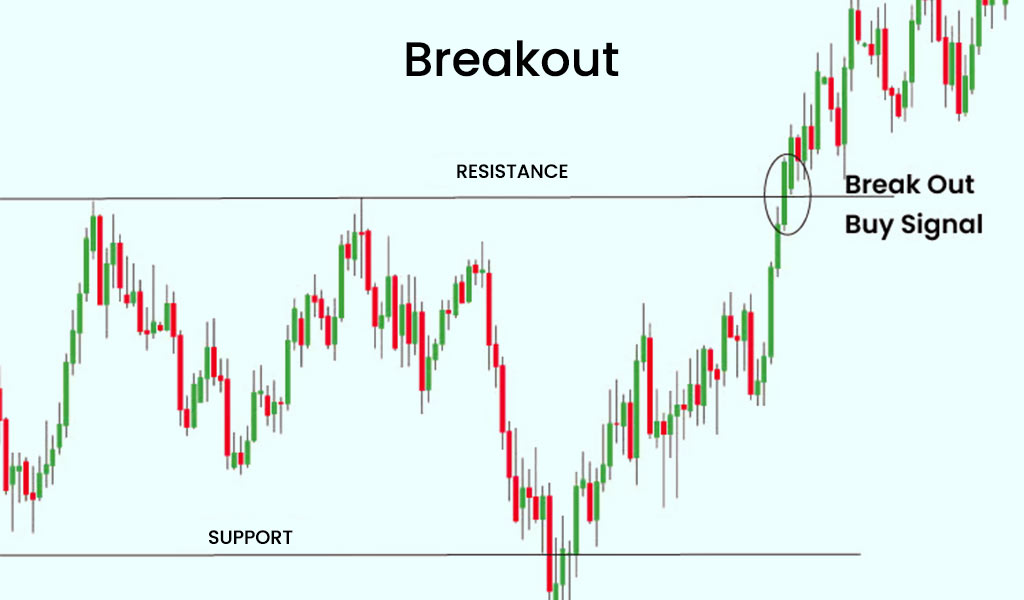 A breakout occurs when the price of an asset moves above a significant resistance level in an uptrend or below a key support level in a downtrend. Breakouts can indicate the beginning of a new trend or a continuation of the existing trend, providing trading opportunities for traders to capitalise on the momentum.
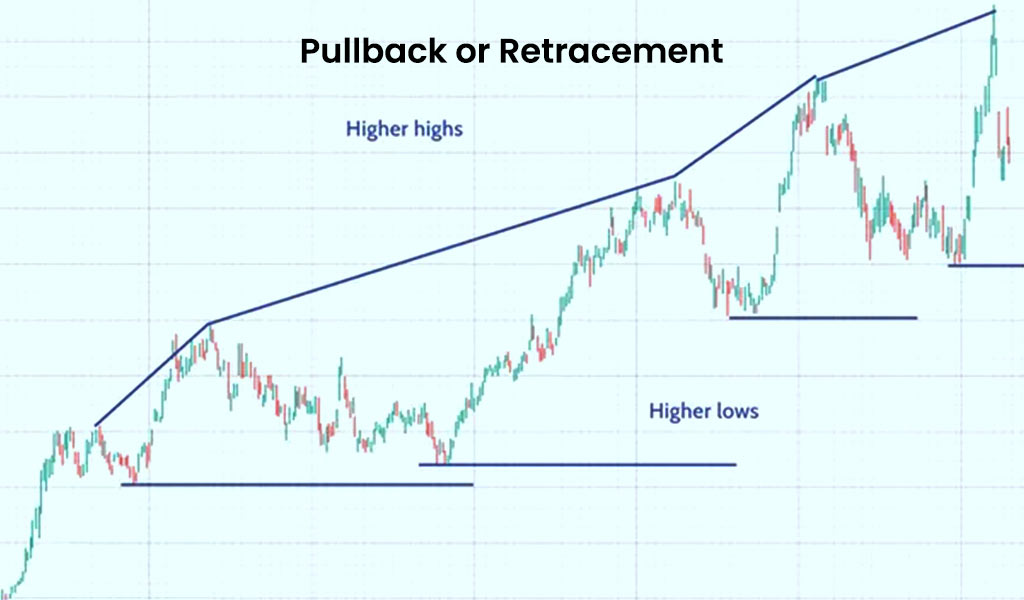 Pullbacks are temporary reversals within the context of an ongoing trend. They are often seen as short-term price corrections against the primary trend. Pullbacks can offer potential entry points for traders to join the prevailing trend at more favourable prices.
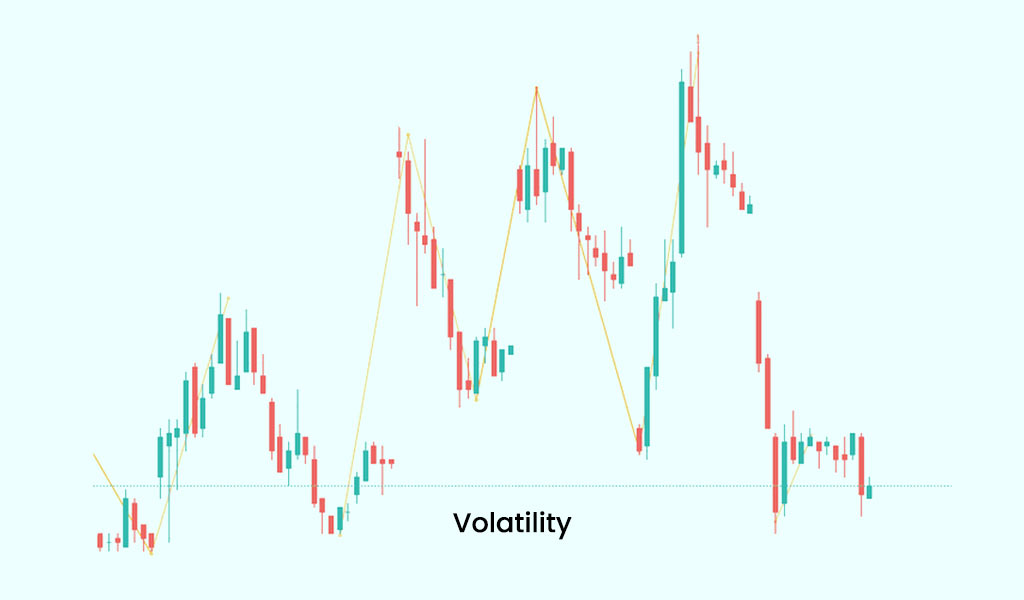 Volatility refers to the degree of price fluctuation in the market. High volatility is characterised by rapid and significant price movements, while low volatility reflects relatively stable price action. Understanding volatility is crucial for adjusting trading strategies and risk management.
To effectively implement trend trading, it is important to understand a few popular trend trading strategies that can be used to capitalise on market trends. These strategies provide frameworks for identifying trends, entering trades, and managing risk. Here are a few popular trend trading strategies that traders can use to create their trading portfolio.
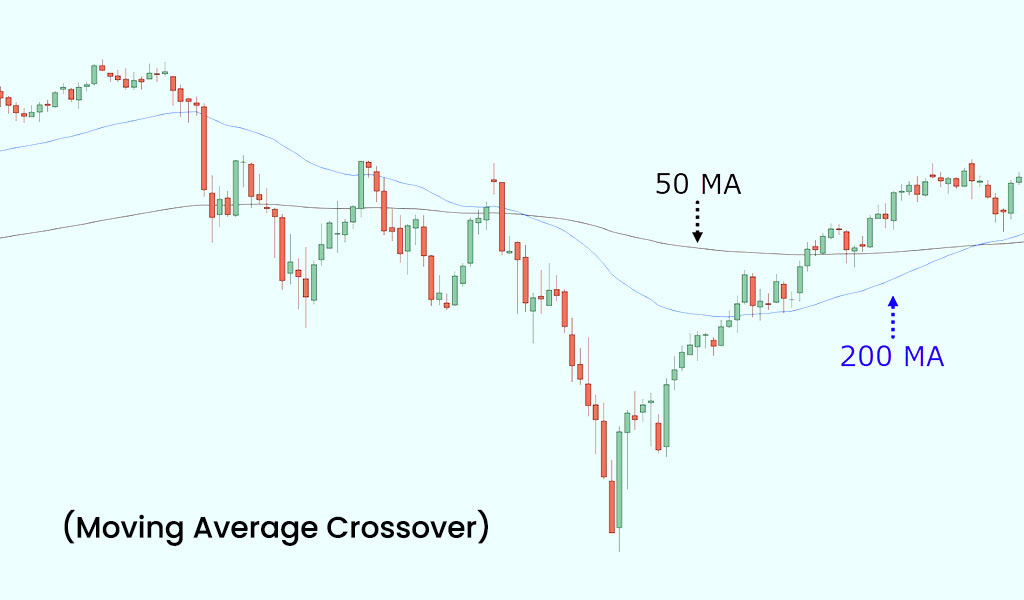 This strategy involves using two or more moving averages to identify trend reversals and generate trading signals. The most common approach is to use a shorter-term moving average (e.g., 50-day) and a longer-term moving average (e.g., 200-day). When the shorter-term moving average crosses above the longer-term moving average, it signals a potential uptrend and may be considered a buy signal. Conversely, when the shorter-term moving average crosses below the longer-term moving average, it signals a potential downtrend and may be considered a sell signal.
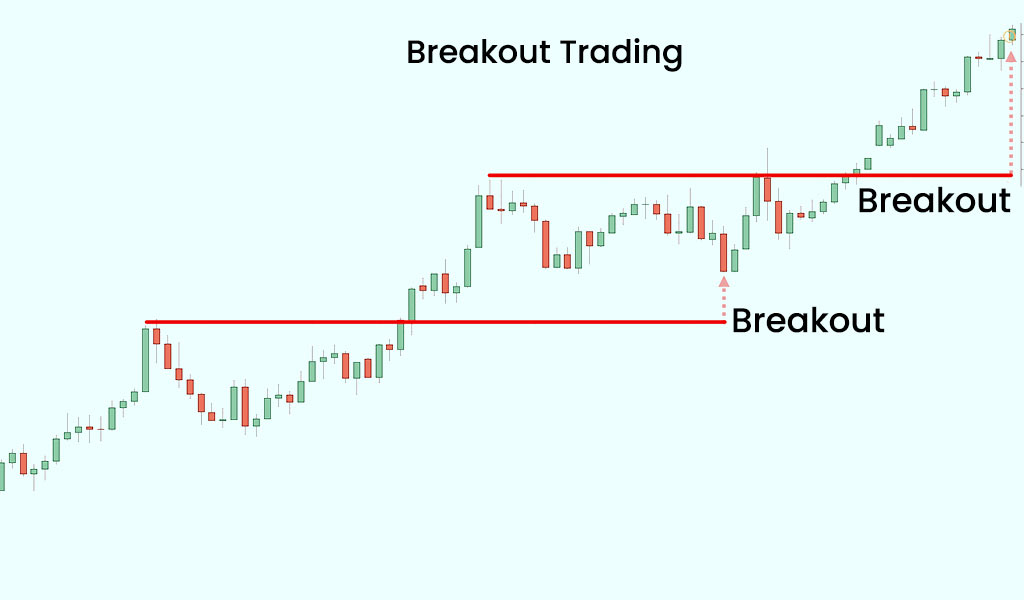 Breakout trading involves identifying key levels of support or resistance and entering trades when the price breaks out above resistance in an uptrend or below support in a downtrend. Traders often use chart patterns, such as triangles, rectangles, or channels, to identify potential breakouts. Once a breakout occurs, traders may enter trades in the direction of the breakout, aiming to profit from the continuation of the trend.
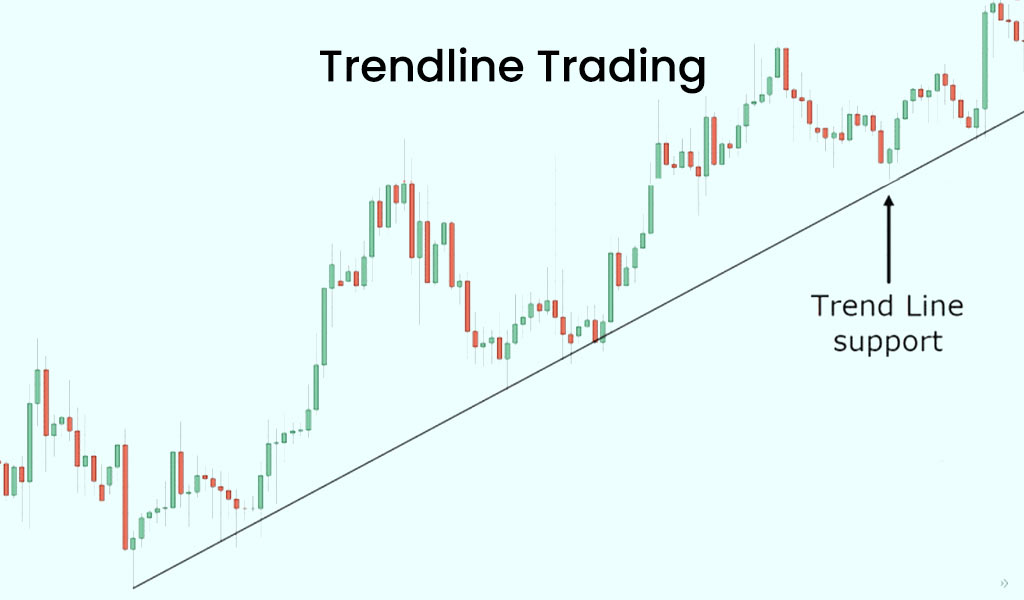 Trendlines are lines drawn on price charts to connect consecutive highs or lows. Trendline trading involves identifying and drawing trendlines to visualise the prevailing trend. Traders look for price interactions with the trendline, such as bounces or breaks, to determine potential entry and exit points. When the price bounces off an upward trendline, it may be considered a buy signal, while a break below a downward trendline may be considered a sell signal.
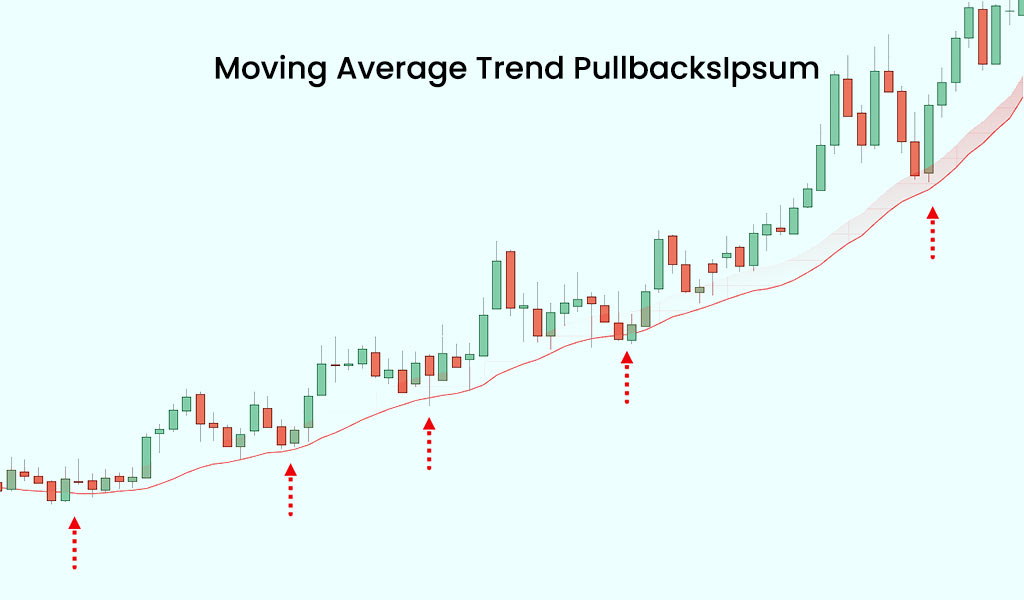 In this strategy, traders use moving averages as dynamic support or resistance levels within an established trend. When the price of an asset pulls back to a moving average during an uptrend, it may present an opportunity to enter a buy trade if the trend is expected to continue. Conversely, during a downtrend, a pullback to a moving average may provide an opportunity to enter a sell trade if the trend is expected to persist.
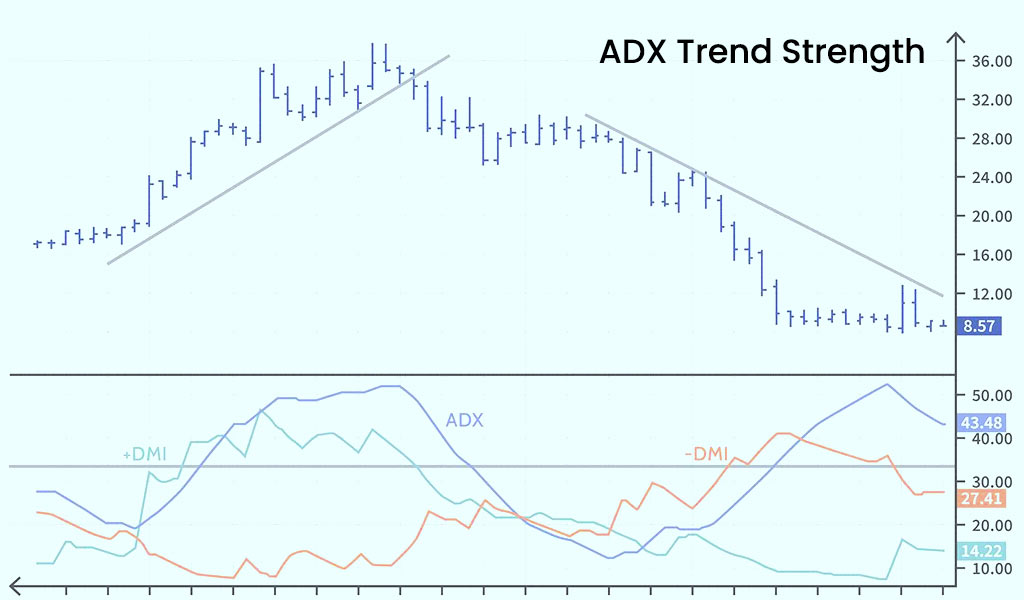 The Average Directional Index (ADX) is an indicator used to assess the strength of a trend. Traders using this strategy monitor the ADX to identify strong trending conditions. A rising ADX reading above a certain threshold (e.g., 25) indicates a strengthening trend, potentially offering opportunities to enter trades in the direction of the prevailing trend. Conversely, a declining ADX reading below the threshold may suggest a weakening or range-bound market, prompting traders to be cautious.
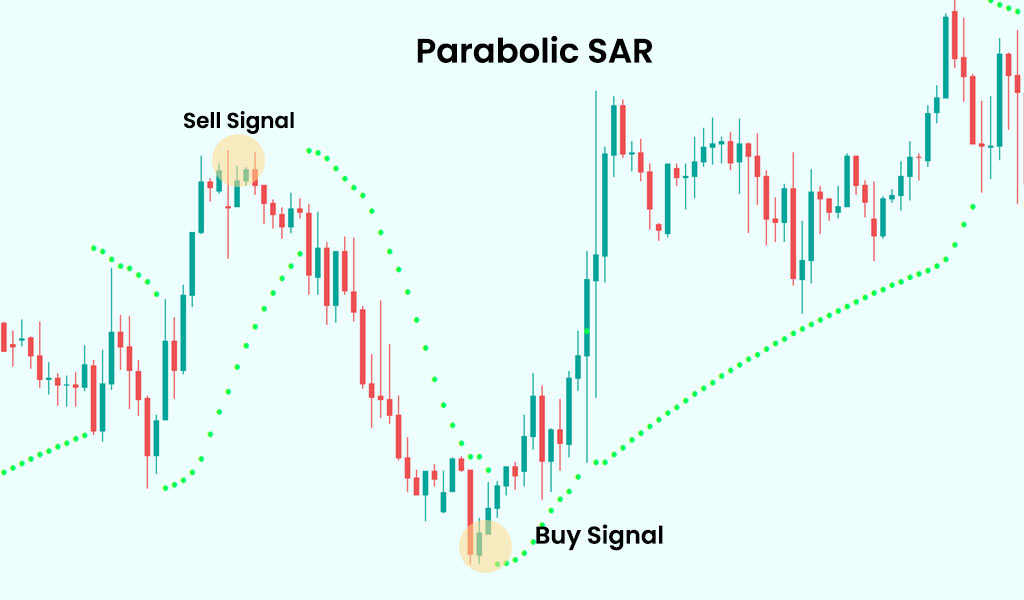 The Parabolic Stop and Reverse (SAR) indicator is a trend-following indicator that helps traders identify potential entry and exit points. The indicator places dots above or below price bars, signalling potential trend reversals. During an uptrend, the dots are placed below the price bars, suggesting buying opportunities, while during a downtrend, the dots are placed above the price bars, indicating potential selling opportunities.
Trend trading is one of the easiest trading strategies used by traders to take advantage of the directional movement or trend of an asset. It involves identifying established trends and capitalising on the momentum in the market. It is important to note that risk management is crucial in trend trading, involving position sizing, setting stop-loss orders, and adhering to trading plans. Therefore, continuous monitoring of trades and market conditions is important in trend trading. We hope that this blog was successful in providing a basic understanding of trend trading and its key elements. Do let us know if you have any queries regarding the same or need more information on this topic. Till then Happy Reading!
Marisha Bhatt is a financial content writer @TrueData.
She writes with the sole aim of simplifying complex financial concepts and jargon while attempting to clarify technical and fundamental analysis concepts of the stock markets. The ultimate goal is to spread vital knowledge and benefit the maximum audience. Her Chartered Accountant background acts as the knowledge base to help clarify crucial concepts and create a sound investment portfolio.

The dollar exchange rate is constantly in the news and is often seen as a measu...

When we take our first step into the trading game, we choose the best resource...
Trend trading is one of the most popular forms of trading for a trader, especial...
Stock investing and trading are becoming primary and secondary sources of incom...