 The use of technical analysis for trading is vital for creating a successful trading portfolio. It involves the use of various tools like indicators, stock chart patterns, candlestick and more. But if you are a novice trader how do you understand the movement of price and volume of assets using stock chart patterns? Check out this blog to understand the trading chart patterns and create a successful trading portfolio. Read More: Stock Charts - Beautiful vs Accurate
Stock charts are graphical representations of a stock's price movements over time. They display historical data in the form of candlesticks, lines, or bars, providing crucial information to traders. These charts help traders analyse trends, identify key support and resistance levels, and make informed decisions about buying or selling stocks. Stock charts are essential tools for technical analysis, helping traders spot patterns and potential price reversals, ultimately aiding in their investment strategies and risk management.
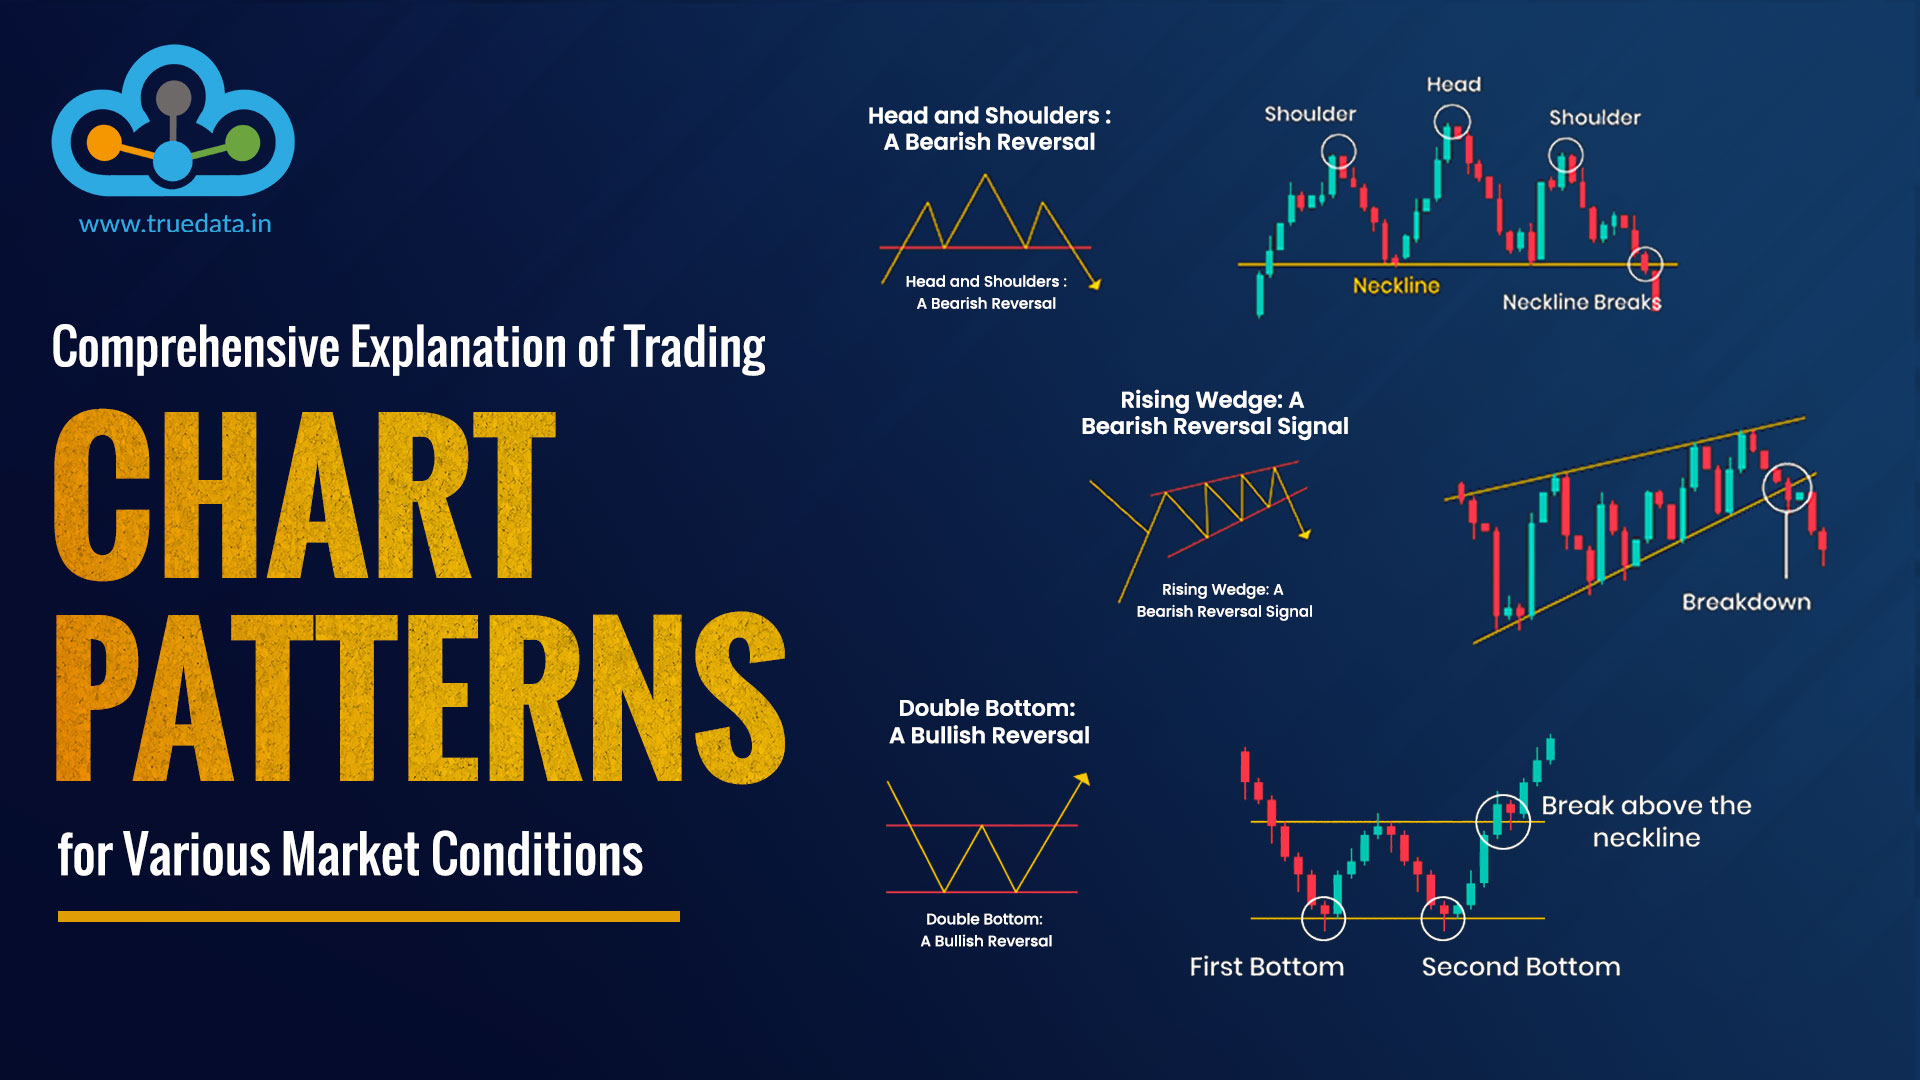
The stock charts are primarily categorised into reversal patterns and continuation patterns. Here is a snapshot of all the key chart patterns popularly used by traders. These patterns are explained in detail hereunder.
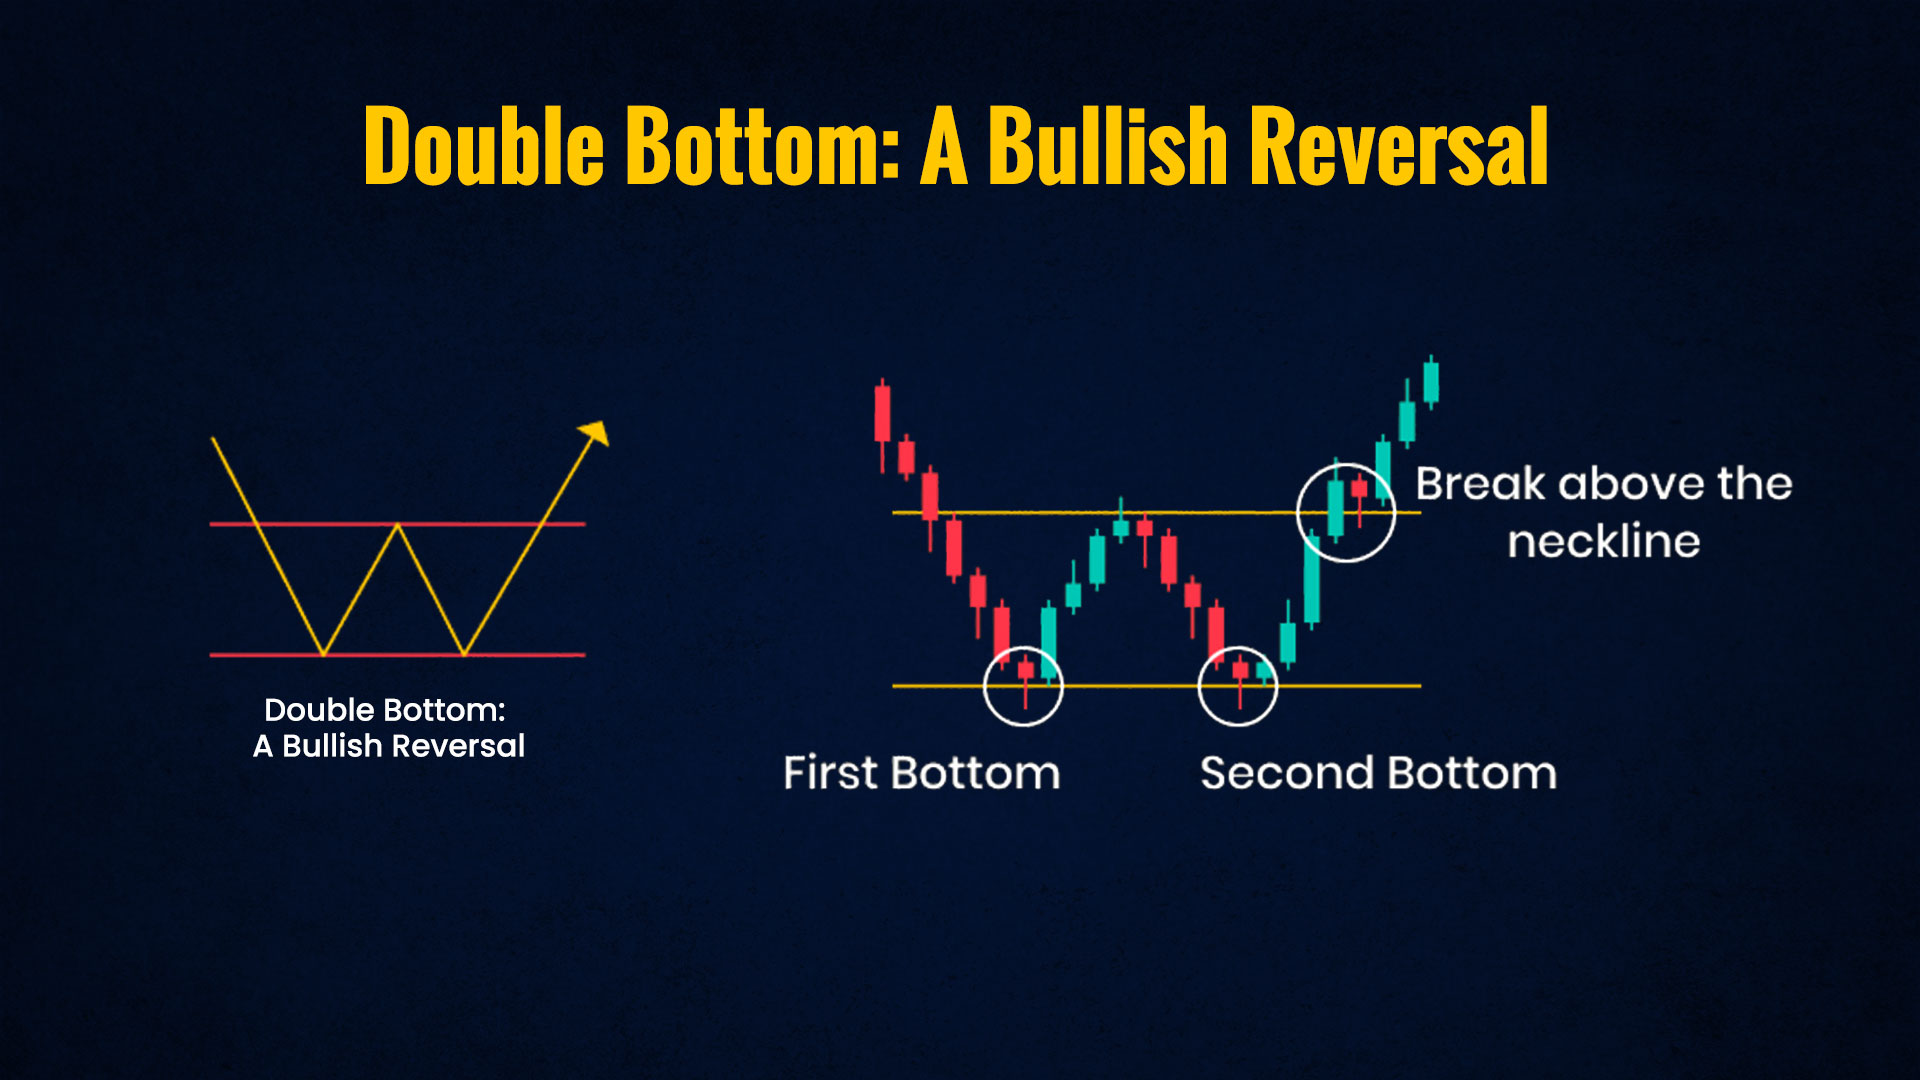 The double bottom pattern is a powerful bullish reversal signal for traders. It typically emerges after a prolonged downtrend. In this pattern, the stock price forms two distinct troughs at roughly the same level, followed by a breakout to the upside. This occurrence suggests a potential reversal of the prevailing bearish trend and a shift towards an upward trend. The double bottom pattern provides a strong indication for traders to consider buying, as it signifies that the bears may be losing their grip on the market.
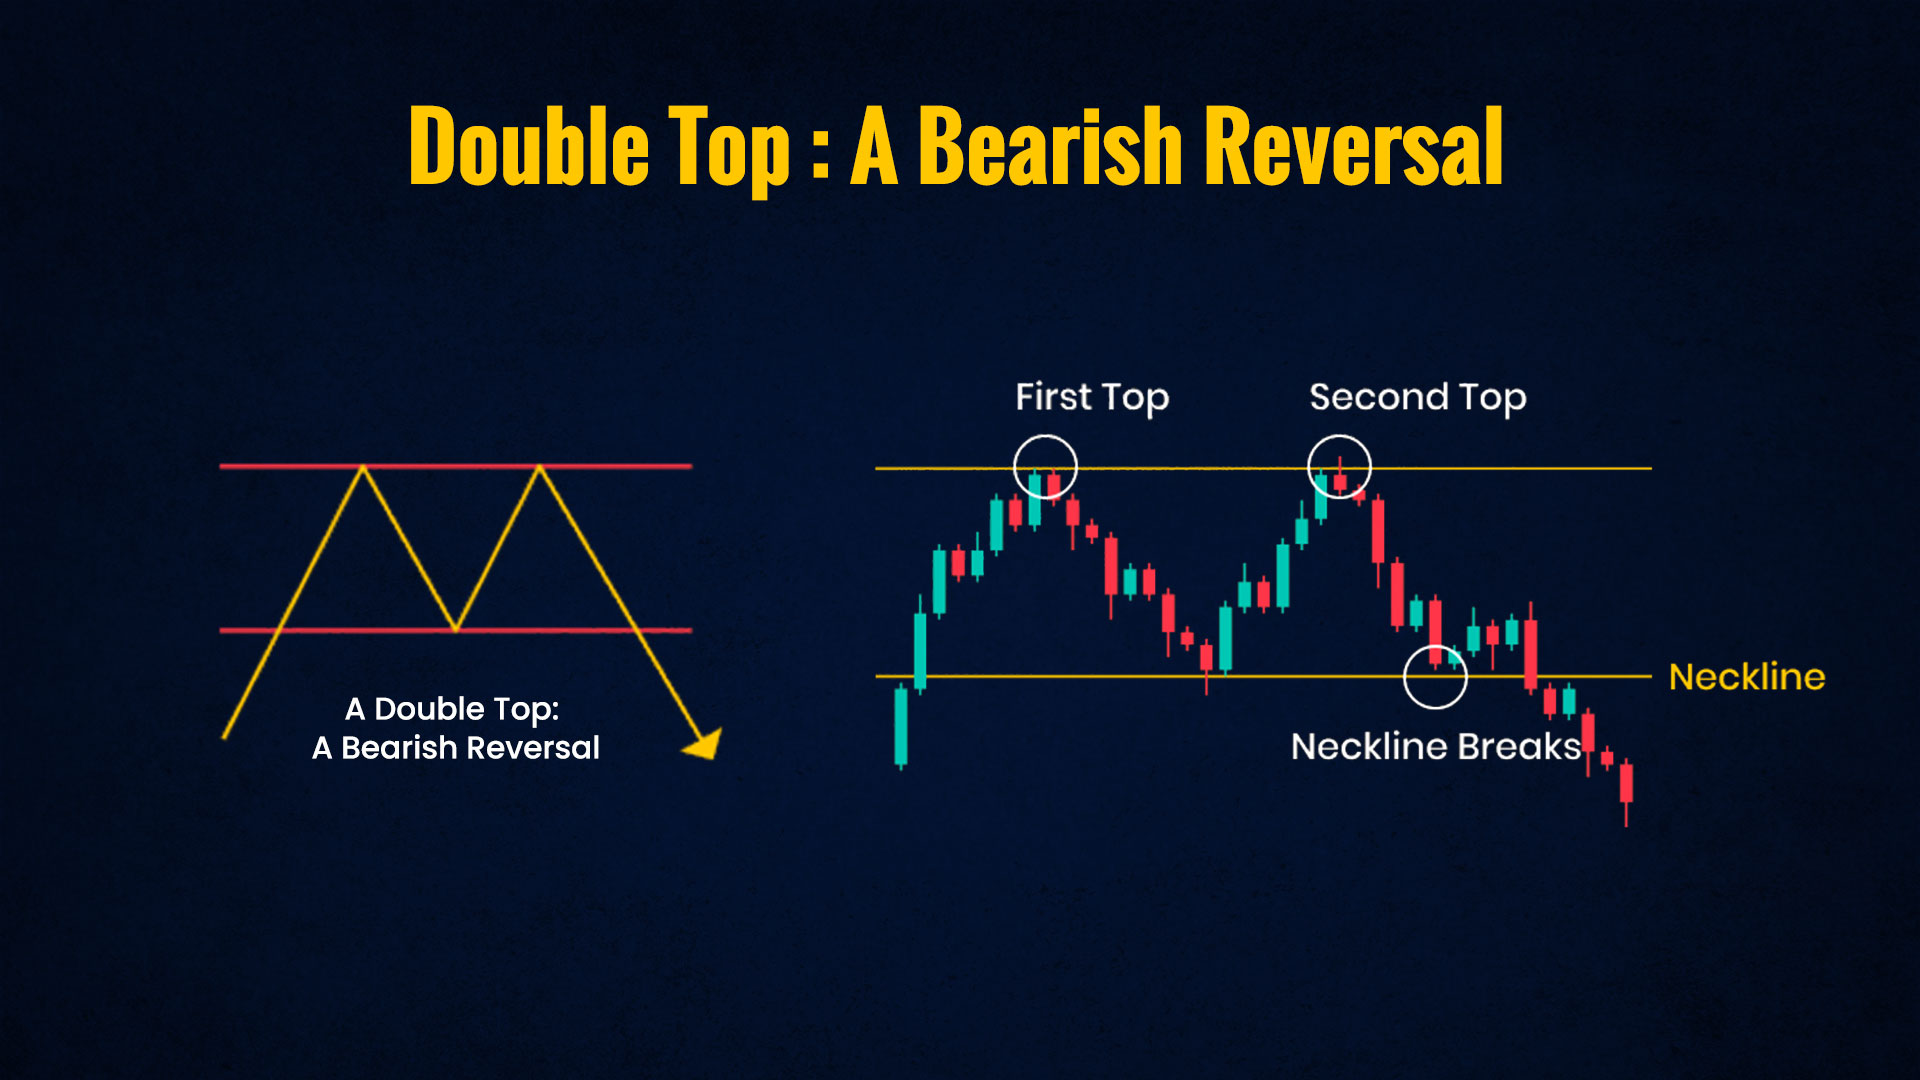 Conversely, the double top pattern serves as a prominent bearish reversal signal, relevant to traders. It unfolds after an extended uptrend. In this scenario, the stock price forms two distinct peaks at approximately the same level, succeeded by a downward breakout. This pattern indicates a possible reversal of the current bullish trend, forewarning traders that a bearish trend may be forthcoming. Recognizing the double top pattern is essential for traders, as it helps in making informed decisions about selling positions and managing risk.
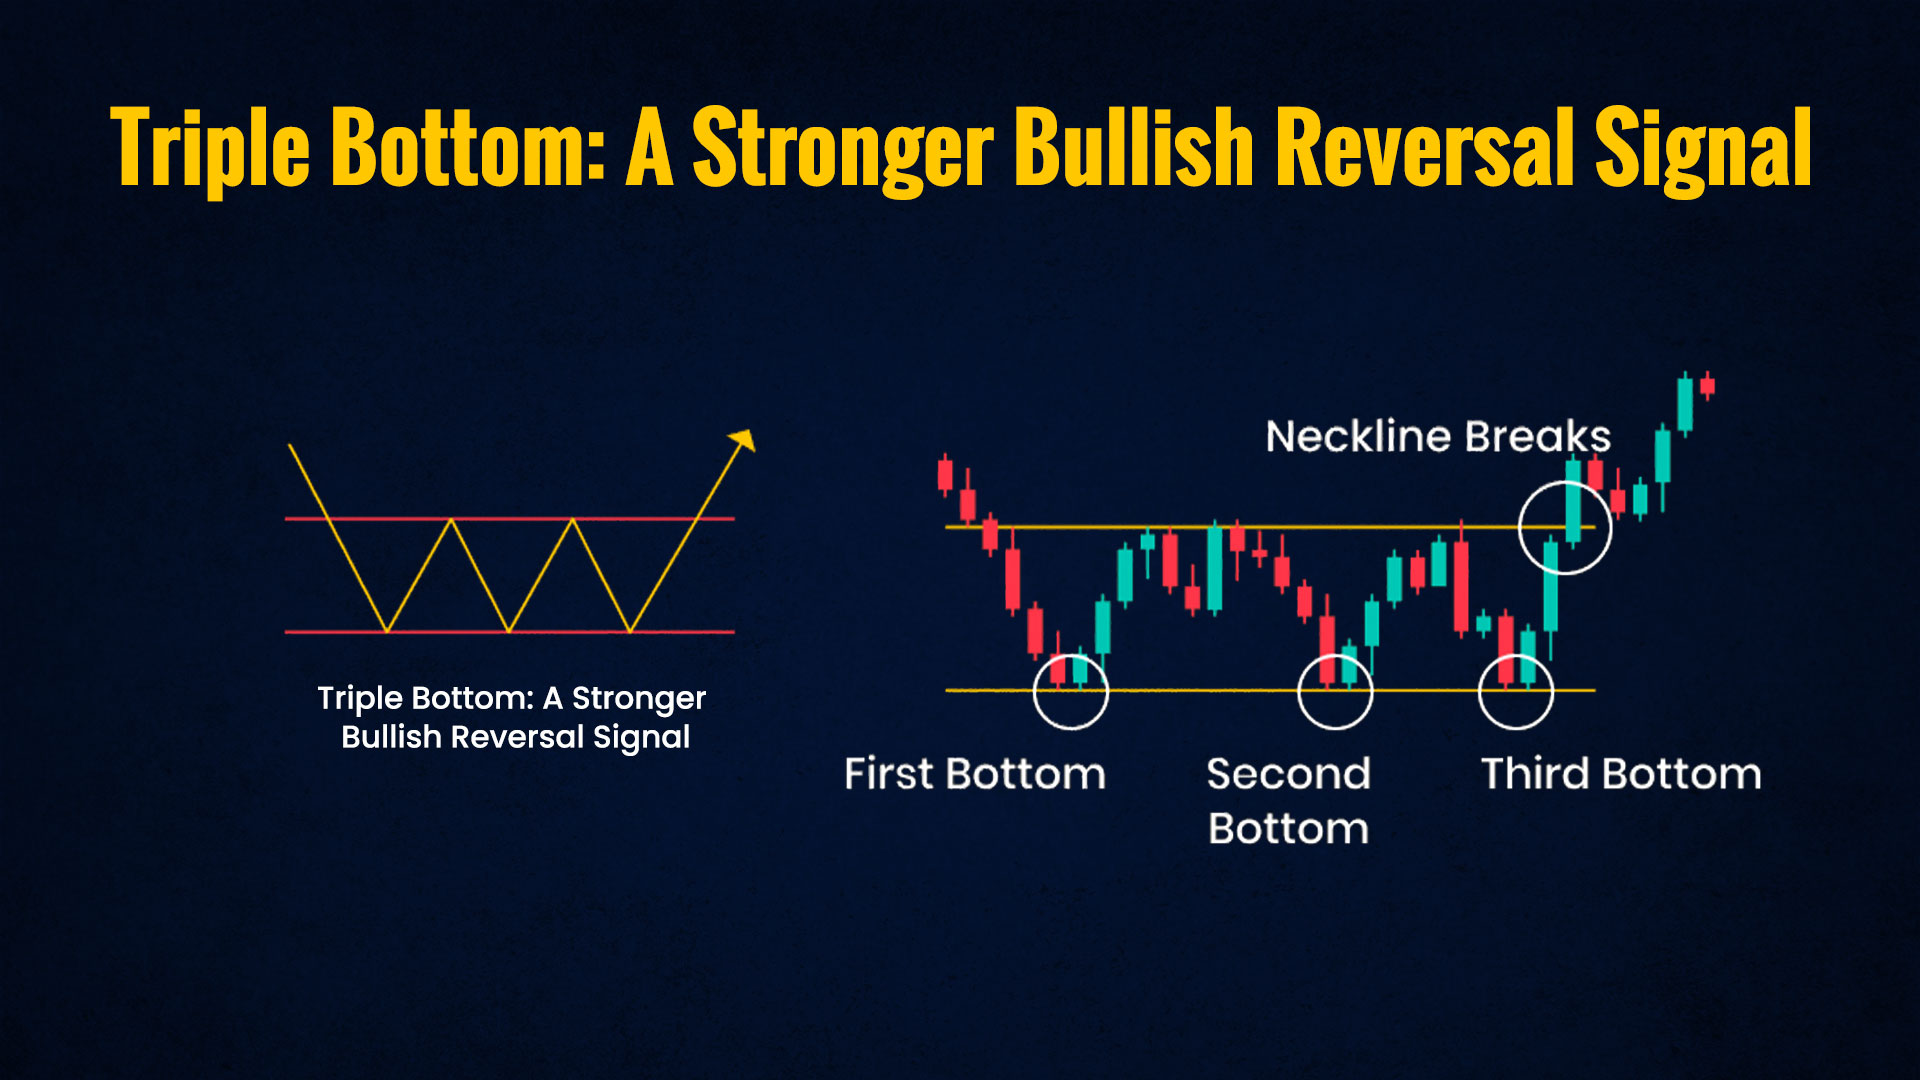 Similar to the double bottom, the triple bottom pattern is a bullish reversal signal that's even more robust. This pattern presents itself after a downtrend and involves the formation of three lows at nearly the same level, followed by a breakout to the upside. The triple bottom offers a more powerful indication of a trend reversal to the upside compared to the double bottom, making it an important signal for identifying potential buying opportunities.
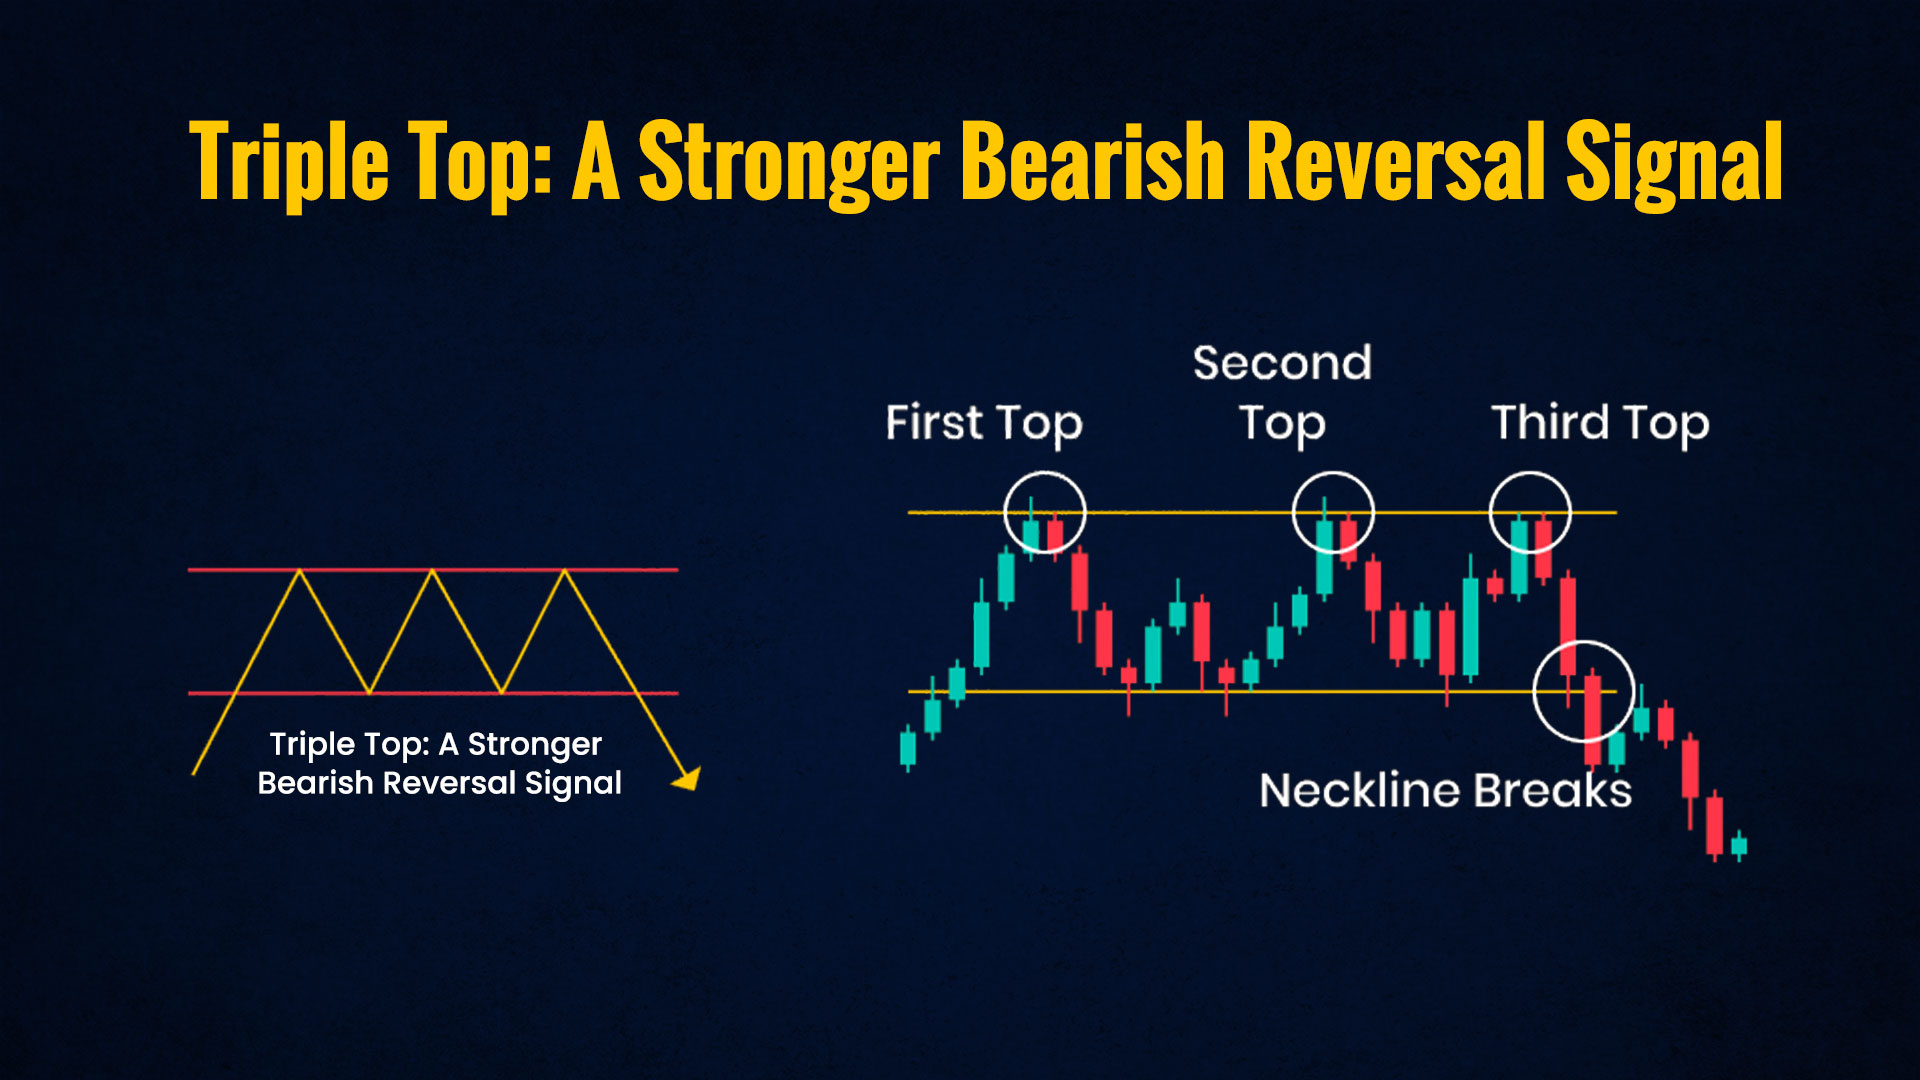 Much like the triple bottom, the triple top is a bearish reversal pattern, but it's more robust in its signal. It occurs after an uptrend and involves the formation of three distinct highs at roughly the same level, followed by a downward breakout. This pattern delivers a stronger signal to traders that the ongoing bullish trend might be faltering, urging them to consider selling positions and exercising caution.
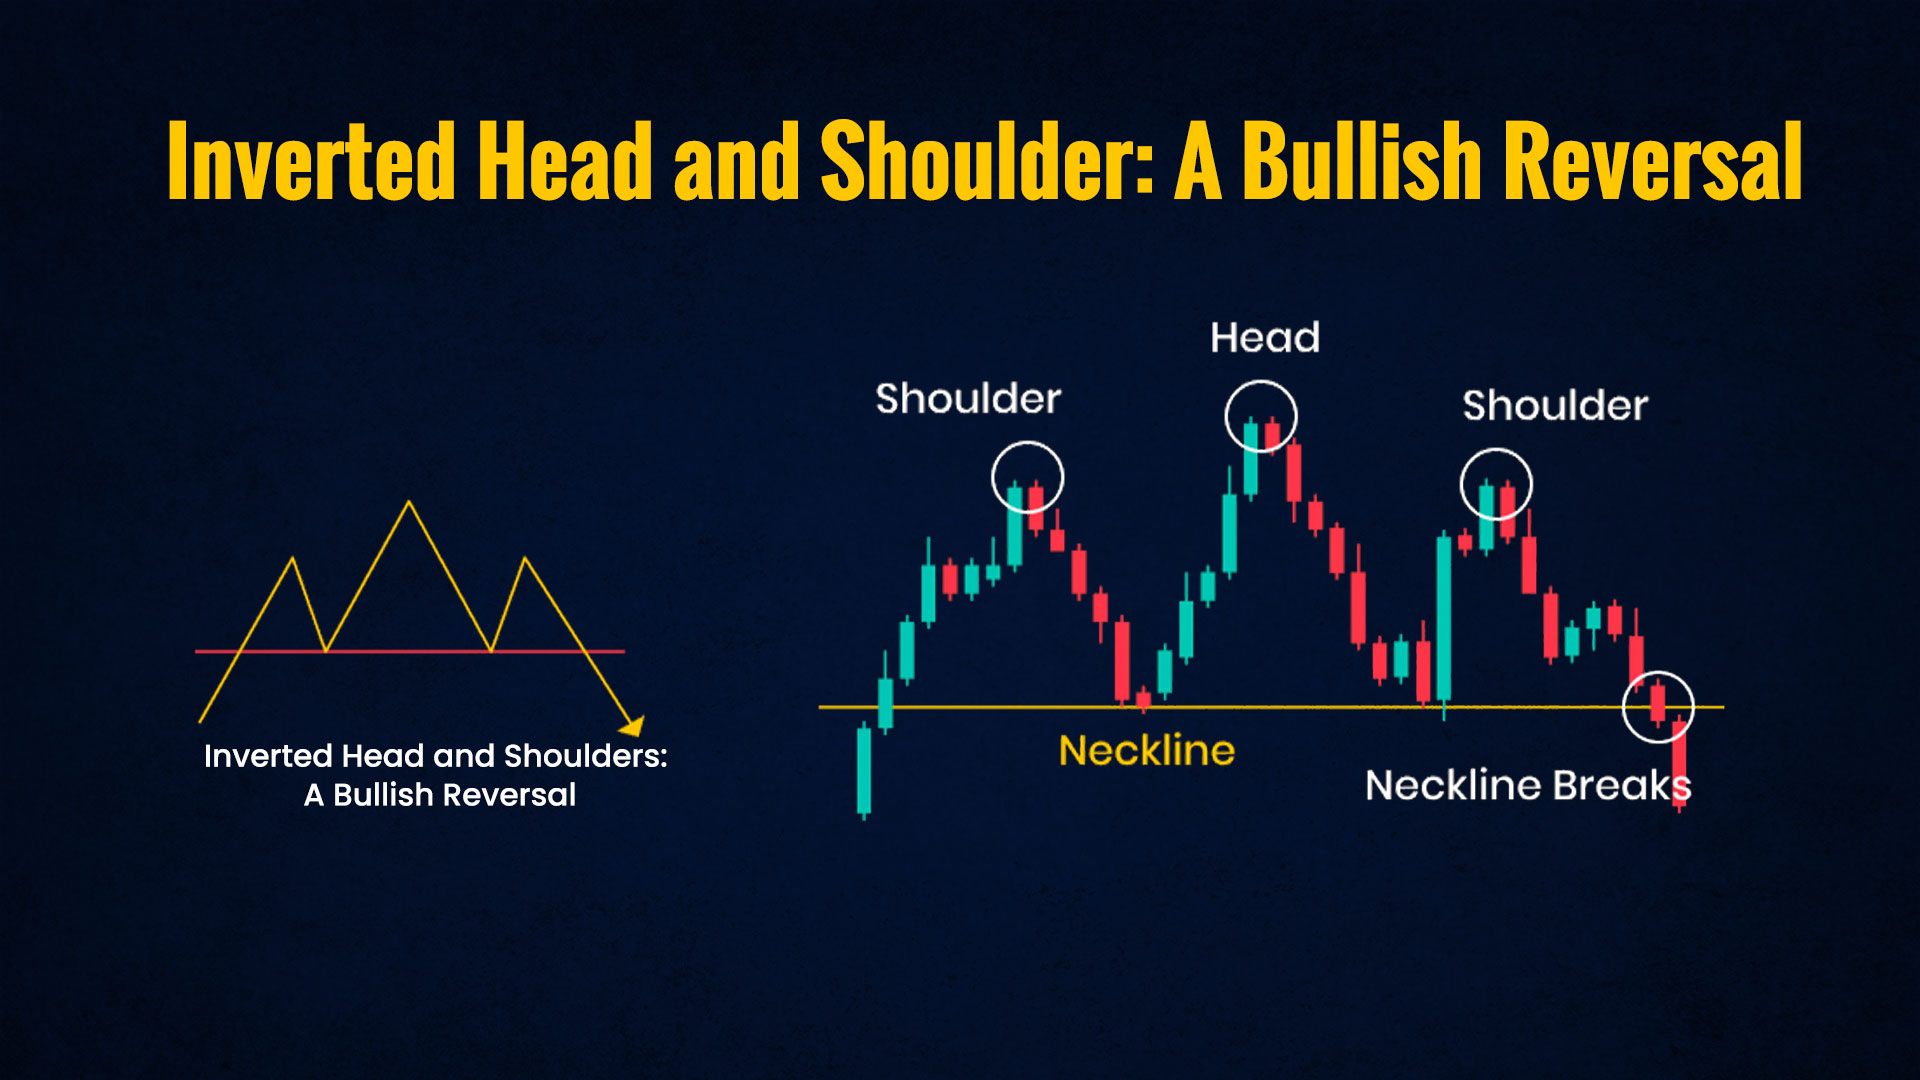 The inverted head and shoulders pattern is a bullish reversal signal that takes the shape following a downtrend and features the formation of three troughs, with the middle trough (head) being lower than the two outer troughs (shoulders). This pattern implies a reversal to the upside, making it a crucial pattern to watch for, as it is an indicator of a potential shift from bearish to bullish sentiment.
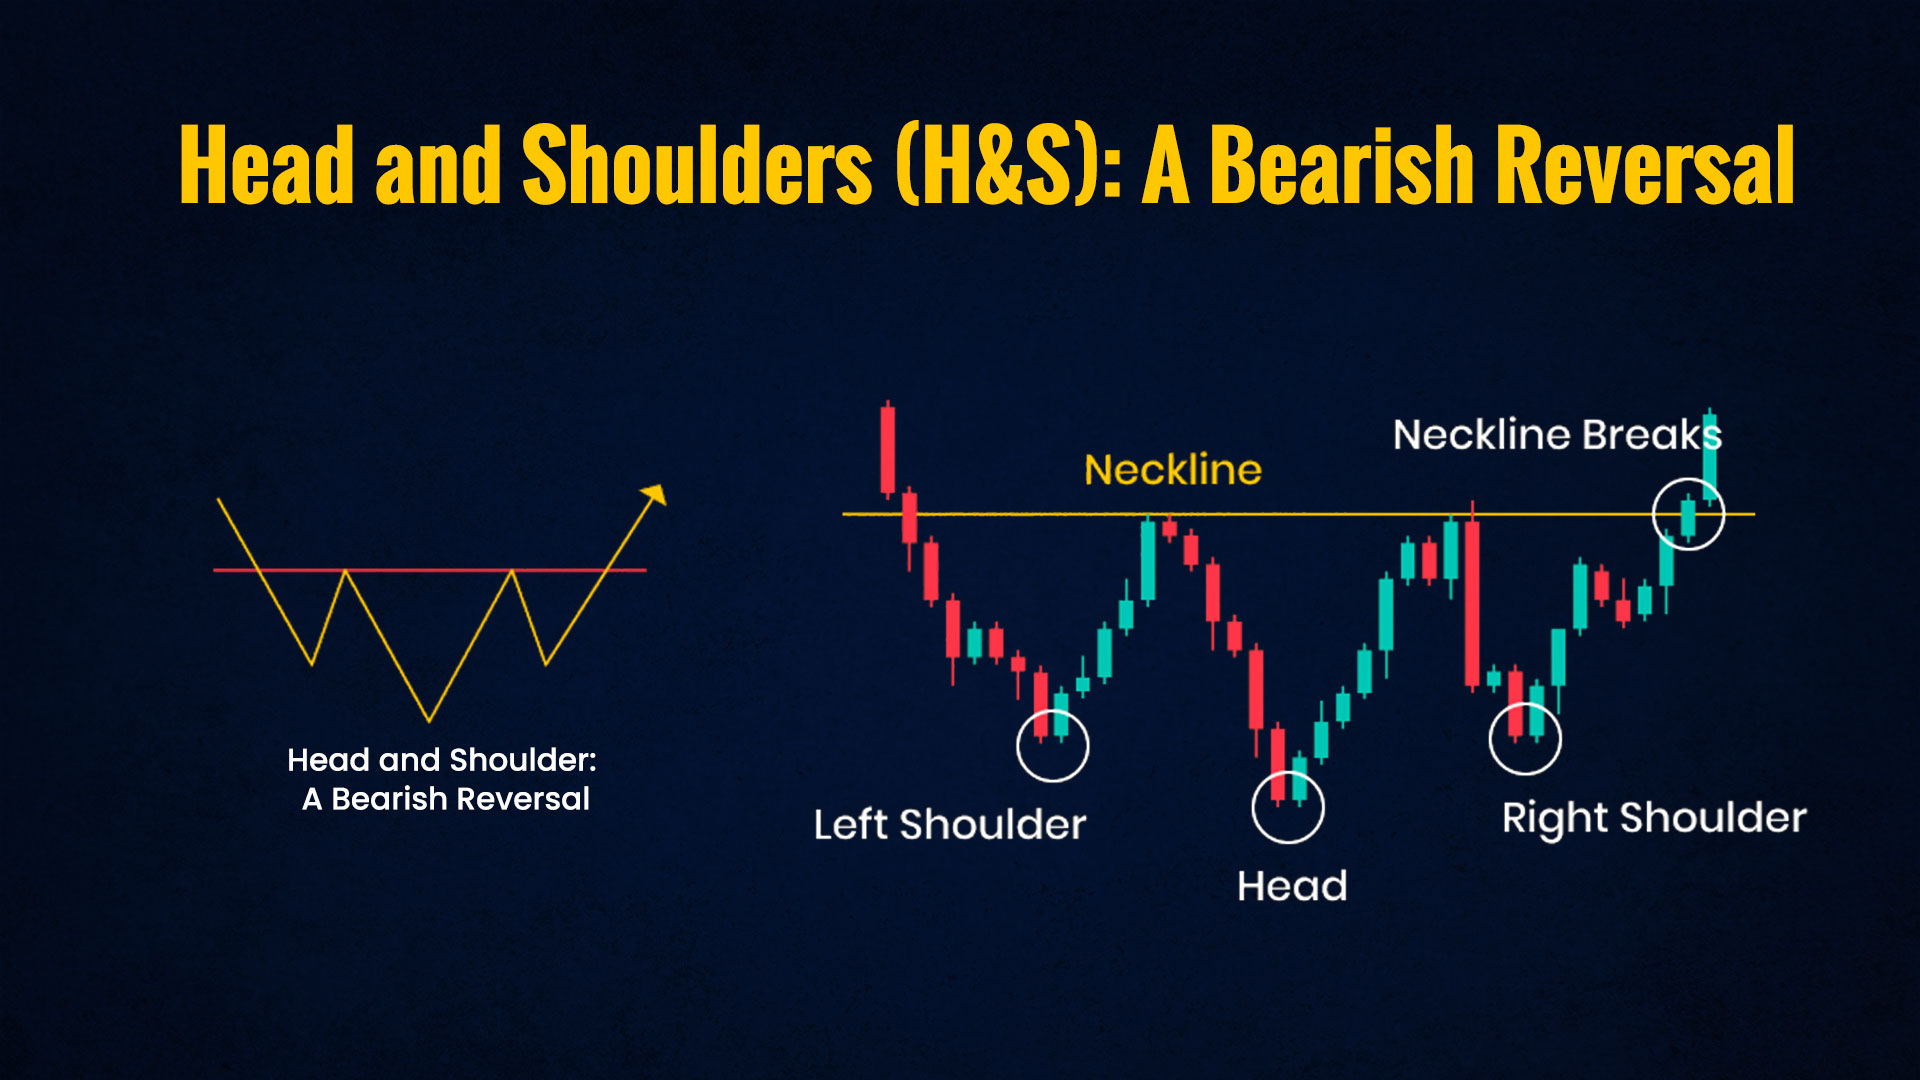 The head and shoulders pattern is a well-known bearish reversal signal. It develops after an uptrend and consists of three peaks, with the central peak (head) being higher than the two flanking peaks (shoulders). This pattern suggests a reversal to the downside, signalling that the bullish trend may be weakening and a bearish trend could be on the horizon. Recognizing the head and shoulders pattern is vital for traders to make timely decisions regarding selling and risk management strategies.
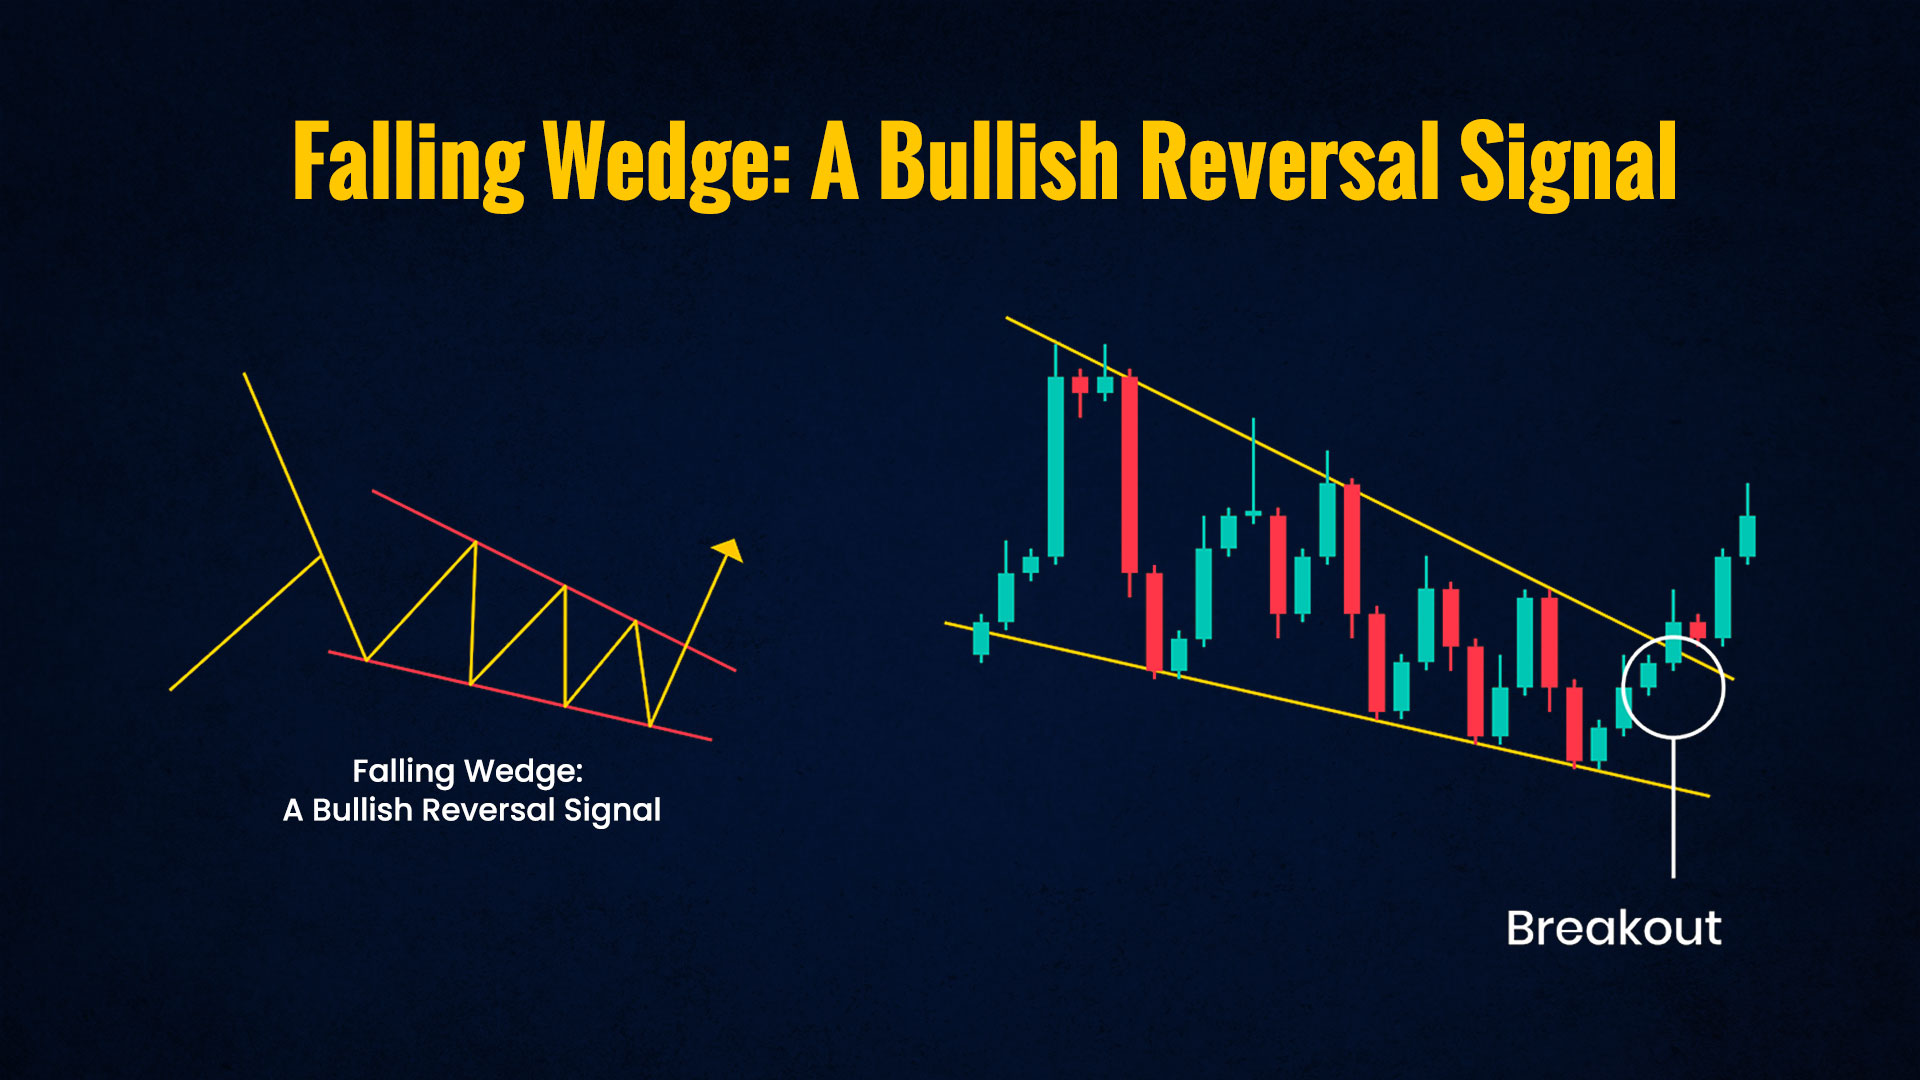 The falling wedge pattern is a notable bullish reversal signal. It occurs within a downtrend when prices from lower highs and lower lows, converging into a narrowing range. When a breakout to the upside transpires, it signals the potential for a bullish reversal. Traders often find this pattern valuable for identifying opportunities to enter into long positions.
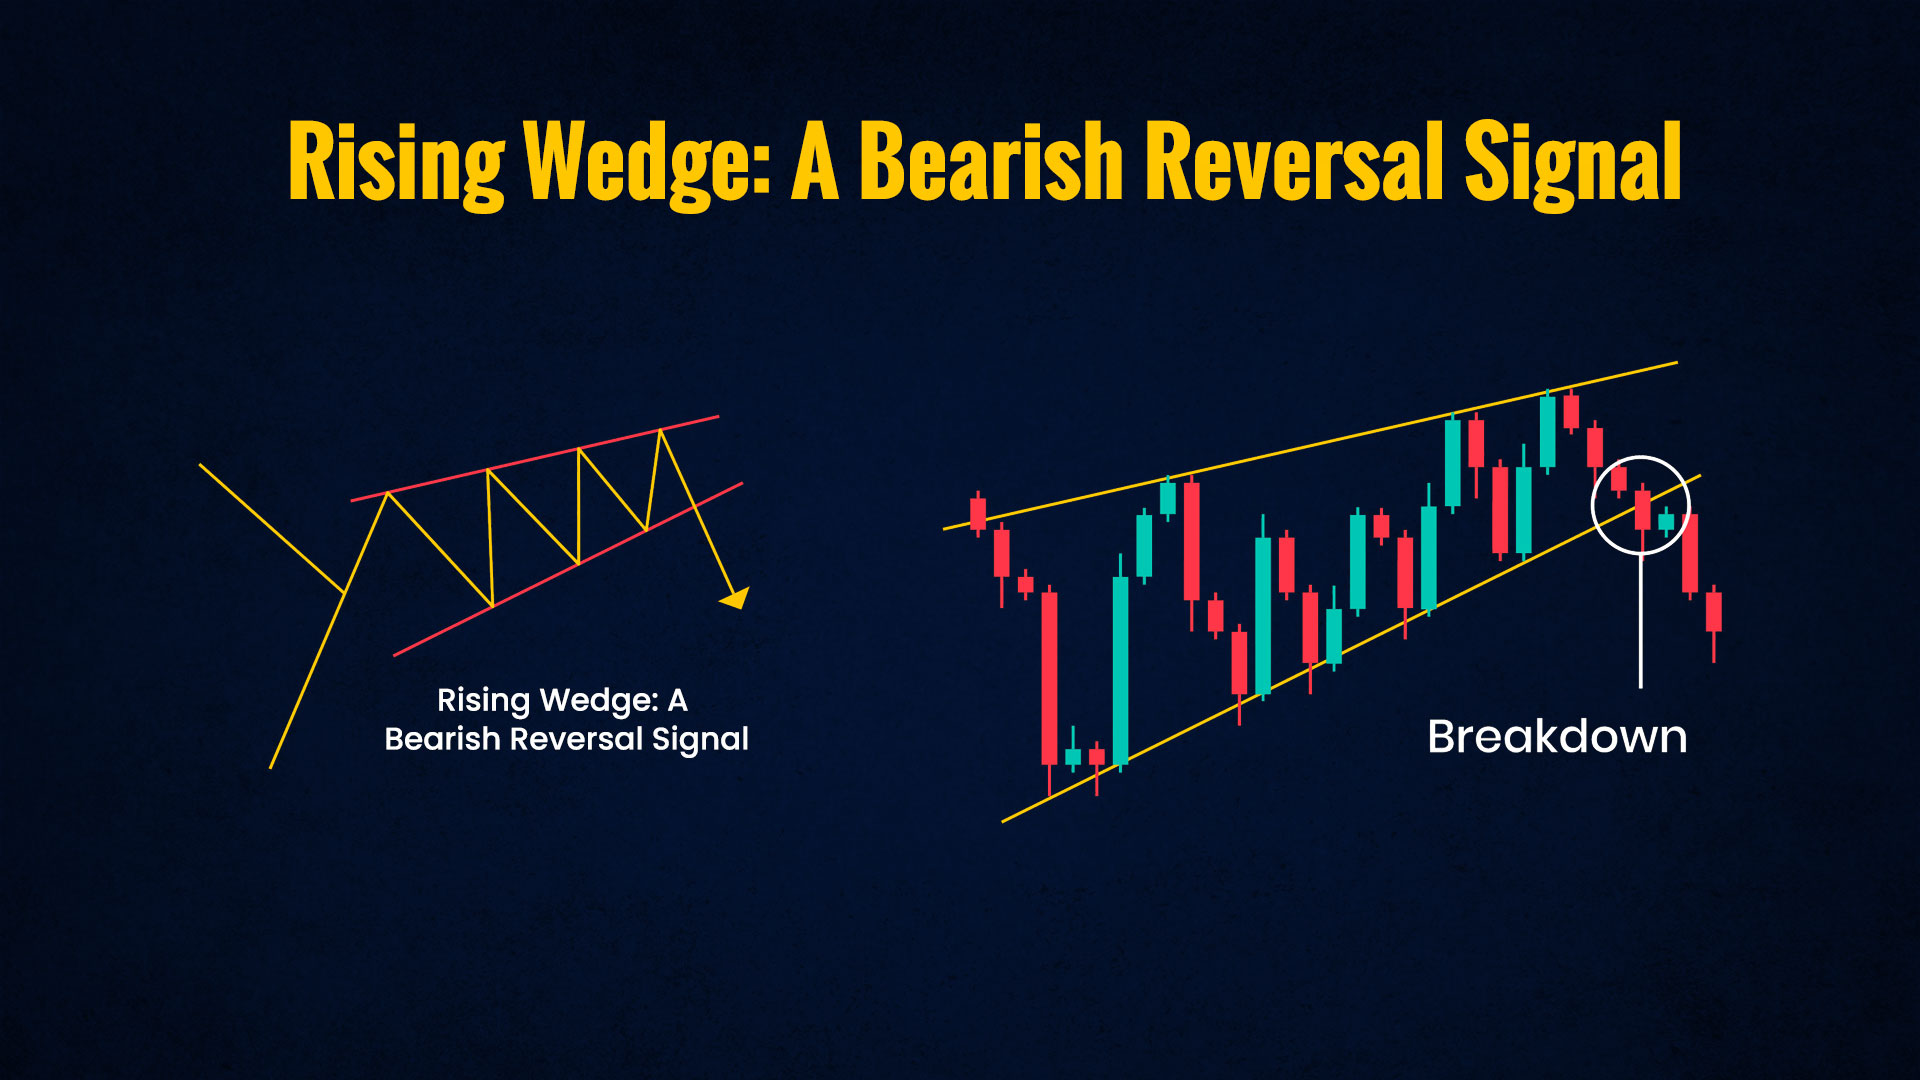 The rising wedge pattern is a relevant bearish reversal signal for traders. It materialises within an uptrend as prices form higher highs and higher lows, converging into a narrowing range. A breakout to the downside in this scenario suggests a potential bearish reversal. Traders use the rising wedge to anticipate downward movements and make informed decisions regarding selling and managing risk.
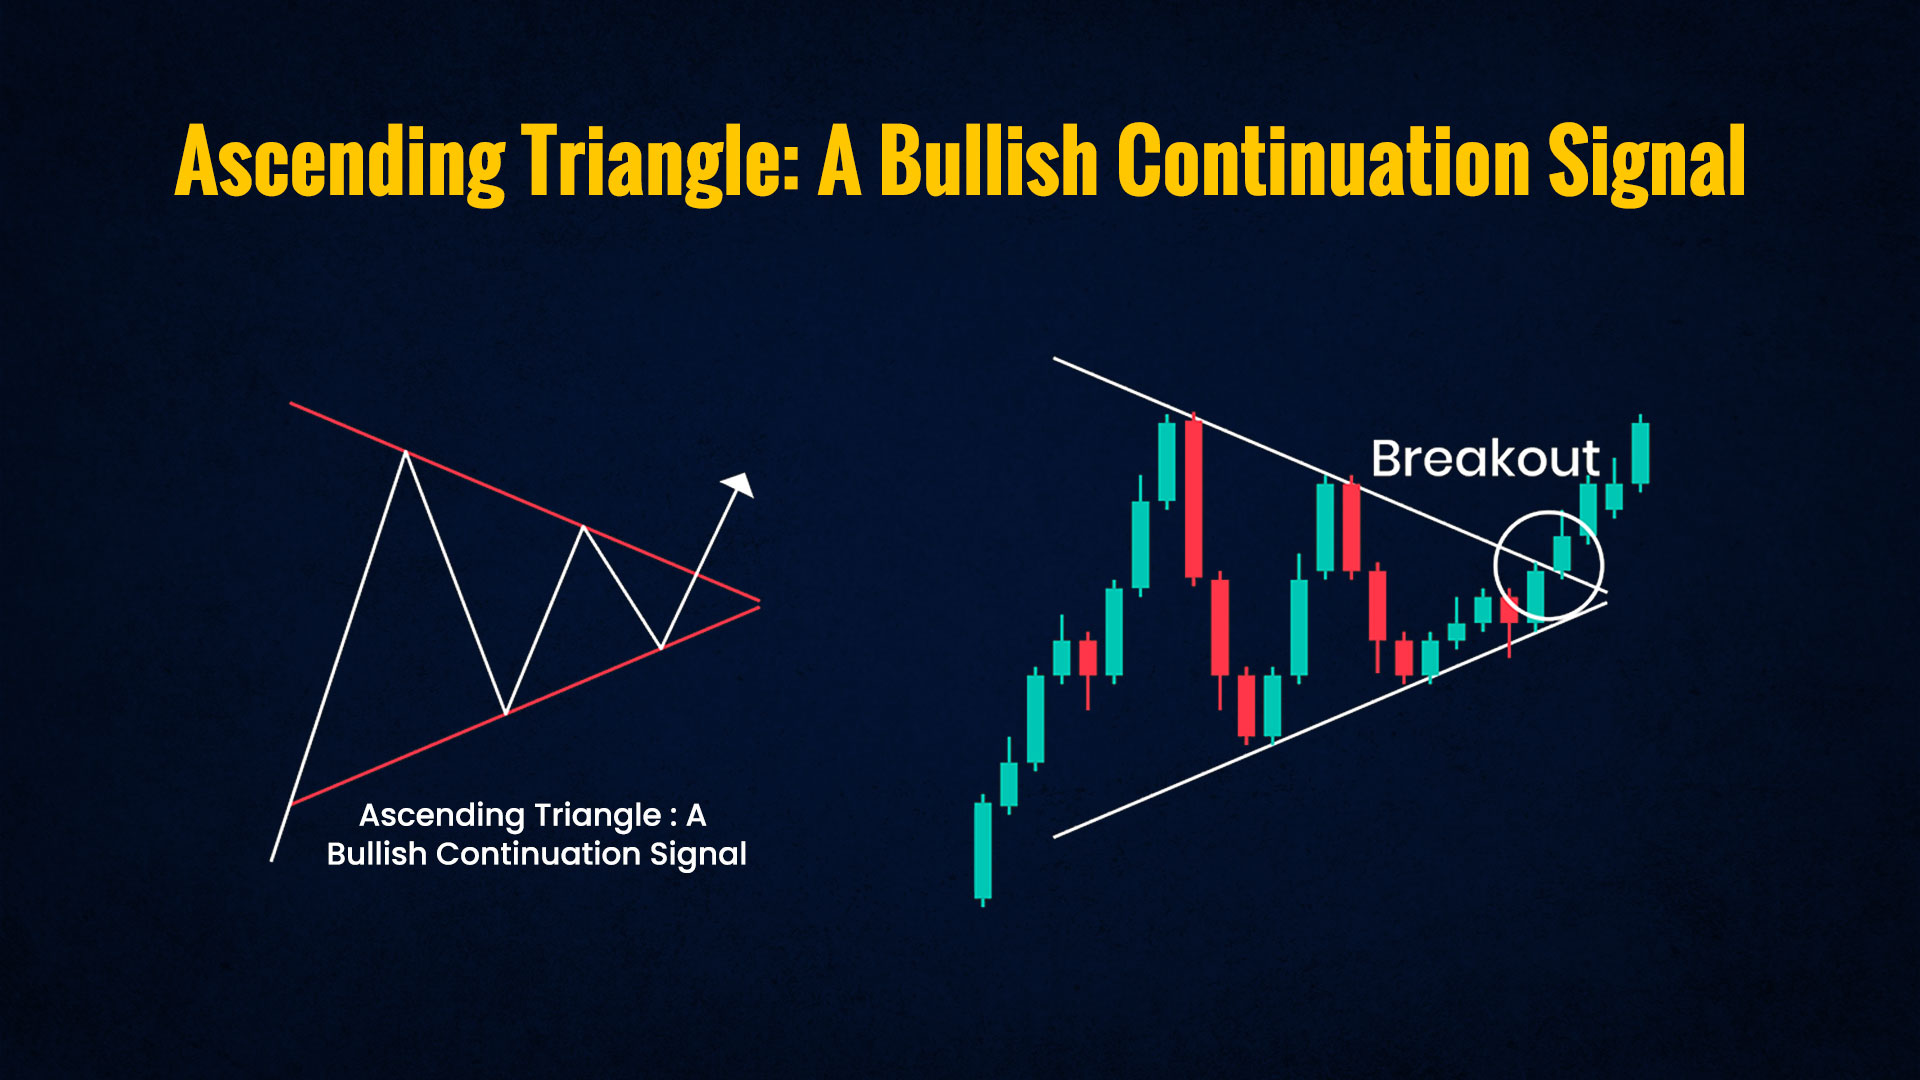 Within the context of an uptrend, the ascending triangle pattern is a valuable signal for bullish continuation. Prices form higher lows and a horizontal resistance line. When the price breaks above the resistance line, it indicates a bullish continuation. Traders often use this pattern to reinforce their confidence in maintaining long positions or considering new ones.
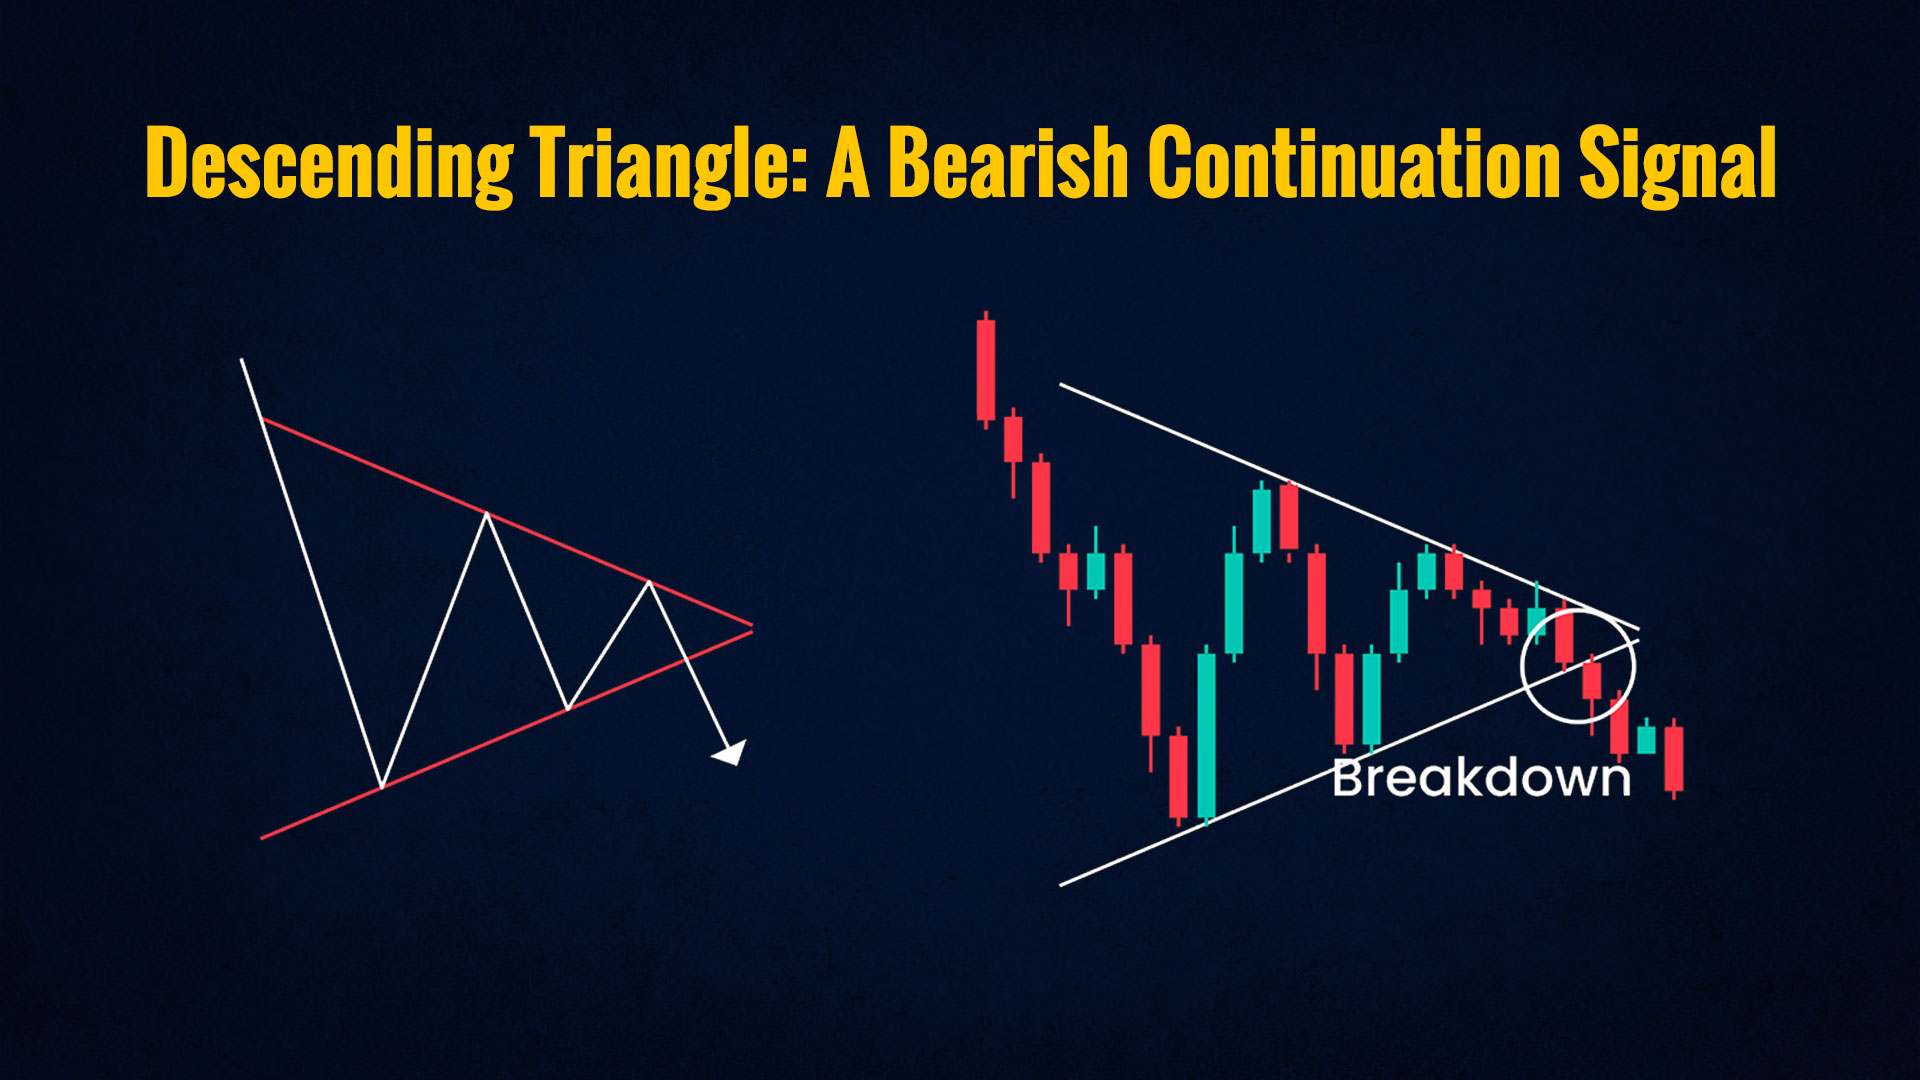 The descending triangle pattern is pertinent to traders as it signifies a bearish continuation within a downtrend. Prices form lower highs and a horizontal support line. A breakdown below the support line suggests the bearish trend may persist, prompting traders to remain cautious and consider short positions.
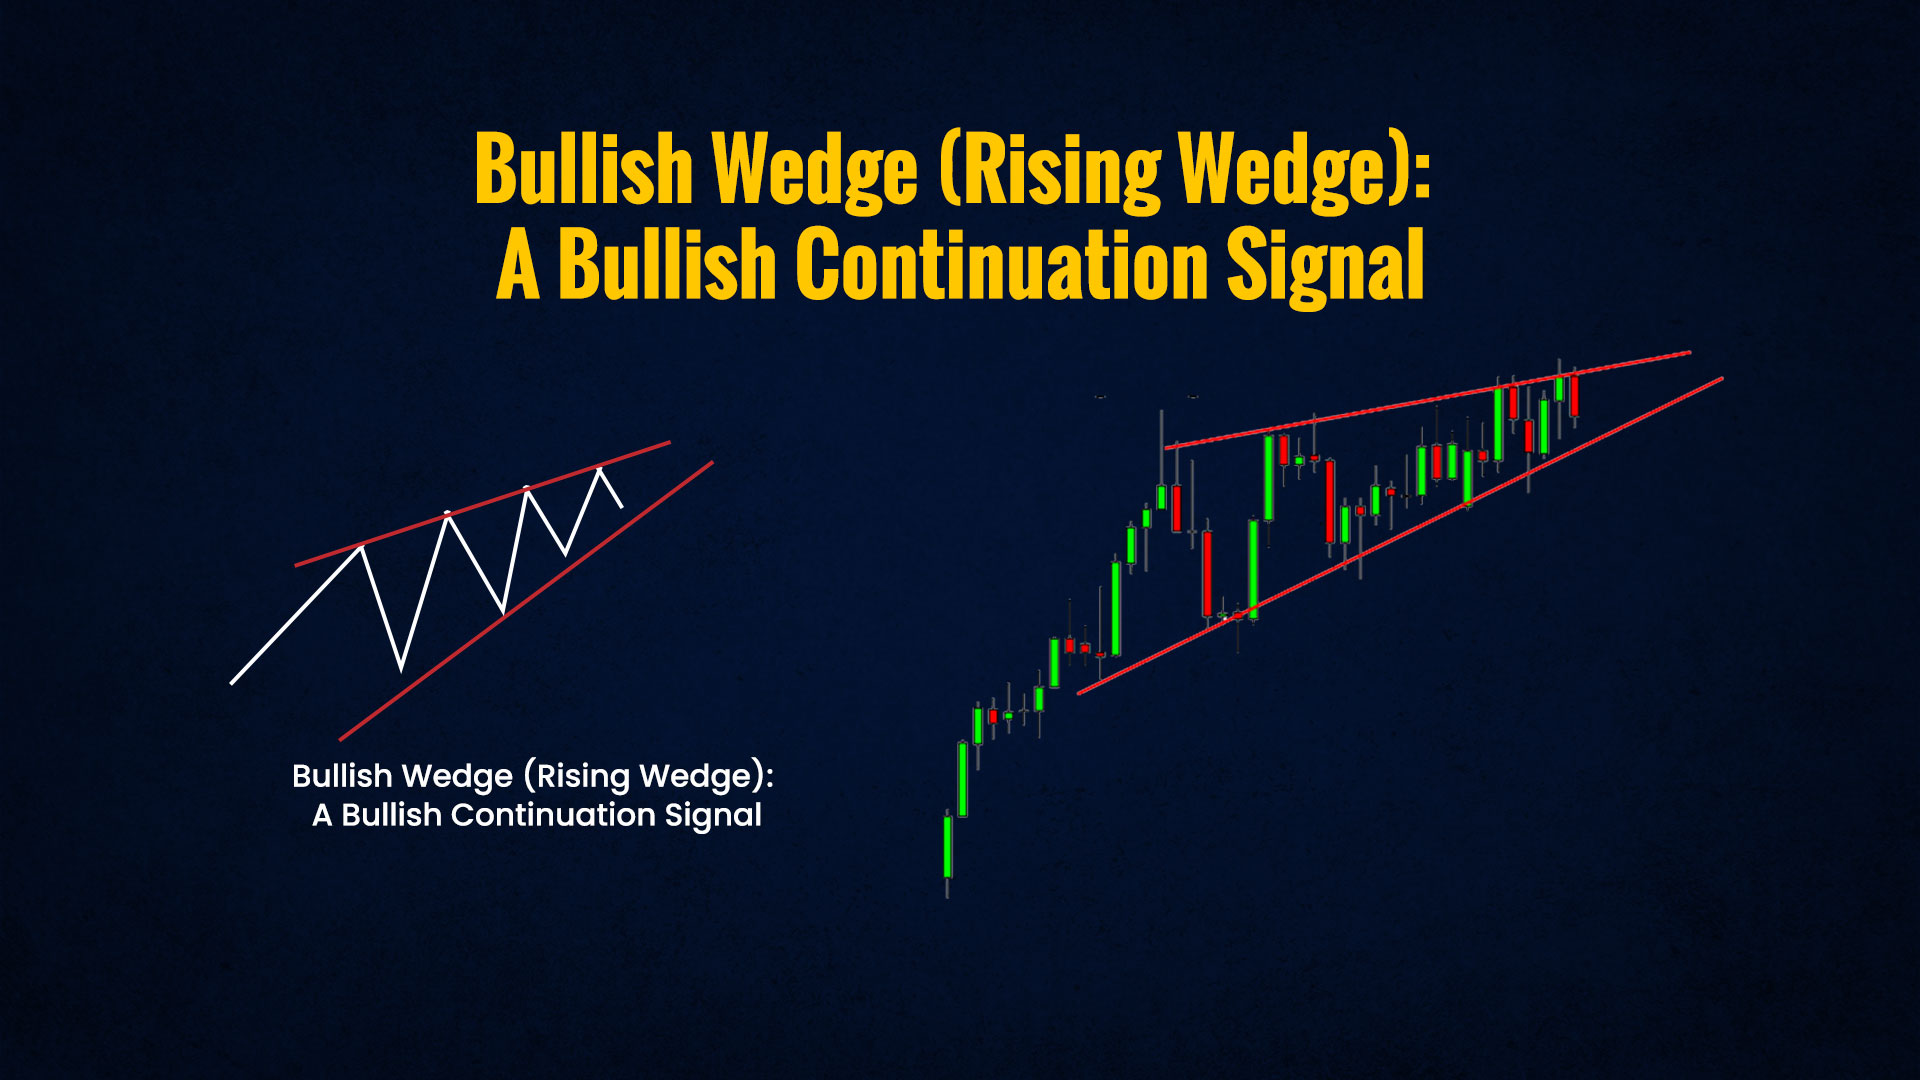 The bullish wedge pattern, also known as the rising wedge, serves as a significant bullish continuation signal. It takes shape within an uptrend as prices form higher highs and higher lows, converging into a narrowing range. A breakout above the upper trendline suggests a bullish continuation, which can be advantageous for traders seeking to capitalise on an ongoing upward trend.
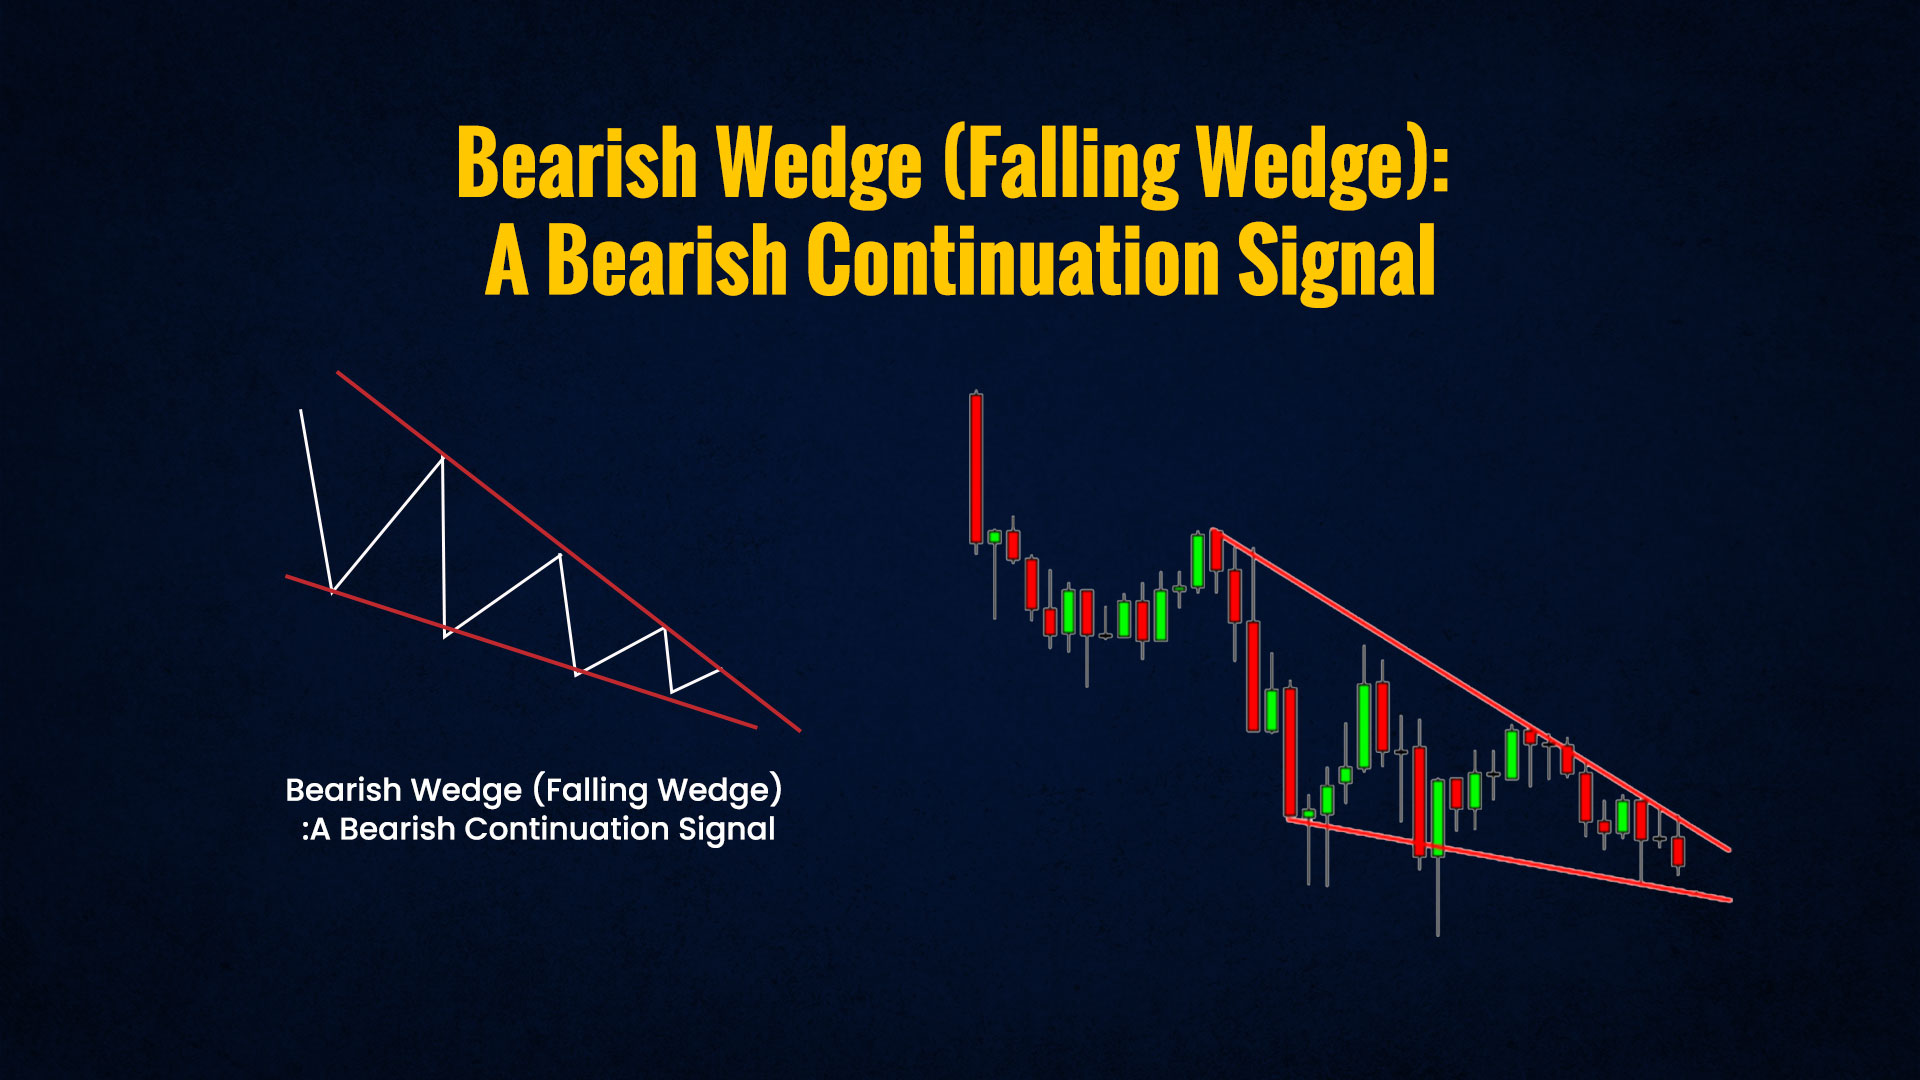 The bearish wedge pattern, or falling wedge, is a relevant bearish continuation signal for traders. It forms within a downtrend as prices create lower highs and lower lows, converging into a narrowing range. A breakout below the lower trendline indicates a bearish continuation. Traders often use this pattern to confirm their bearish sentiments and make informed decisions about staying in or entering short positions.
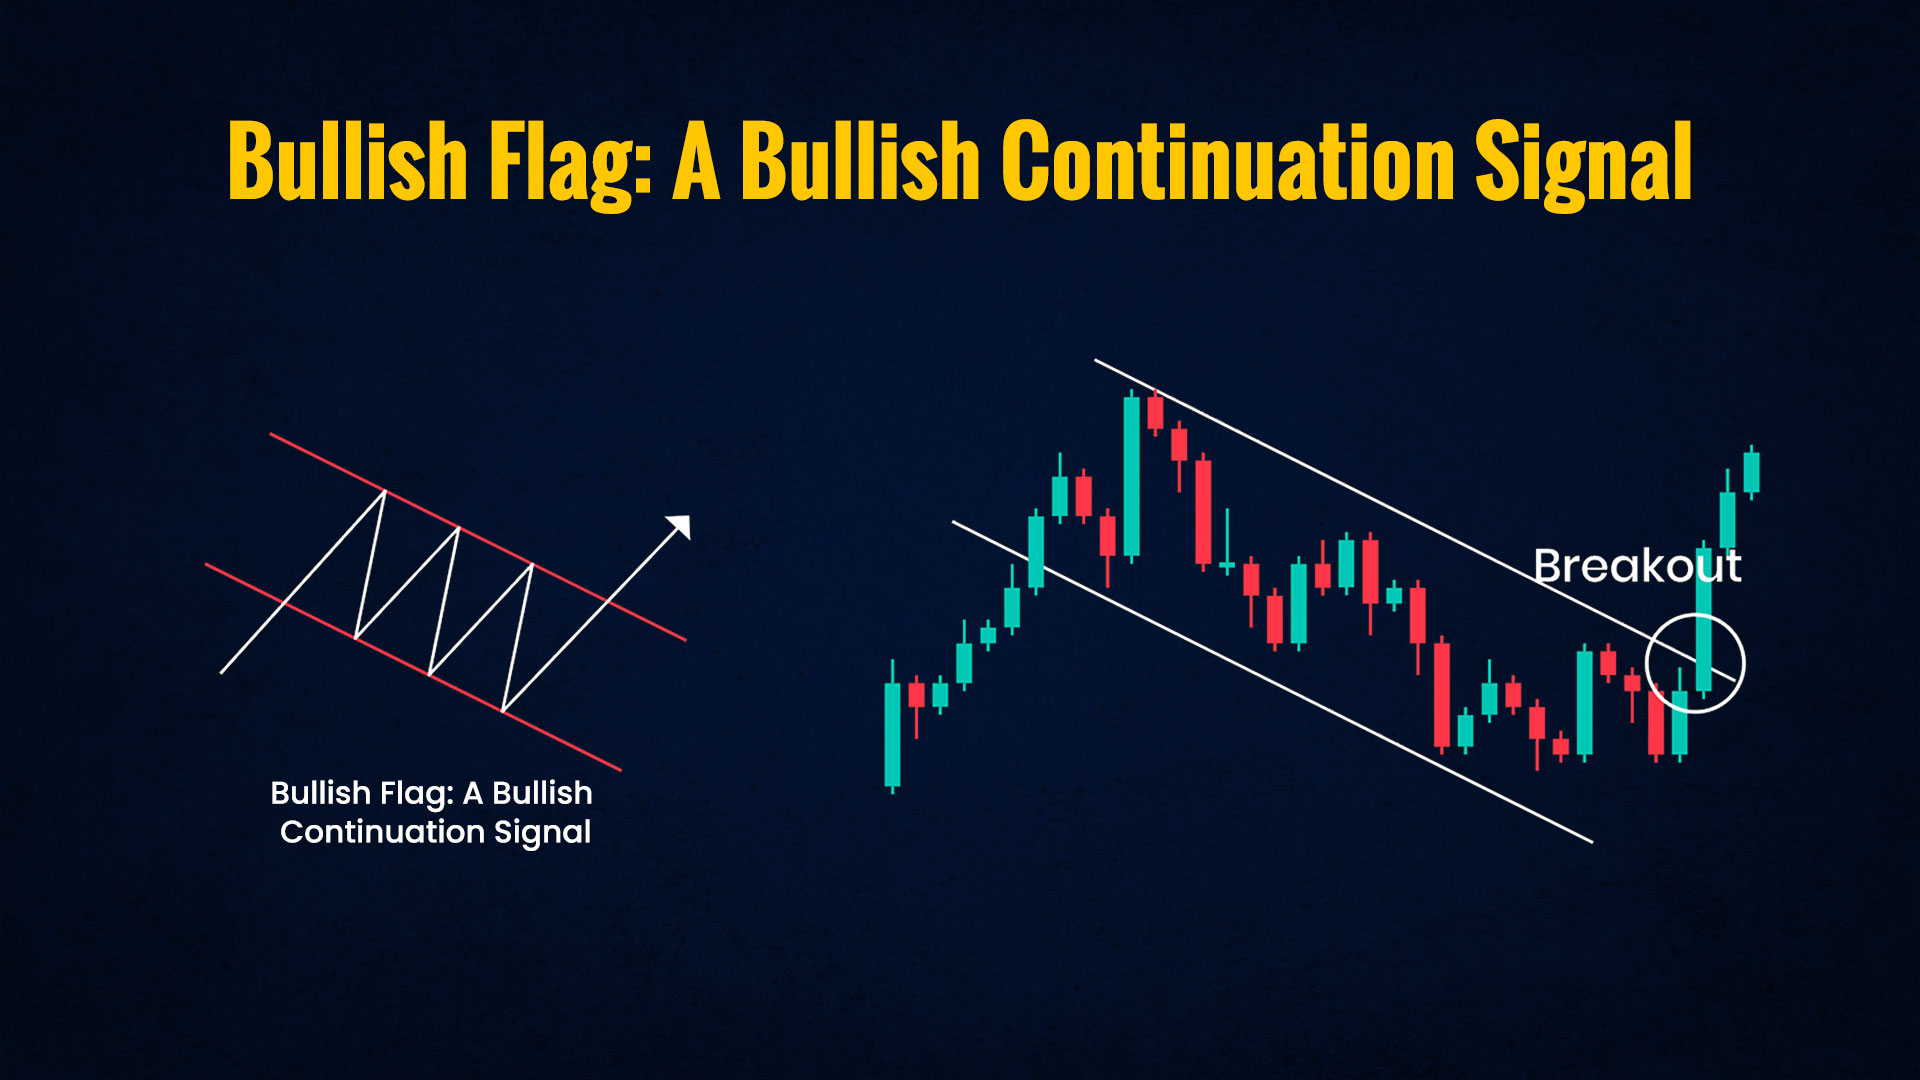 In the context of a strong uptrend, the bullish flag pattern is an important signal for bullish continuation. This pattern occurs when a brief consolidation phase forms a flag shape after the upward price movement. A breakout from the flagpole signals a resumption of the bullish trend, making it essential for traders looking to maximise their gains within the ongoing uptrend.
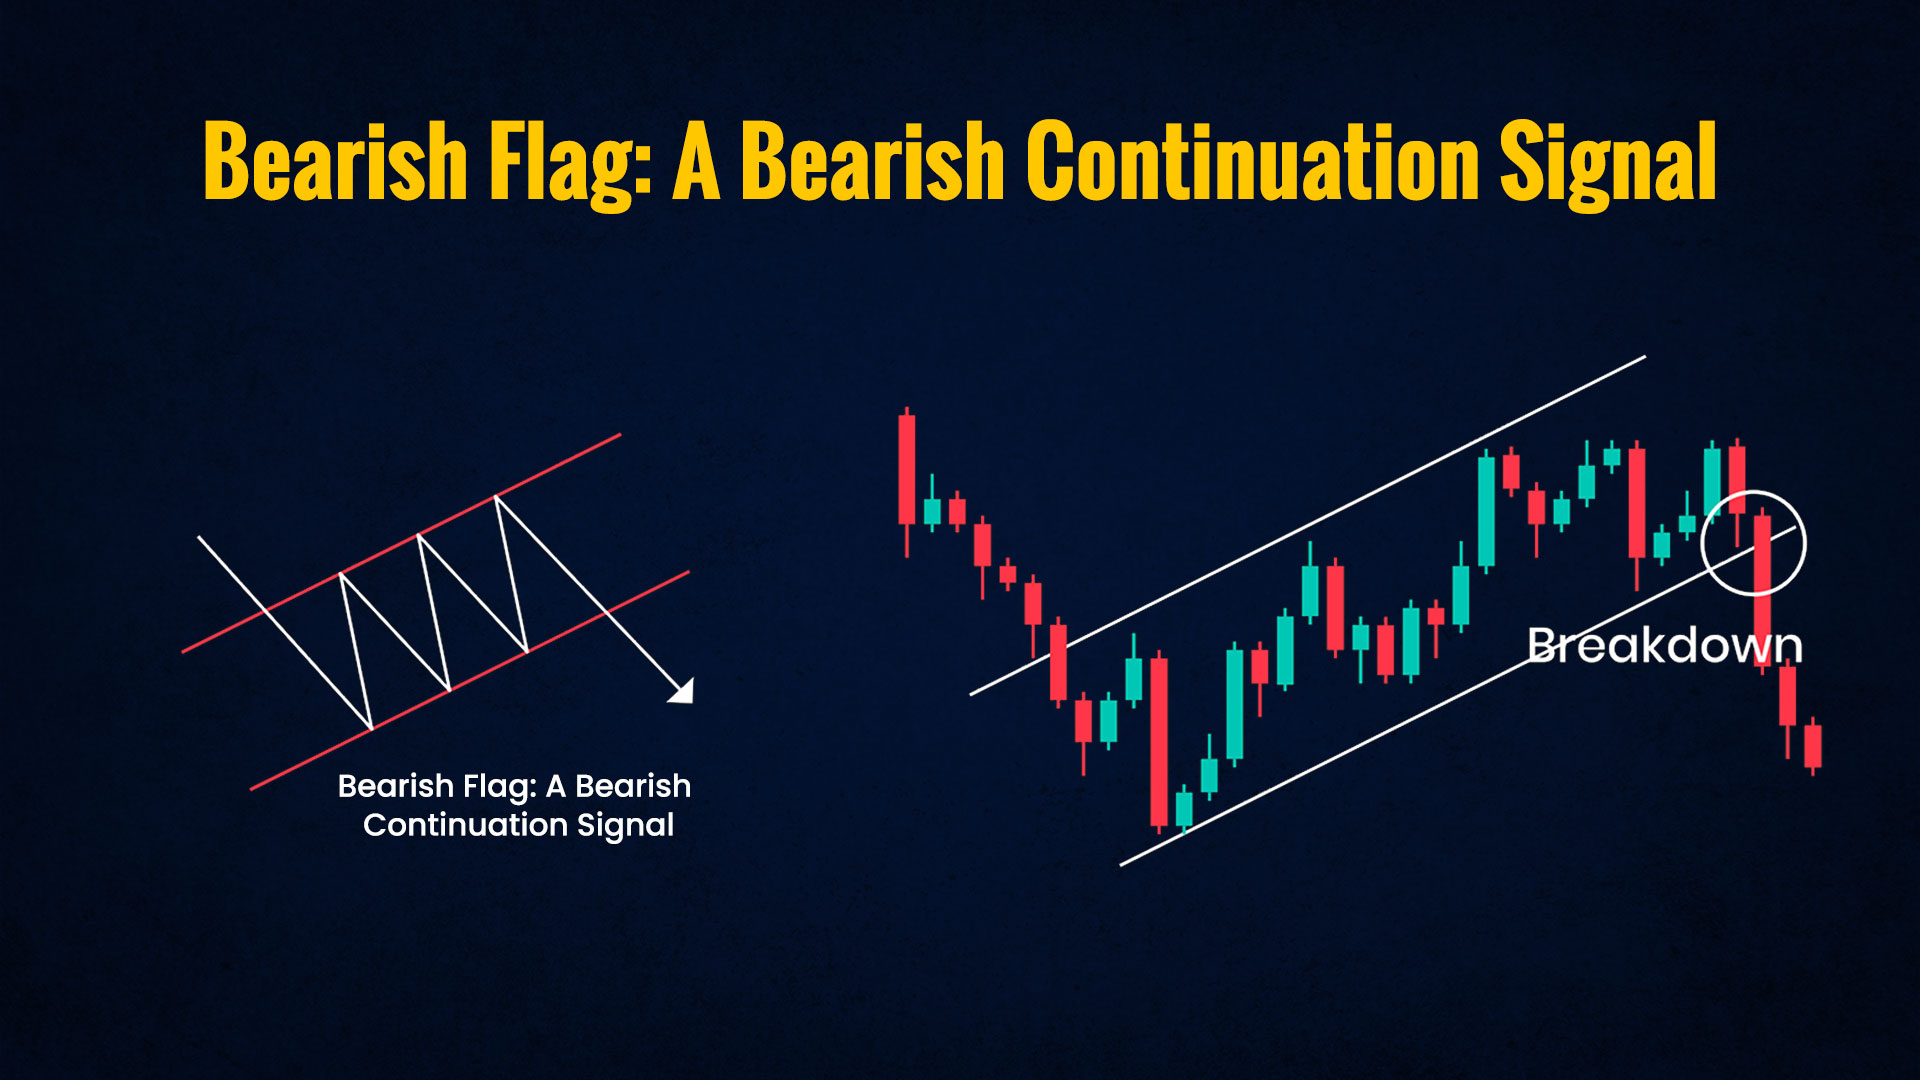 In the midst of a strong downtrend, the bearish flag pattern is pertinent to traders as it signifies a bearish continuation. The pattern takes shape when a brief consolidation phase forms a flag shape following the downward price movement. A breakdown from the flagpole indicates the continuation of the bearish trend, prompting traders to stay vigilant and consider short positions.
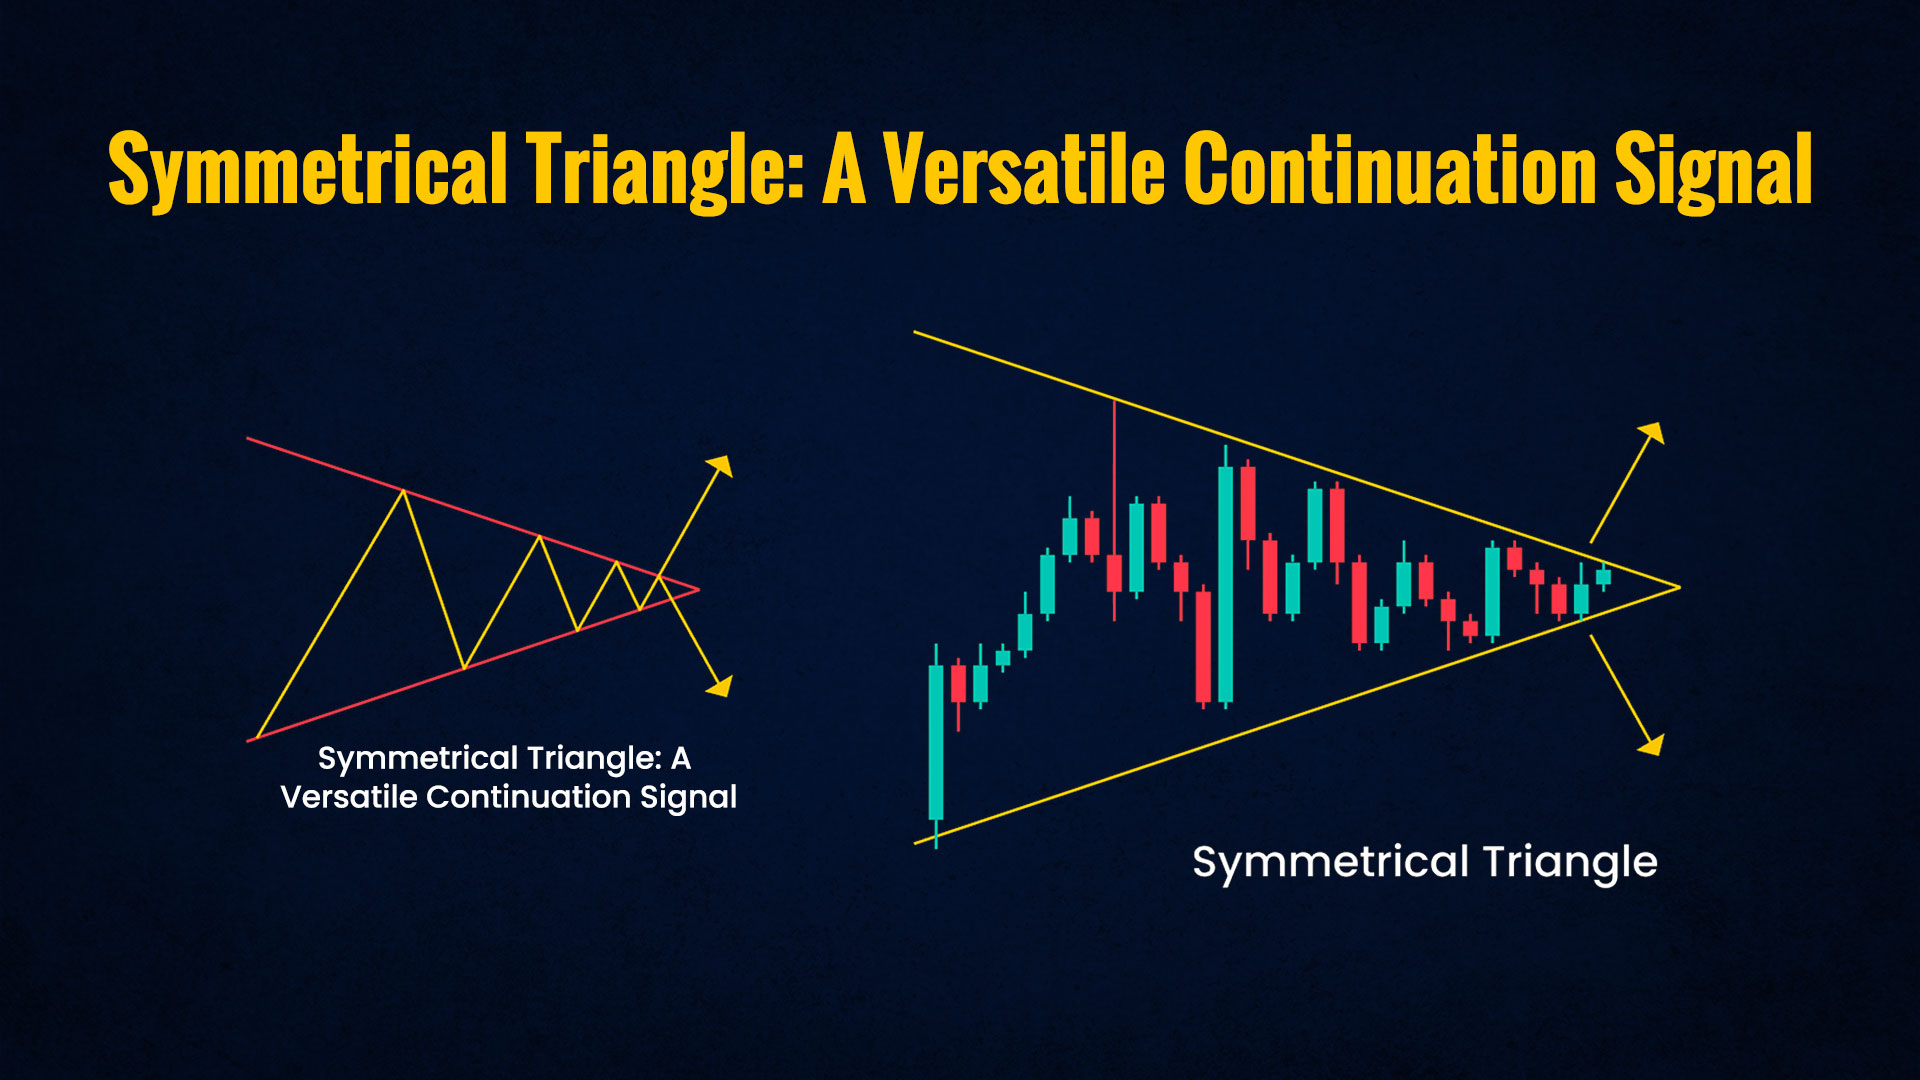 The symmetrical triangle pattern is versatile, serving as both a bullish and bearish continuation signal in both uptrends and downtrends. Prices form lower highs and higher lows, converging into a symmetrical triangle. A breakout in either direction suggests the continuation of the prevailing trend. Traders find this pattern valuable for adapting to different market conditions and making well-informed decisions to maintain or adjust their positions.
Trading using chart patterns primarily requires a deep understanding of these patterns and other core concepts like price and volume movements and the impact of micro or macroeconomic factors on the securities. Following this, the steps to trade using chart patterns are quite simple and are listed below.
Chart patterns are the basis for understanding technical analysis of stocks and other securities traded on the stock markets. It is crucial to understand the trajectory of the price and volume movements of a stock or security. This information is vital for traders to find suitable entry and exit points for their target stocks to take maximum advantage of the market fluctuations and create a successful trading portfolio. This blog talks about the popular chart patterns used by traders on a daily basis. If you need more information on the same or about any similar chart patterns, do let us know and we will take it up in our coming blogs. Till then Happy Reading!
Marisha Bhatt is a financial content writer @TrueData.
She writes with the sole aim of simplifying complex financial concepts and jargon while attempting to clarify technical and fundamental analysis concepts of the stock markets. The ultimate goal is to spread vital knowledge and benefit the maximum audience. Her Chartered Accountant background acts as the knowledge base to help clarify crucial concepts and create a sound investment portfolio.

The dollar exchange rate is constantly in the news and is often seen as a measu...

When we take our first step into the trading game, we choose the best resource...
Trend trading is one of the most popular forms of trading for a trader, especial...
Stock investing and trading are becoming primary and secondary sources of incom...