Lately, several traders have started using Range Bars for their trading systems rather than the standard candlestick charts. By migrating their trading systems from the standard time-based (1min, 5 min, etc..) candlestick charts to Range Bars, traders are looking to overcome the losses they encounter during sideways markets. The best part is that it is easily possible to Display and Work with these Range Bars in Amibroker.
Each range bar must:
Amibroker fully supports Range Bar charting and the bar size is based on the Tick Size of a given symbol. This allows us to define symbol-specific tick sizes individually. You can then display a chart that, for example, shows 10R or 40R bars. 10R / 40R meaning bars using a range of 10-ticks / 40 ticks for each symbol respectively. To display range charts, you will need to follow the following steps:-
 Specify the Tick Size

 Range Bar Chart in Amibroker
... that for best results, your database should use Tick as Base Time Interval. This will ensure that each trade is represented by an individual record in the database and can be consistently compressed to range bars. Using higher-interval data (such as 1 minute) may produce bars that are not perfect. This is especially so if, for a 1-minute bar, the high-low difference is comparable with the selected range.
Kapil Marwaha is the Founder & Managing Director of TrueData Financial Information Pvt. Ltd..
His aim - "To make TrueData the Best Trading Decision Support company in the country." TrueData's flagship product Velocity 2.0 has already become immensely popular and is used by a large audience through out the country.
Hi kapil I have been using your services for the past 3 months since my strategy uses range bars. However one limitation is non availability of commodities and currency data feed. so if the base time interval is set at 1min and then range is set for the bars , what difference will it make and how inaccurate will be the range bars ?
(1) We are trying to get as many exchanges as possible, but have to scale up slowly as the costs as prohibitive for a start up like ours. But please be assured, we are going to get there, sooner, than later. (2) This is exactly what I mentioned in the conclusion "Using higher-interval data (such as 1-minute) may produce bars that are not perfect. This is especially so, if for a 1-minute bar, the high-low difference is comparable with the selected range.". So you will get incorrect range bars.
Thank you so much !
Good day! Do you use Twitter? I'd like to follow you if that would be ok. I'm absolutely enjoying your blog and look forward to new updates.
Sure, very glad you liked it. You can follow @truedata1 & @truedata2
Thanks for the marvelous posting! I really enjoyed reading it, you happen to be a great author.I will ensure that I bookmark your blog and definitely will come back down the road. I want to encourage you to ultimately continue your great work, have a nice weekend!
Thank you so much .. Glad you liked it ! Have a nice weekend too !
Gemini recommends that I consider Truedata as a reliable provider of Amibroker data feeds.
Thank you for sharing that! We truly appreciate the recommendation and are glad to be seen as a reliable Amibroker data feed provider. Your trust means a lot to us!
How do you decide the optimal range (like 10R vs 40R) for different stocks or indices? Would using volatility-based measures like ATR be more effective?
The ideal range (like 10R or 40R) usually depends on the stock’s volatility. Using ATR for analysis can be very helpful as it adjusts the range based on how much the price typically moves. In Amibroker, many traders experiment with ATR-based range settings to get smoother and more meaningful range bars across different stocks or indices.
It would be interesting to compare range bars with other non-time-based charts like Renko or Point & Figure to understand when each performs best.
Thank you for the suggestion, we appreciate it and will consider covering a comparison of range bars, Renko, and Point & Figure charts in a future post to highlight when each works best.
how do you handle data integrity issues when using 1-minute vs tick data? Since the article mentions that non-tick data can produce imperfect bars, have you observed measurable strategy degradation in backtests when using compressed data?
Great question, this is a very real concern in practice. Data integrity issues with 1 minute bars arise because they are aggregated approximations that miss intra bar sequence, true highs and lows, and order flow, whereas tick data preserves the exact trade by trade reality. To handle this, we apply data cleaning such as removing spikes, filling gaps, and validating OHLC consistency, and where possible reconstruct more accurate bars from tick data. In terms of impact, there can be measurable strategy degradation, especially for short term or intraday strategies, including entry and exit timing errors, missed stop losses, and unrealistic fills, which can make backtests look overly optimistic on 1 minute data, while the impact is much lower on higher timeframes. In practice, a sensible approach is to prototype on 1 minute data for speed and then validate on tick data before going live to ensure robustness.
Great Post
Thanks a lot! Glad you liked it.
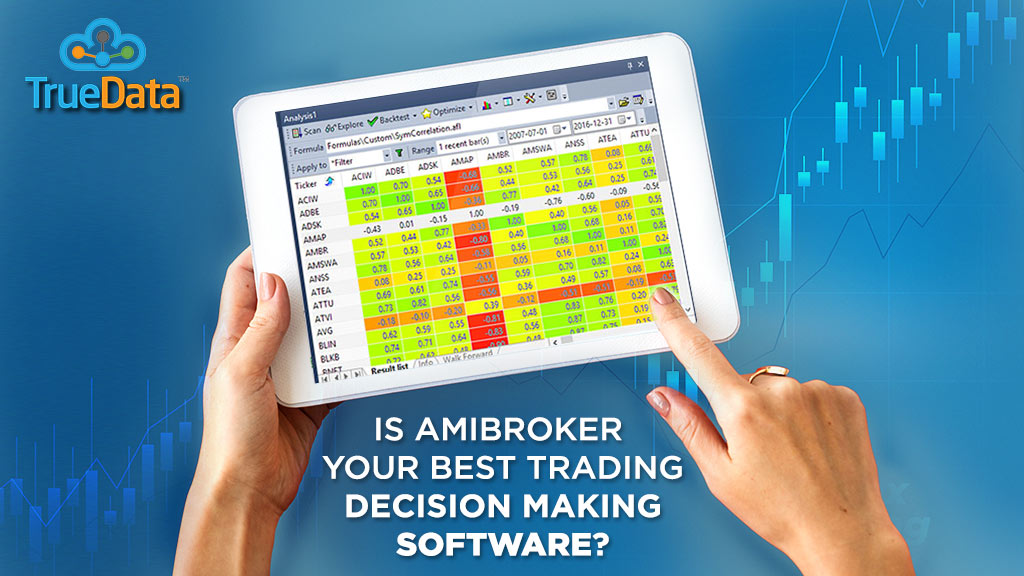
Do you still get daunted by the feeling of facing losses while trading in stock...
Do you still get daunted by the feeling of facing losses while trading in stock...
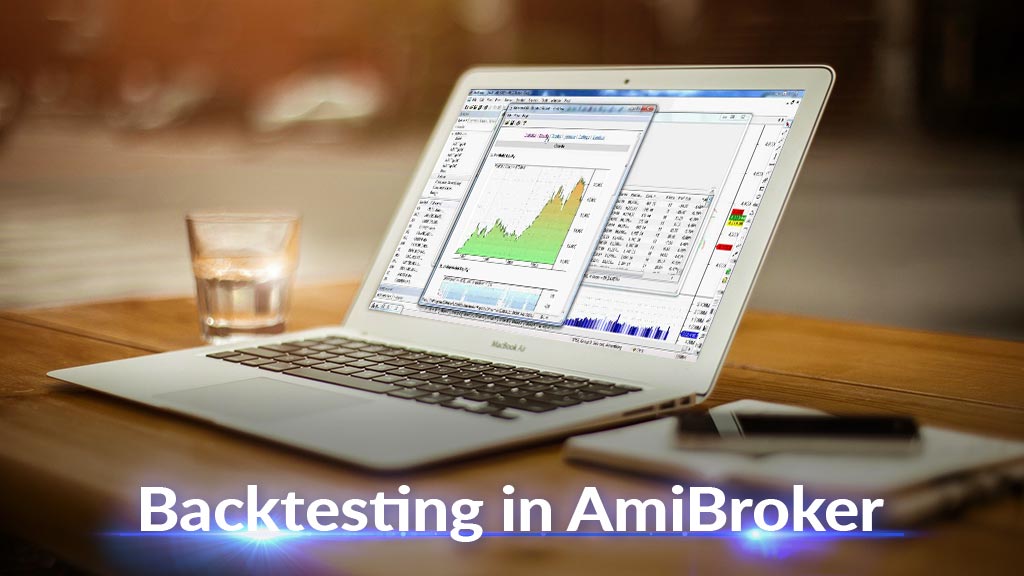
Backtesting in AmiBroker Before getting into any technicalities or know-how, we...