What are the topmost factors to be considered while making any investment decision? The immediate answer that you will get from the majority of investors or traders is the risk involved and the returns to be made. This makes it a top priority for any investor or trader to understand the concept of risk and return on any investment or trade and the relationship between them. Check out this blog to learn all about the risk-return trade-off and how to use it to create a successful trading portfolio.
Read More: What is Support and Resistance in Technical Analysis?

The risk-return trade-off is a fundamental concept in finance that reflects the relationship between the potential for higher returns and the level of risk associated with an investment. This trade-off implies that investors must make a conscious decision regarding the balance between the desire for greater profits and the tolerance for potential losses.
In simpler terms, if an individual chooses to invest in assets with higher expected returns, such as stocks or real estate, they typically expose themselves to a greater level of risk, as the value of these assets can be more volatile. On the other hand, safer investments like government bonds or fixed deposits offer lower potential returns but come with a lower risk of significant losses.
Risk-return trade-off is also an important factor in charting out financial goals and the strategies to meet them. For example, younger investors might be more willing to take on higher risk for the potential of greater returns, as they have a longer investment horizon to recover from any market downturns. Conversely, those nearing retirement might prioritise capital preservation and opt for lower-risk investments to safeguard their savings.
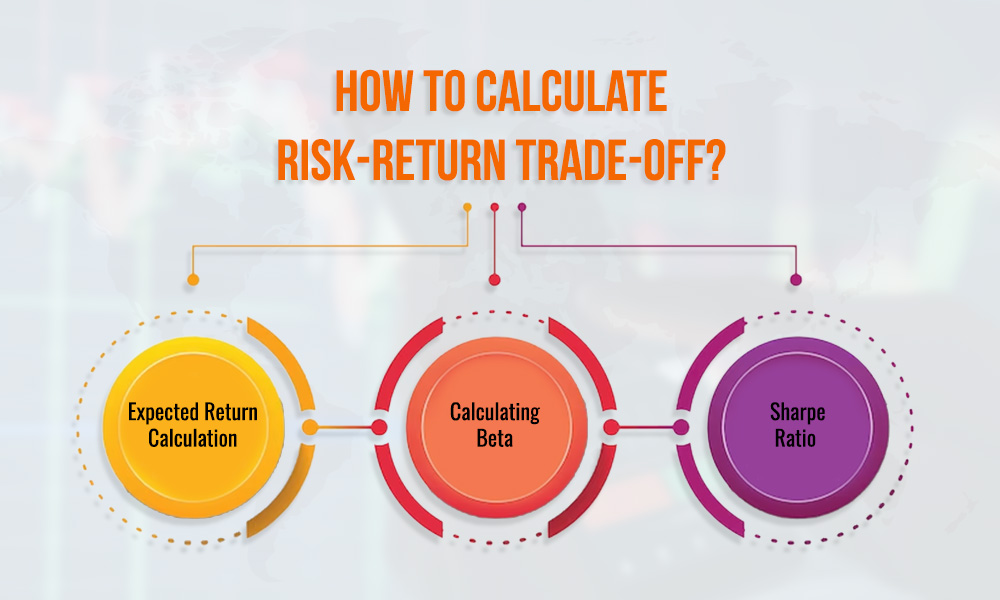
The risk-return trade-off is a critical concept in finance that involves evaluating the potential returns of an investment against the level of risk associated with it. The process involves evaluating the expected return, measuring risk through standard deviation, and utilising relevant metrics like the Sharpe Ratio.
The expected return from a stock investment is the anticipated profit or loss over a specified period. The formula for expected return is,

Expected Return = [(Ending Stock Price − Beginning Stock Price + Dividends) / Beginning Stock Price] x 100
This formula considers both capital gains (change in stock price) and any dividends received.
Beta is a measure that helps investors understand how a particular stock moves in relation to the overall market. The market is often represented by a benchmark index which could be the Nifty 50 or the BSE Sensex. To calculate Beta, two key measures are involved, namely, variance and covariance. Variance measures how the overall market moves relative to its average, and covariance measures how a specific stock's returns move in relation to the market's returns. The formula is,

Beta = Covariance of Stock Returns with Market Returns / Variance of Market Returns
If a stock has a Beta of 1%, it is highly correlated with the benchmark index. For example, if the Nifty 50 or BSE Sensex goes up by a certain percentage, this stock is likely to move similarly.
If a stock has a Beta of zero, it is not very correlated with the benchmark index. Movements in the overall market may not strongly impact this stock.
If a stock has a negative Beta (e.g., -1%), it is inversely correlated to the benchmark. This means it tends to move in the opposite direction to the market. If the benchmark goes up, this stock might go down, and vice versa.
A Beta is a tool that investors can use to gain insights into a stock's behaviour compared to the broader market. For instance, if a stock consistently outperforms or underperforms during certain market conditions, Beta can help explain the reasons behind this relative performance. It aids investors in understanding the level of risk associated with a particular stock and whether it tends to be more or less volatile than the overall market.
The Sharpe Ratio is a valuable tool for assessing the risk-adjusted return of a stock investment. The formula is,

Sharpe Ratio = Stock Return − Risk-Free Rate/ Stock Standard Deviation
In this formula, the risk-free rate is the return on a risk-free investment, often represented by government bonds. The Sharpe Ratio allows investors to compare the risk-adjusted performance of different stocks.
The calculation of standard deviation in the above formula is shown hereunder.
Standard Deviation = √( (∑ (x1– x¯)2 )/(n-1)),
Where,
x1 represents each individual data point in the dataset.
x¯ is the mean (average) value of all the data points.
N is the total number of data points in the dataset.

The risk-return trade-off is a crucial concept that helps investors make informed decisions aligned with their financial goals and risk tolerance. The use of the risk-return trade-off concept is explained hereunder.
The process of investment for any investor begins with clearly setting financial goals. Establishing these goals provides a roadmap for the entire investment journey. Financial goals can vary widely, from accumulating wealth for a comfortable retirement to funding a child's education. The clarity of these objectives is instrumental in shaping the overall investment strategy. Investors must consider their unique circumstances, aspirations, and timelines when defining these goals, ensuring that the subsequent investment decisions are purposeful and aligned with their financial vision.
The key to a successful investment portfolio is to objectively assess the risk tolerance. This involves evaluating personal factors such as age, financial stability, and the emotional capacity to withstand market fluctuations. Younger investors often find themselves more inclined towards higher-risk investments due to their longer investment horizon and ability to recover from market downturns. Understanding one's risk tolerance is a fundamental step in crafting a balanced portfolio that seeks an optimal trade-off between potential returns and acceptable levels of risk.
Risk-return trade-off can also be used to analyse potential returns from any investment. investors should delve into factors such as historical performance, earnings reports, and future growth prospects. Identifying stocks with growth potential aligned with the investor's goals is key. By conducting meticulous research, investors can gauge the potential returns of different investment options, facilitating the creation of a portfolio that aligns with their financial objectives.
Another important use of this concept is in creating a diversified portfolio. Diversification involves spreading investments across various sectors and industries, mitigating the impact of poor performance in any single stock. This risk management approach seeks to optimise returns while reducing the overall risk exposure. Building a well-diversified portfolio helps investors navigate market fluctuations and enhances the resilience of their investments in the face of sector-specific challenges.
The concept of risk-return trade-off is one of the fundamental pillars of building a robust investment strategy as well as having a sound investment or trading portfolio. A continuous monitoring of the risk-return trade-off of various investments also helps in aligning the portfolio from time to time with the changing market dynamics thereby having a clear direction towards the end goal.
We hope this article was able to give you a brief idea of this concept and help in a better understanding of market-related terms. Let us know if you need us to cover any more such terms and we will take them up in our coming blog.
Till then Happy Reading!
Marisha Bhatt is a financial content writer @TrueData.
She writes with the sole aim of simplifying complex financial concepts and jargon while attempting to clarify technical and fundamental analysis concepts of the stock markets. The ultimate goal is to spread vital knowledge and benefit the maximum audience. Her Chartered Accountant background acts as the knowledge base to help clarify crucial concepts and create a sound investment portfolio.
NSE Stock Prices in Excel in Real Time - Microsoft Excel is a super software cap...

Buying shares from the stock market seems to be an easy task - as it can be done...

Market eye filters is made creatively to help you take advantage of market oppor...

There are very few things that investors agree on, and one of them is that earni...